

Abstract
Objectives. We examined the effects of maternal and provider characteristics on the up-to-date immunization status of children.
Methods. We used data from the 2003 National Immunization Survey to determine variations in children’s up-to-date status in the 4:3:1:3 immunization series.
Results. Low maternal educational levels and low socioeconomic status were associated with high 4:3:1:3 series completion rates. Also, completion rates were high in Hispanic and non-Hispanic Black families with low income-to-poverty ratios.
Conclusions. We found that children of less educated mothers and children in Hispanic and non-Hispanic Black families with low income-to-poverty ratios were more likely to have completed the 4:3:1:3 series. Although the reasons for these results need further exploration in other data sets, possible factors are Hispanics’ positive cultural attitudes regarding the needs and importance of young children and provision of information on immunizations to low-income minority mothers who access government-subsidized health care programs.
Childhood immunization is a widely accepted public health strategy and an indicator of adequate health care use. Vaccinations are one of the simplest and most effective approaches to protecting the health of our children.1 However, immunization levels are not as high as they should be.2 Healthy People 2010 objectives call for administration of recommended vaccines to 90% or more of children by the age of 2 years and elimination of disparities in primary health key indicators, including immunizations.3–5
Recent studies show that these goals are far from being met.6,7 More than 85% of children aged 19 to 35 months have been projected to have coverage for diphtheria, tetanus, and pertussis and varicella. In addition, more than 90% have been projected to have coverage for measles, mumps, and rubella (MMR); hepatitis B; and polio and approximately 73% are projected to have coverage for the 4:3:1:3 series (4 or more doses of diphtheria and tetanus toxoids and the pertussis vaccine [DTP/DT], 3 or more doses of poliovirus vaccine, 1 or more doses of measles-containing vaccine [MCV], and 3 or more doses of Haemophilus influenzae type b [Hib]).8–10 Although these results are promising, there are disparities in immunization rates among minority and vulnerable populations. There are also inconsistencies in administration of vaccinations during children’s first 2 years of life.
Many studies have examined factors that contribute to whether or not children are up to date on recommended immunizations as well as immunization compliance rates.11–14 A study conducted by the Centers for Disease Control and Prevention showed that 18% of children in the United States receive the recommended vaccinations within their first 2 years of life.3 Luman et al. showed that 55% of children lacked the recommended vaccinations during the first 2 years of life and that 9% received all recommended vaccinations at the recommended ages.15 Hughart et al. found a strong link between the demographic characteristics of a child’s family and undervaccination.16 In addition, research has shown that minority children in general, but particularly minority children who live below the poverty line, are less likely than are White children to have received the recommended vaccines by age 2 years.17
Immunization rates are also affected by race/ethnicity, age, and type of vaccine. In one study focusing on children who entered kindergarten in 1992, immunization rates were examined retrospectively from the ages of 2 to 48 months. At age 16 months, 45% of non-Hispanic White children had been vaccinated, as compared with 25% of Black children, 30% of American Indian children, 30% of White Hispanic children, and 28% of Asian/Pacific Islander children.18 In 2001, the Centers for Disease Control and Prevention reported that 77% of children aged 19 to 35 months were up to date on the 4:3: 1:3 series.10 Williams et al. reported that substandard immunization rates were most prevalent among members of disadvantaged populations.19
Some of the factors that affect whether or not children are up to date on immunizations include economic, provider, and parental variables; availability of vaccines; and vaccination policies. In addition, children in households with 2 or more other children, children with unmarried mothers having no postsecondary education, non-Hispanic Black children, children whose families use public immunization service providers, and children in families in which more than 1 physician provides immunizations are at increased likelihood of experiencing immunization delays (i.e., delays of 30 days or more above the recommended vaccination point).20 Improvements in rates of compliance with national immunization guidelines are imperative. Mell et al. showed that the rate of full compliance with recommended immunization guidelines was about 35.6%, and they showed that 29.7% of children had missed opportunities for immunizations.21
Dombkowski et al. showed that children whose parents had health insurance coverage and a primary source of medical care were more likely than children with no coverage or source of care to have been vaccinated at appropriate ages, and these factors also led to increases in up-to-date immunization rates; however, provider characteristics did not have a major influence on up-to-date status. Health insurance coverage was associated with a 13% increase in the likelihood of age-appropriate vaccination and a 2% increase in up-to-date status for MMR.22 In comparing children who had a usual source of care and received at least some of their vaccinations from that source with children who did not have a usual source of care, Santoli et al. found that the former had 1.15 times the odds of being up to date for the 4:3:1:3 series.23 Moreover, several studies have examined the role of maternal characteristics in immunization rates and found associations between undervaccination and maternal factors such as marital status, race, education, poverty, and age.24–28 Given these findings, it is essential that system-level factors (i.e., access to a usual source of care and health insurance) and maternal factors be integrated into programs designed to improve immunization rates.22,29
The purpose of this study was to assess the effects of maternal and provider characteristics on children’s up-to-date status on age-appropriate immunization series. We also expected that unforeseen factors might have effects on up-to-date status. We hypothesized that rates of completion of the 4:3:1:3 immunization series would vary according to maternal sociodemographic characteristics and number of children aged younger than 18 years in the household and that delays in completion of age-appropriate immunizations would be associated with economic barriers as well as maternal racial/ethnic background.
METHODS
We obtained data for the study from the 2003 version of the National Immunization Survey (NIS). The NIS, sponsored by the National Immunization Program, was a random-digit-dialing nationwide household survey focusing on vaccinations.30 The target population was children who were aged 19 to 35 months and living in the United States at the time their mothers were interviewed. The children covered in the 2003 survey were born between January 2000 and July 2002. Information derived from interviews was validated via mail surveys completed by the health care providers who administered the children’s vaccinations.
NIS data are gathered from 78 Immunization Action Plan areas consisting of the 50 states, the District of Columbia, and 27 large urban areas. These data provide detailed retrospective longitudinal information on vaccination completion rates and timing as well as sociodemographic characteristics of the child, mother, and family.
The original sample included 30930 children. Our sample was selected according to the following criteria: the child had complete provider records indicating the extent to which vaccines were administered in a timely manner (n=13013); household records were available showing the child’s up-to-date status on the 4:3:1:3 immunization series (n= 21738); and there were no missing data on maternal characteristics included in the statistical analyses. We recognized that by including the first criterion just described children in our sample would have a higher likelihood of being up to date.30 The final sample included 11860 children aged 19 to 35 months.
Federal guidelines recommend that children complete the 4:3:1:3 immunization series by age 18 months.9 Because all of the children in our study sample were aged 19 to 35 months, the 4:3:1:3 immunization series should have been completed by the time our data were collected. The results of preliminary analyses indicated some inconsistencies between household and provider records of children’s up-to-date status. We expected such inconsistencies as well as inaccuracy of information, because not all households reported up-to-date status using information from their written vaccination record. In all of our multivariate analyses, we accounted for these discrepancies with control for information from the vaccination record. The NIS collected information about children’s providers and verified up-to-date status through reviews of immunization records received directly from providers.
We constructed event indicators from a set of provider records that included a timetable of vaccine administrations with respect to birth date. In particular, we used providers’ records on the timing of the fourth DTP/DT, third polio, third Hib, and first MCV vaccines. We classified children as being up to date (according to national guidelines) on immunizations if they had been administered all of the vaccines included in the 4:3:1:3 immunization series by age 18 months. We classified children as not being up to date if they had not been administered all of the vaccinations in the 4:3:1:3 immunization series by their 18th month. We constructed a duration variable to determine the number of months between birth and completion of the 4:3:1:3 immunization series.
Characteristics assessed as predictors of up-to-date status included mother’s age and educational level, race and ethnicity of child, number of children in the family aged younger than 18 years, mother’s marital status, and family income-to-poverty ratio (IPR). We used child’s race/ethnicity as a proxy of mother’s race/ethnicity because the NIS does not report the mother’s race and ethnicity. Although the NIS collects data on other variables that can be used as a proxy of mother’s race/ethnicity (e.g., language in which interview is conducted), we believe that child race/ethnicity is the best alternative, assuming that all mothers are biological mothers.
We used the IPR, which compares people’s income with their poverty threshold (which was determined using family income, number of persons in the household, number of children in the household, and the 2002 US Census poverty thresholds) and is expressed as a fraction, to explore possible variations in up-to-date status according to socioeconomic status. The IPR can be used not only to categorize people as above or below the poverty line but also to measure degree of poverty. An IPR of less than 1 indicates that a family is below the poverty level; an IPR of 1 indicates that a family is at the poverty level; and an IPR of greater than 1 indicates that a family is above the poverty level. We recoded raw IPR values to construct 4 categories: less than 1, 1 to 1.99, 2 to 2.99, and 3 or more.
We calculated weighted percentages for maternal and provider variables according to children’s up-to-date status. We used univariate logistic regression analyses to assess variables in terms of their significance as predictors of up-to-date status. Variables shown to be significant univariate predictors, as well as those of obvious theoretical importance, were included in subsequent multivariate analyses.
We used the Kaplan–Meier method to calculate weighted quartile estimates of elapsed time before completion of the 4:3:1:3 series and assessed log-rank tests for equality over strata of 2 variables of theoretical importance, race/ethnicity and number of children aged younger than 18 years in the household. Using variables we had identified as possible univariate predictors, we constructed multivariate Cox proportional hazard regression models to examine whether maternal characteristics were predictive of variations in rates of children’s up-to-date status on the 4:3:1:3 series. In particular, we examined how each factor contributed to delays in completion of age-appropriate immunizations. All statistical analyses were performed with SUDAAN with adjustment for the substantial oversampling of Immunization Action Plan areas and members of certain minority groups in the NIS.31
RESULTS
Table 1 ▶ shows sample characteristics (n = 11 860) stratified according to up-to-date status, that is, by completion (n = 9510) or noncompletion (n = 2350) of the 4:3:1:3 immunization series by the age of 18 months. Forty-six percent of children in the sample had mothers who were aged 29 years or younger. A majority of the mothers either were high-school graduates or had completed more than 12 years of education. Hispanic and non-Hispanic White children made up 23.9% and 56.1% of the sample, respectively. Most children (61.2%) were from households with 2 or 3 children aged younger than 18 years; 26% resided in households with IPRs below 1. Sixty-three percent of households used information from the vaccination record to report immunization status.
TABLE 1—
Weighted Percentages for the Maternal and Provider Characteristics Used in the Analyses for the Full Sample, by Up-to-Date (UTD) Immunization Status: US National Immunization Survey, 2003
| UTD Status, Weighted % (SD) | ||||
| Sample | Not UTD | UTD | Pa | |
| Mother’s age, y | .001 | |||
| ≤ 29 | 45.7 (0.8) | 50.7 (1.6) | 44.4 (0.9) | |
| ≥ 30 | 54.3 (0.8) | 49.3 (1.6) | 55.6 (0.9) | |
| Mother’s educational level | .001 | |||
| Less than high school | 18.1 (0.7) | 19.5 (1.5) | 17.7 (0.8) | |
| High school | 29.8 (0.7) | 32.7 (1.6) | 29.1 (0.8) | |
| Some college | 23.2 (0.7) | 24.1 (1.4) | 23.0 (0.7) | |
| College | 28.9 (0.6) | 23.7 (1.2) | 30.3 (0.7) | |
| Child’s race/ethnicityb | .001 | |||
| Non-Hispanic other/multiracial | 8.6 (0.4) | 8.3 (0.8) | 8.6 (0.5) | |
| Non-Hispanic Black | 11.4 (0.5) | 16.1 (1.4) | 10.2 (0.5) | |
| Hispanic | 23.9 (0.6) | 22.7 (1.4) | 24.2 (0.7) | |
| Non-Hispanic White | 56.1 (0.7) | 52.9 (1.6) | 57.0 (0.8) | |
| No. of children aged younger than 18 years | .001 | |||
| ≥ 4 | 13.3 (0.6) | 19.1 (1.4) | 11.8 (0.6) | |
| 2–3 | 61.2 (0.8) | 61.5 (1.6) | 61.1 (0.8) | |
| 1 | 25.5 (0.6) | 19.4 (1.3) | 27.1 (0.7) | |
| Mother’s marital status | .001 | |||
| Divorced/separated/widowed/deceased | 7.9 (0.4) | 9.9 (1.0) | 7.4 (0.5) | |
| Never married | 18.7 (0.6) | 23.9 (1.5) | 17.3 (0.7) | |
| Married | 73.4 (0.7) | 66.2 (1.6) | 75.3 (0.8) | |
| Income-to-poverty ratio | .001 | |||
| < 1 | 25.6 (0.7) | 29.4 (1.6) | 24.6 (0.8) | |
| 1–1.99 | 25.0 (0.7) | 27.9 (1.5) | 24.2 (0.8) | |
| 2–2.99 | 15.5 (0.5) | 16.0 (1.2) | 15.4 (0.6) | |
| ≥ 3 | 33.9 (0.7) | 26.7 (1.4) | 35.8 (0.8) | |
| Information reported from vaccination card | .001 | |||
| No | 36.6 (0.7) | 43.9 (1.7) | 34.7 (0.8) | |
| Yes | 63.4 (0.7) | 56.1 (1.7) | 65.3 (0.8) | |
| Provider offers comprehensive care | .004 | |||
| All providers | 84.7 (0.5) | 80.6 (1.4) | 85.7 (0.6) | |
| Some but not all providers | 7.5 (0.4) | 9.1 (0.9) | 7.1 (0.4) | |
| No provider/provider unknown | 7.8 (0.4) | 10.3 (1.1) | 7.1 (0.4) | |
| Provider offers acute illness care | .058 | |||
| All providers | 74.8 (0.6) | 71.7 (1.5) | 75.6 (0.7) | |
| Some but not all providers | 9.4 (0.4) | 10.8 (1.0) | 9.0 (0.5) | |
| No provider/provider unknown | 15.9 (0.5) | 17.5 (1.3) | 15.4 (0.6) | |
| Provider offers follow-up visits | .038 | |||
| All providers | 77.1 (0.6) | 73.9 (1.5) | 78.0 (0.7) | |
| Some but not all providers | 9.4 (0.4) | 10.6 (1.0) | 9.0 (0.5) | |
| No provider/provider unknown | 13.5 (0.5) | 15.5 (1.3) | 13.0 (0.6) | |
| Provider offers after-hours telephone services | .003 | |||
| All providers | 62.7 (0.7) | 58.5 (1.6) | 63.9 (0.8) | |
| Some but not all providers | 10.5 (0.5) | 13.2 (1.1) | 9.8 (0.5) | |
| No provider/provider unknown | 26.8 (0.7) | 28.3 (1.5) | 26.4 (0.8) | |
| Provider offers WIC program or services | .048 | |||
| All providers | 25.4 (0.7) | 25.2 (1.5) | 25.5 (0.7) | |
| Some but not all providers | 8.9 (0.5) | 11.3 (1.1) | 8.3 (0.5) | |
| No provider/provider unknown | 65.7 (0.7) | 63.6 (1.6) | 66.3 (0.8) | |
| Provider offers other services | .038 | |||
| All providers | 7.8 (0.4) | 9.7 (1.0) | 7.3 (0.4) | |
| Some but not all providers | 6.4 (0.4) | 7.1 (0.9) | 6.2 (0.4) | |
| No provider/provider unknown | 85.8 (0.5) | 83.2 (1.3) | 86.5 (0.6) | |
| Provider reports vaccines to immunization registry | .175 | |||
| All providers | 33.7 (0.7) | 31.4 (1.5) | 34.3 (0.8) | |
| Some but not all providers | 8.8 (0.4) | 9.5 (0.9) | 8.6 (0.5) | |
| No provider | 38.4 (0.7) | 37.9 (1.6) | 38.5 (1.6) | |
| Unknown | 19.2 (0.6) | 21.2 (1.4) | 18.6 (0.7) | |
| Provider participates in Vaccines for Children program | .067 | |||
| All providers | 77.4 (0.6) | 76.0 (1.4) | 77.8 (0.7) | |
| Some but not all providers | 6.3 (0.3) | 7.9 (0.9) | 5.8 (0.4) | |
| No provider | 8.3 (0.4) | 7.3 (0.8) | 8.5 (0.5) | |
| Unknown | 8.0 (0.4) | 8.9 (1.0) | 7.8 (0.4) | |
| Provider facility type | .184 | |||
| All public | 14.3 (0.5) | 14.9 (1.1) | 14.2 (0.6) | |
| All hospital | 7.8 (0.4) | 7.7 (0.9) | 7.9 (0.5) | |
| All private | 61.8 (0.7) | 58.7 (1.6) | 62.7 (0.8) | |
| All military/other | 1.5 (0.2) | 1.2 (0.3) | 1.6 (0.2) | |
| All WIC | 0.3 (0.1) | 0.3 (0.2) | 0.2 (0.1) | |
| Mixed (1 or more of these subcategories) | 9.7 (0.5) | 11.3 (1.1) | 9.2 (0.5) | |
| Unknown | 4.6 (0.3) | 5.9 (0.8) | 4.3 (0.3) | |
| Unweighted sample, no.c | 11 860 | 2 350 | 9 510 | |
| Weighted sample, no. | 2 968 008 | 619 771 | 2 348 237 | |
Note. WIC = Special Supplemental Nutrition Program for Women, Infants, and Children. National Immunization Survey data include information relating to UTD status on individual vaccinations as well as several vaccination series. Information about children’s providers was collected, and UTD status was verified via reviews of immunization records received directly from providers. Provider records included accurate information on vaccine administration, and age was reported in months and days. As a result of rounding, column values may not sum to 100.
aUnivariate logistic regression models were used to screen for possible predictors of UTD status. Maternal characteristics with P values below .05 were included in subsequent multivariate analyses.
bUsed as a proxy for mother’s race/ethnicity.
cReflects number of respondents included in the analysis.
Table 1 ▶ also presents the weighted percentages for provider variables, stratified according to child’s up-to-date status. Most providers offered comprehensive care (84.7%), care for acute illnesses (74.8%), follow-up visits (77.1%), and after-hours telephone services (62.7%) and participated in the Vaccines for Children program (77.4%). Only 25% of providers offered Special Supplemental Nutrition Program for Women, Infants, and Children (WIC) services or other similar services. Approximately 62% of facilities were private (61.8%); only 14.8% were public.
Weighted Kaplan–Meier survival curves were assessed for number of children aged younger than 18 years in the household and child’s racial/ethnic background (data not shown). Results from log-rank tests allowed us to reject the equality assumption (P < .001). This finding partially supported our hypothesis that up-to-date rates would vary according to child race/ethnicity and number of children aged younger than 18 years in the household.
Figure 1 ▶ shows cumulative percentages of children completing the 4:3:1:3 immunization series according to mother’s race/ethnicity and household IPR. Children with Hispanic mothers and children residing in households with IPRs below 1 were most likely to have received the required immunizations at or before 18 months from birth.
FIGURE 1—
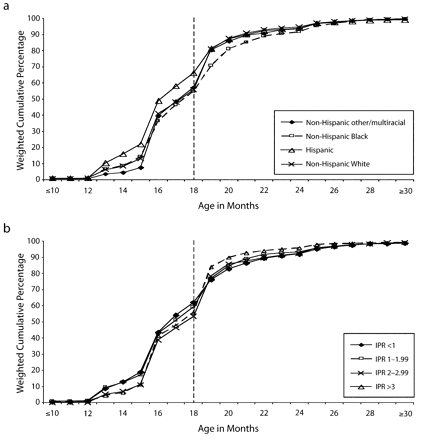
Weighted cumulative percentages of children up to date on the 4:3:1:3 immunization series, by race/ethnicity (a) and income-to-poverty ratio (IPR) (b): National Immunization Survey, 2003.
Note. Dotted line indicates 18 months from birth, the age at which the children should have completed the required immunization series.
Table 2 ▶ shows hazard ratios (HRs; ratios of median survival times) and 95% confidence intervals (CIs) derived from weighted multivariate Cox regression analyses. Longer survival times reflected delays in the timely completion of the 4:3:1:3 immunization series. Models 1 through 3 suggested that mother’s age and educational level did not have any added effects on rates of 4:3:1:3 immunization series completion among Hispanics or non-Hispanic Blacks.
TABLE 2—
Results of Multivariate Cox Proportional Hazard Regression Analyses (Hazard Ratios [HRs] and 95% Confidence Intervals [CIs]) Estimating Effects of Selected Characteristics on Completion of 4:3:1:3 Immunization Series: US National Immunization Survey, 2003
| Model 1, HR (95% CI) | Model 2, HR (95% CI) | Model 3, HR (95% CI) | Model 4, HR (95% CI) | Model 5, HR (95% CI) | Model 6, HR (95% CI) | |
| Child’s race/ethnicity | ||||||
| Non-Hispanic other/multiracial | 0.98 (0.88, 1.09) | 0.98 (0.81, 1.09) | 0.98 (0.88, 1.09) | 0.96 (0.86, 1.07) | 0.97 (0.87, 1.09) | 0.97 (0.87, 1.08) |
| Non-Hispanic Black | 0.84 (0.74, 0.95)** | 0.84 (0.74, 0.96)** | 0.84 (0.74, 0.96)** | 0.85 (0.75, 0.97)** | 0.89 (0.78, 1.02) | 0.89 (0.78, 1.02) |
| Hispanic | 1.11 (1.02, 1.21)** | 1.11 (1.02, 1.22)** | 1.10 (1.01, 1.21)* | 1.11 (1.01, 1.22)* | 1.12 (1.02, 1.23)* | 1.11 (1.01, 1.22)* |
| Non-Hispanic White (reference) | 1.00 | 1.00 | 1.00 | 1.00 | 1.00 | 1.00 |
| Mother’s age, y | ||||||
| ≤ 29 | 0.96 (0.90, 1.03) | 0.97 (0.90, 1.04) | 0.93 (0.86, 0.99)* | 0.95 (0.88, 1.02) | 0.95 (0.88, 1.03) | |
| 30 (reference) | 1.00 | 1.00 | 1.00 | 1.00 | 1.00 | |
| Mother’s educational level | ||||||
| Less than high school | 1.04 (0.91, 1.18) | 1.11 (0.97, 1.25) | 1.16 (1.02, 1.32)* | 1.16 (1.01, 1.33)* | ||
| High school | 0.86 (0.96, 1.04) | 0.99 (0.91, 1.07) | 1.02 (0.94, 1.11) | 1.03 (0.94, 1.12) | ||
| Some college | 0.99 (0.91, 1.08) | 1.02 (0.94, 1.11) | 1.04 (0.95, 1.13) | 1.05 (0.96, 1.14) | ||
| College (reference) | 1.00 | 1.00 | 1.00 | 1.00 | ||
| No. of children aged younger than 18 years | ||||||
| ≥ 4 | 0.69 (0.60, 0.79)*** | 0.68 (0.59, 0.77)*** | 0.68 (0.59, 0.78)*** | |||
| 2–3 | 0.86 (0.80, 0.92)*** | 0.85 (0.79, 0.91)*** | 0.85 (0.79, 0.91)*** | |||
| 1 (reference) | 1.00 | 1.00 | 1.00 | |||
| Mother’s marital status | ||||||
| Divorced/separated/widowed/ deceased | 0.84 (0.73, 0.96)** | 0.83 (0.73, 0.96)*** | ||||
| Never married | 0.86 (0.77, 0.97)** | 0.86 (0.76, 0.96)*** | ||||
| Married (reference) | 1.00 | 1.00 | ||||
| Income-to-poverty ratio | ||||||
| < 1 | 1.01 (0.89, 1.13) | |||||
| 1–1.99 | 0.97 (0.88, 1.08) | |||||
| 2–2.99 | 0.93 (0.85, 1.02) | |||||
| ≥ 3 (reference) | 1.00 | |||||
| Information reported from vaccination card (control variable) | ||||||
| No | 0.82 (0.76, 0.88)*** | 0.82 (0.76, 0.88)*** | 0.82 (0.76, 0.88)*** | 0.83 (0.77, 0.89)*** | 0.83 (0.78, 0.89)*** | 0.83 (0.78, 0.89)*** |
| Yes (reference) | 1.00 | 1.00 | 1.00 | 1.00 | 1.00 | 1.00 |
Note. All variables included in the multivariate models were treated as time fixed (non–time dependent). A total of 9510 children completed the vaccination series.
* P < .05; **P < .01; ***P < .001.
Model 4 showed that children of non-Hispanic Black mothers (HR=0.85; 95% CI=0.75, 0.97) were significantly less likely than children of non-Hispanic Whites to have completed the 4:3:1:3 immunization series within 18 months of their birth. Also, model 4 suggested that children of young mothers had a decreased likelihood of completing the 4:3:1:3 immunization series by this point; the completion rate was 7% lower among children of mothers aged 29 years and younger (HR=0.93; 95% CI=0.86, 0.99) than among children of mothers aged 30 years and older. Marital status and low IPR did not contribute significantly to further variability in completion rates among children of non-Hispanic Black or Hispanic mothers.
Model 6 (Table 2 ▶) shows the full model including all of the predictors assessed. Our results confirmed previous findings indicating that the presence in the household of more than 1 child aged younger than 18 years is predictive of delay in completion of the 4:3:1:3 immunization series. Completion rates in families with 4 or more children aged younger than 18 years (HR = 0.68; 95% CI = 0.59, 0.78) and those with 2 or 3 children (HR = 0.85; 95% CI = 0.79, 0.91) were 32% and 15%, respectively (the reference group in these comparisons was families with 1 child).
Lower completion rates were associated with single motherhood; the rate among children of mothers who had never been married was 14% (HR=0.86; 95% CI=0.76, 0.96), whereas the rate among children of mothers in all other marital status categories combined was 17% (HR=0.83; 95% CI=0.73, 0.96). After we controlled for other factors, completion rates were higher among children of mothers with less than 12 years of education (HR=1.16; 95% CI=1.01, 1.33) than among children of mothers with college degrees. Delays in completion were associated with IPRs above 3.
In model 7 (Table 3 ▶), we tested whether or not the relationships between mother’s minority status and rate of timely completion of the 4:3:1:3 immunization series varied according to differences in IPRs. We included interaction terms between mother’s race/ethnicity and IPR. We found that the effects of low IPRs on timely completion were significantly different among non-Hispanic Blacks and Hispanics. In a comparison of mothers residing in households with IPRs below 1 and mothers residing in households with IPRs above 3, hazard ratios for completing the immunization series were 4% higher for those of non-Hispanic Black ethnicity (HR = 1.04) and 12% higher for those of Hispanic ethnicity (HR = 1.12). Relative to mothers in the reference category, those residing in households with IPRs above 3, the hazard ratio for timely completion was 13% (HR = 0.81) lower for non-Hispanic Black mothers residing in households with IPRs between 1 and 1.99.
TABLE 3—
Full Model Including Interaction Effects Between Mother’s Race/Ethnicity and Family Income-to-Poverty Ratio: US National Immunization Survey, 2003
| Hazard Ratio (95% Confidence Interval) | |
| Child’s race/ethnicity | |
| Non-Hispanic other/multirace | 0.98 (0.85, 1.13) |
| Non-Hispanic Black | 0.63 (0.47, 0.84)*** |
| Hispanic | 0.97 (0.80, 1.18) |
| Non-Hispanic White (reference) | 1.00 |
| Income-to-poverty ratio | |
| < 1 | 0.87 (0.74, 1.01) |
| 1–1.99 | 0.93 (0.83, 1.05) |
| 2–2.99 | 0.92 (0.83, 1.02) |
| ≥ 3 (reference) | 1.00 |
| Interaction effectsa | |
| Non-Hispanic other/multiracial × IPR < 1 | 0.89 (0.64, 1.25) |
| Non-Hispanic other/multiracial × IPR 1–1.99 | 1.11 (0.83, 1.49) |
| Non-Hispanic other/multiracial × IPR 2–2.99 | 0.95 (0.70, 1.30) |
| Non-Hispanic Black × IPR < 1 | 1.90 (1.32, 2.74)*** |
| Non-Hispanic Black × IPR 1–1.99 | 1.48 (1.01, 2.19)* |
| Non-Hispanic Black × IPR 2–2.99 | 1.20 (0.75, 1.91) |
| Hispanic × IPR < 1 | 1.33 (1.02, 1.74)* |
| Hispanic × IPR 1–1.99 | 1.13 (0.88, 1.47) |
| Hispanic × IPR 2–2.99 | 1.13 (0.84, 1.52) |
Note. IPR = income-to-poverty ratio. Model 7 included all variables used in the main effects model (model 6), but parameters are not shown here. A total of 9510 children completed the vaccination series.
aInteraction terms between child’s race/ethnicity and IPR.
* P < .05; ***P < .001.
We then assessed degrees of variation within racial/ethnic groups in rates of 4:3:1:3 immunization completion attributable to IPR. We estimated the main effects model (model 6) separately with each racial/ethnic group (data not shown). Among non-Hispanic Blacks, IPR contributed significantly to variations in completion rates. The rate of timely completion was 74% higher among non-Hispanic Blacks living in households with IPRs below 1 than among non-Hispanic Blacks living in households with IPRs above 3 (HR=1.74; 95% CI=1.17, 2.58). There were no significant IPR-specific differences among non-Hispanic Whites or Hispanics.
DISCUSSION
Our results suggest that the presence in a household of more than 1 child aged younger than 18 years is associated with delays in completion of recommended immunizations. We found that other predictors had varying influences on completion of the 4:3:1:3 immunization series. In particular, single motherhood significantly predicted delays in completion of appropriate immunizations. Completion rates also varied according to mothers’ sociodemographic characteristics. The significant differences in immunization rates observed among non-Hispanic Blacks and Hispanics further suggest that lower rates of immunization coverage may contribute to continued health disparities in these groups.
Immunization coverage among children has increased over the years.32–34 However, as indicated in this study, disparities continue in the up-to-date status of children aged 19–35 months. Other studies have shown that such disparities are increasing and thus pose a major problem in bridging the gap in immunization rates among children in different racial/ethnic groups.35,36 Chu et al.35 assessed immunization coverage rates among non-Hispanic White, non-Hispanic Black, Hispanic, and Asian preschool children and showed that, from 1996 to 2001, rates of inequality in coverage between non-Hispanic White and non-Hispanic Black children increased by an average of 1.1% per year, with an increase of only 0.5% per year between non-Hispanic White and Hispanic children.
If the problem of low immunization rates is to be addressed, the many factors that contribute to low rates, including missed opportunities, inadequate provider participation in WIC services, parental beliefs, and cultural factors, must be identified. In so doing, parental, provider, and system-level causes must be recognized. Once these factors have been identified, community-level intervention programs must be developed to address the role of each of these groups in existing immunization gaps as well as the role they can play in eliminating disparities.
Previous studies focusing on health care use have shown that Hispanics and members of other minority groups are less likely to use health care services than non-Hispanic Whites.37 Interestingly, we found the opposite pattern among Hispanic mothers and mothers at lower educational levels. After control for mother’s age, educational level, and marital status; number of children aged younger than 18 years in the household; and household IPR, the rate of 4:3:1:3 immunization completion was significantly higher among children of Hispanic mothers than among children of non-Hispanic White mothers (HR = 1.11; 95% CI = 1.01, 1.22). This result is noteworthy given that 72% of Hispanics in our sample lived in households with low IPRs. Interaction effects between mother’s race/ethnicity and IPR further suggested that completion rates were higher in Hispanic and non-Hispanic Black families with low IPRs.
We believe that these patterns observed among Hispanic and non-Hispanic Black low-income families are probably attributable to cultural differences and government-subsidized health care programs available to such families. One important factor that we believe best explains the interactions found involves the WIC immunization requirements. Low-income minority families tend to receive WIC services more frequently than non-Hispanic White families, and they must comply with the program’s immunization requirements. Environmental factors could have played a role as well. That is, providers in minority communities are more likely to offer WIC programs and services. The availability of clinics and community centers offering free vaccinations also could have contributed to these higher rates.
Cultural and ethnic difference in preventive health measures may further explain the higher rates of immunization coverage among Hispanics. Hispanic cultures involve strong family values, and parents tend to be more protective of their children.38 Thus, the Hispanic culture’s emphasis on well-being of children may amplify awareness of preventive health measures, leading to higher rates of immunization in this population.
Limitations
In 2001, results of the NIS showed that most Hispanic parents believed immunizations should be received equally by all children. Although percentage differences were not large, vaccination rates were highest among Hispanics; therefore, we expected that Hispanic parents would be more likely to seek adequate vaccination for their children. Although such data were not available from the NIS, it would be interesting to explore in more depth the ways in which parents make decisions about immunizations and to assess their attitudes toward health care.
Most studies that examine immunization rates are limited in that they use large volumes of cross-sectional data to measure whether up-to-date status varies in different subgroups. Our results present a more accurate description of rates of age-appropriate immunization over time. Additional studies can continue to improve our knowledge regarding disparities in immunization rates. Large national surveys, such as the one used in this study, are limited in that they do not provide detailed understandings of groups facing multiple social inequities. Our data were also limited in that we could not examine individuals living in non–Immunization Action Plan areas, and we lacked information on Asian Americans. Future studies should address these issues.
Conclusions
It is imperative that we focus on maternal characteristics that are barriers to immunization. It is also important that we understand, as shown by the results of this study, that less educated mothers and poor mothers from certain minority groups (in this case, Hispanic and non-Hispanic Black mothers in families with low IPRs) can be diligent in ensuring that their children received the recommended immunizations. Encouragement on the part of medical care and Medicaid providers and increased availability of such programs as Medicaid and WIC will help increase immunization rates. Providing low-income minority mothers with the necessary information about the importance of immunization can overcome lack of formal education and empower them to take advantage of the opportunities available to protect their children from preventable diseases. Interventions that target individuals and efforts to address system-level factors such as health insurance coverage and usual source of care must work in tandem if disparities in immunization are to be eliminated.
Acknowledgments
We thank Verna M. Keith and Scott T. Yabiku for commenting on drafts of the article.
Human Participant Protection No protocol approval was needed for this study.
Peer Reviewed
Contributors S.S. Kim completed the analyses. J.A. Frimpong planned the study and led the writing. P.A. Rivers and J.J. Kronenfeld supervised the study and contributed to the writing of the article.
References
- 1.Centers for Disease Control and Prevention. Ten great public health achievements—United States, 1900–1999. MMWR Morb Mortal Wkly Rep. 1999; 48:241–243. [PubMed] [Google Scholar]
- 2.Rodewald LE, Szilagi PG, Shiuh T, Humiston SG, LeBaron C, Hall CB. Is underimmunization a marker for insufficient utilization of preventive and primary care? Arch Pediatr Adolesc Med. 1995;149:393–397. [DOI] [PubMed] [Google Scholar]
- 3.Centers for Disease Control and Prevention. Vaccination coverage among children enrolled in Head Start programs and licensed child care centers and entering school—United States and selected reporting areas, 1999–2000 school year. MMWR Morb Mortal Wkly Rep. 2001;50:847–855. [PubMed] [Google Scholar]
- 4.Healthy People 2010: Understanding and Improving Health and Objectives for Improving Health. 2nd ed. Washington, DC: US Dept of Health and Human Services; 2000.
- 5.Office of Disease Prevention and Health Promotion. Healthy people 2010. Available at: http://www.health.gov/healthypeople/about/hpfact.htm. Accessed May 31, 2005.
- 6.US Dept of Health and Human Services. Healthy people 2010: understanding and improving health. Available at: http://www.healthypeople.gov/document/tableofcontents.htm#under. Accessed May 31, 2005.
- 7.National Vaccine Advisory Committee. The measles epidemic: problems, barriers, and recommendations. JAMA. 1991;266:1547–1552. [PubMed] [Google Scholar]
- 8.National, state, and urban area vaccination coverage among children aged 19–35 months: United States, 2003. MMWR Morb Mortal Wkly Rep. 2004; 53:658–661. [PubMed] [Google Scholar]
- 9.Centers for Disease Control and Prevention. Recommended childhood and adolescent immunization schedule—United States, 2005. MMWR Morb Mortal Wkly Rep. 2005;53:Q1–Q3. [PubMed] [Google Scholar]
- 10.Barker L, Luman E, Zhao Z, et al. National, state, and urban area vaccination coverage levels among children aged 19–35 months—United States, 2001. MMWR Morb Mortal Wkly Rep. 2002;51:664–666. [PubMed] [Google Scholar]
- 11.Cutts FT, Orenstein WA, Bernier RH. Causes of low preschool immunization coverage in the United States. Annu Rev Public Health. 1992;13:385–398. [DOI] [PubMed] [Google Scholar]
- 12.Santoli JM, Szilagyi PG, Rodewald LE. Barriers to immunization and missed opportunities. Pediatr Ann. 1998;27:366–374. [DOI] [PubMed] [Google Scholar]
- 13.Orenstein WA, Atkinson W, Mason D, Bernier RH. Barriers to vaccinating pre-school children. J Health Care Poor Underserved. 1990;1:315–330. [DOI] [PubMed] [Google Scholar]
- 14.National Vaccine Advisory Committee. The measles epidemic: the problems, barriers, and recommendations. JAMA. 1991;266:1547–1552. [PubMed] [Google Scholar]
- 15.Luman ET, McCauley MM, Stokley S, Chu SY, Pickering LK. Timeliness of childhood immunizations. Pediatrics. 2002;110:935–939. [DOI] [PubMed] [Google Scholar]
- 16.Hughart N, Strobino D, Holt E, et al. The relation of parent and provider characteristics to vaccination status of children in private practices and managed care organizations in Maryland. Med Care. 1999;37: 44–55. [DOI] [PubMed] [Google Scholar]
- 17.Vaccination coverage by race/ethnicity and poverty level among children aged 19–35 months—United States, 1996. MMWR Morb Mortal Wkly Rep. 1997; 46:963–968. [PubMed] [Google Scholar]
- 18.Ehresmann KR, White KE, Hedberg CW, et al. A statewide survey of immunization rates in Minnesota school age children: implications for targeted assessment and prevention strategies. Pediatr Infect Dis J. 1998;17:711–716. [DOI] [PubMed] [Google Scholar]
- 19.Williams IT, Milton JD, Farrell JB, Graham NM. Interaction of SES and provider practices as predictors of immunization coverage in Virginia children. Pediatrics. 1995;96:439–446. [PubMed] [Google Scholar]
- 20.Luman ET, Barker LE, Shaw KM, McCauley MM, Buehler JW, Pickering LK. Timeliness of childhood vaccinations in the United States: days undervaccinated and number of vaccines delayed. JAMA. 2005;293: 1204–1211. [DOI] [PubMed] [Google Scholar]
- 21.Mell LK, Ogren DS, Davis RL, et al. Compliance with national immunization guidelines for children younger than 2 years, 1996–1999. Pediatrics. 2005; 115:461–467. [DOI] [PubMed] [Google Scholar]
- 22.Dombkowski KJ, Lantz PM, Freed GL. Role of health insurance and a usual source of medical care in age-appropriate vaccination. Am J Public Health. 2004; 94:960–966. [DOI] [PMC free article] [PubMed] [Google Scholar]
- 23.Santoli JM, Rodewald L, Maes E, Battaglia M, Coronado V. Vaccines for Children Program, United States, 1997. Pediatrics. 1999;104:e15. [DOI] [PubMed] [Google Scholar]
- 24.Daniels D, Jiles RB, Klevens RM, Herrera GA. Undervaccinated African-American preschoolers. Am J Prev Med. 2001;20(suppl 4):61–68. [DOI] [PubMed] [Google Scholar]
- 25.Niederhauser VP, Baruffi G, Heck R. Parental decision-making for the varicella vaccine. J Pediatr Health Care. 2001;15:236–243. [DOI] [PubMed] [Google Scholar]
- 26.Bates AS, Wolinsky FD. Personal, financial, and structural barriers to immunization in socioeconomically disadvantaged urban children. Pediatrics. 1998; 101:591–596. [DOI] [PubMed] [Google Scholar]
- 27.Luman ET, McCauley MM, Shefer A, Chu SY. Maternal characteristics associated with vaccination of young children. Pediatrics. 2003;111:1215–1218. [PubMed] [Google Scholar]
- 28.El-Mohandes AE, Katz KS, El-Khorazaty MN, et al. The effect of a parenting education program on the use of preventive pediatric health care services among low-income, minority mothers: a randomized, controlled study. Pediatrics. 2003;111:1324–1332. [DOI] [PubMed] [Google Scholar]
- 29.Christakis DA, Mell L, Koepsell TD, Zimmerman FJ, Connell FA. Association of lower continuity of care with greater risk of emergency department use and hospitalization in children. Pediatrics. 2001;106:524–529. [DOI] [PubMed] [Google Scholar]
- 30.The 2003 National Immunization Survey. Hyattsville, Md: National Center for Health Statistics; 2004.
- 31.SUDAAN Version 9 [computer program]. Research Triangle Park, NC: Research Triangle Institute; 2004.
- 32.Kenyon TA, Matuck MA, Stroh G. Persistent low immunization coverage among innercity preschool children despite access to free vaccine. Pediatrics. 1998;101:612–616. [DOI] [PubMed] [Google Scholar]
- 33.Centers for Disease Control and Prevention. Impact of vaccines universally recommended for children—United States, 1990–1998. MMWR Morb Mortal Wkly Rep. 1999;48:243–248. [PubMed] [Google Scholar]
- 34.Centers for Disease Control and Prevention. Vaccination coverage by race/ethnicity and poverty level among children aged 19–35 months—United States, 1997. MMWR Morb Mortal Wkly Rep. 1998;47: 956–959. [PubMed] [Google Scholar]
- 35.Chu SY, Barker LE, Smith PJ. Racial/ethnic disparities in preschool immunizations: United States, 1996–2001. Am J Public Health. 2004;94:973–977. [DOI] [PMC free article] [PubMed] [Google Scholar]
- 36.Wood DL, Sherbourne CD, Halfon N, et al. Factors related to immunization status among innercity Latino and African American preschoolers. Pediatrics. 1995;96:295–301. [PubMed] [Google Scholar]
- 37.Deswal A, Petersen NJ, Souchek J, Ashton CM, Wray NP. Impact of race on health care utilization and outcomes in veterans with congestive heart failure. J Am Coll Cardiol. 2004;43:778–784. [DOI] [PubMed] [Google Scholar]
- 38.Marsiglia FF. The Ethnic Warriors: Ethnic Identity and School Achievement as Perceived by a Selected Group of Mainland Puerto Rican Students [dissertation]. Cleve-land, Ohio: Case Western Reserve University; 1990.