

Abstract
Objectives. Fruit and vegetable cost is a presumed barrier to intake. We sought to determine whether fruit and vegetable cost and consumers’ race and income would predict availability of fruits and vegetables in homes of schoolchildren in the Birmingham, Ala, area.
Methods. Data on availability of 27 fruit and vegetable items were obtained from homes of 1355 children (32% African American) in the Birmingham area. Fruit and vegetable costs were obtained from the US Department of Agriculture. We used discrete choice analysis with the dependent variable represented as presence or absence of the fruit or vegetable item. Explanatory variables included fruit and vegetable price per serving; child’s gender, race, and age; and parent’s body mass index and income.
Results. Higher cost was inversely related to fruit and vegetable availability. Higher income, African American race, and female gender were positively related to availability. Cost per serving was stratified into 3 categories—low, medium, and high. Relative to low-cost items, only high-cost items decreased the odds of availability significantly.
Conclusions. Fruit and vegetable cost does impact availability and has the greatest impact for high-cost items. Although cost was inversely related to availability, African Americans reported higher fruit and vegetable availability than Whites. Additional studies are needed to determine whether food items of lower nutritive value and comparable cost impact availability.
Over the past 40 years, the national prevalence of obesity (body mass index [BMI] ≥ 30 kg/m2) has risen from 13% to 31%, and the prevalence of overweight (25≤ BMI < 30 kg/m2) has grown from 31% to 34%.1 Potential explanations for the increasing prevalence of obesity include, but are not limited to, increased intake of energy-dense foods and sugar-containing beverages, lower levels of physical activity, declining levels of strenuous activity at work, and the proximity of fast-food restaurants.2,3 The combination of increased access to low-cost convenience foods and decreased disposable income for food may lead to preferential displacement of fruits and vegetables. This is unfortunate, as increased consumption of fruits and vegetables, coupled with a reduced-calorie dietary intake, may reduce obesity4,5 as well as protect against other health conditions such as cancer, diabetes, and hypertension.6–8
Increasing fruit and vegetable consumption may be difficult, because consumer food choice is closely linked with food cost.9 Retail price increases between 1982 and 1997 were lower for sugar and sweets (52%) and fats and oils (47%) compared with that for fruits and vegetables (93%).10 As such, food items purchased from retailers in high-income communities are less energy dense than in lower-income communities (i.e., more fruits and vegetables and fewer high-fat foods purchased).11 This type of evidence is consistent with (but does not prove) the notion that the costs of healthy items, specifically fruits and vegetables, are a limiting factor in consumption and lead to preferential purchasing of lower-cost, more-energy-dense food items with less nutritive value.12
Research by Zenk et al. has recently focused on the relationship between fruit and vegetable consumption and retail food store location and characteristics.13 Their analysis found no direct association between per capita income and fruit and vegetable consumption and between fruit and vegetable affordability and consumption for a sample of predominantly African American consumers in the Detroit metropolitan area. However, they used a self-reported ordinal ranking of “food affordability,” which may not be truly representative of actual food cost per serving or relative prices of fruits and vegetables.
As more discussion regarding the impact of fruit and vegetable costs has developed, lowering the cost of these items has become an intervention target of interest in combating obesity. Therefore, it may be important for investigators, public health practitioners, and policymakers to understand the true effect of fruit and vegetable pricing on consumption and, ultimately, body weight. Several studies have examined the relationship between weekly household expenditure on certain food groups including fruits and vegetables using economic theories of consumer behavior as applied by the linear expenditure system model.14–16 To date, we are unaware of any studies that demonstrate that lowering the cost per serving of fruits and vegetables leads to increased availability in the home. Defining this relationship and other significant moderating factors would be a first step in making the link between fruit and vegetable costs and obesity. Moreover, understanding how the costs of fruits and vegetables impact special populations that suffer from disproportionate rates of obesity, including low-income and African American populations, would be valuable.
In this study, we linked baseline food availability data from participants of the Hi5+ intervention in Birmingham, Ala,17,18 to national price indices to assess the relationship between the costs of the items and the self-reported in-home availability.
METHODS
Population
The Hi5+ intervention was a school-based intervention in the Birmingham, Ala, metropolitan area.17,18 The project was designed to identify the role and influences of the family on eating habits and subsequently intervene on these habits to increase fruit and vegetable intake. Thirty-three elementary schools in 3 districts participated in the Hi5+ intervention, providing a biracial, broad socioeconomic sample of 4th-grade students. The Hi5+ intervention sample was reflective of the racial/ethnic composition and income distribution of the Birmingham metropolitan statistical area.15 Families were randomly assigned to an enhanced family intervention group or a control group. Outcomes were assessed at baseline and after 1 and 2 years follow-up. Primary outcomes of the intervention have been previously published.17,18 Data from the baseline assessment were used for this analysis.
Fruit and Vegetable Availability
Fruit and vegetable availability was ascertained from parents of 4th graders participating in Hi5+ (n=1355). Availability of 3 100% fruit juice items, 13 fruits, and 18 vegetables was determined through a questionnaire that asked whether any of the items were in the home in any form (fresh, frozen, canned, or dried) in the previous 2 weeks (coded as yes or no responses). This instrument has been used in several assessments of fruit and vegetable availability19,20 and was completed by the parent or legal guardian who was the primary household shopper. For this analysis we excluded 3 items—other 100% fruit juice, fruit cocktail, and other beans—because they were either nonspecific and could not be identified or because a price per serving was not available for the item (fruit cocktail).
Independent Predictors Assessment
Measures, including the fruit and vegetable availability survey, were obtained from students and parents during the spring of the baseline school year and randomly ordered among the participating schools. Measured height and weight were obtained for children, and self-reported height and weight were obtained from parents. BMI was calculated by dividing weight in kilograms by height in meters squared. Parents provided information on household income and completed the fruit and vegetable availability questionnaire.
Cost Estimates
Cost per serving of the juice, fruit, and vegetable items in the survey was obtained from the US Department of Agriculture, Agricultural Research Service.21 Reed et al. used 1999 AC Neilsen Homescan data from 7195 households across the United States to determine the average cost per serving of 57 fruit and vegetable items in various varieties and forms. The average cost per serving not only represents the most common varieties and forms of the fruit and vegetable items, but it also represents a variety of food outlets from which these items may have been purchased. Food outlet variety may be a function of neighborhood, and prices have been shown to significantly differ by the type of outlet (e.g., chain supermarket vs deli and bodega).
Statistical Analysis
Descriptive data are presented as mean ±standard deviation (SD). All comparisons for apparently normally distributed, continuous variables were conducted with the Student t test. Proportions of African Americans and Whites reporting fruit and vegetable availability for each item were compared using χ2 analysis of independence in 2 × 2 contingency tables. Differences in mean number of items present in the home were compared by race using the Student t test.
To determine the effect of cost per serving on fruit and vegetable availability, we created multivariate discrete choice models using the generalized estimating equation method implemented in PROC GENOMD in SAS version 9.0 (SAS Institute Inc, Cary, NC) using the logit-link function. The dependent variable was availability of the fruit or vegetable in the home (yes or no) and the independent predictors included race (0=White, 1=African American), income (assessed as an ordinal variable as 1=<$10000, 2=$10000–$19999, 3=$20000–$29999, 4=$30000–$39999, 5=$40000–$49999, 6=$50000–$59999, 7=$60000–$69999, 8=≥ $70,000), child’s BMI (continuous variable), parent’s BMI (continuous variable), gender (0=male, 1=female), and item cost (US Department of Agriculture survey). Confounding of the predictors with cost was assessed by examining the P value of that covariate as well as the incremental change at each 10% increase in the cost variable. Missing income values (20%) were imputed using median income for the child’s school. The model adjusted for clustering within the respondent’s home (for those having more than 1 fruit or vegetable item present) by using the repeated statement method. The multivariate model included those predictors from the univariate models that were significant at P <.05.
RESULTS
The sample of participants represented an equal distribution of boys and girls, whose parents had a wide range of income (Table 1 ▶). A number of the children were at risk for overweight (BMI in the 85th–95th percentile for children of the same age group) or were overweight (BMI greater than the 95th percentile). There were no differences by race for the percentages of children that were in either category. More than 50% of the parents were considered either overweight or obese. African American parents had nearly double the prevalence of obesity compared with White parents (35% vs 18%, respectively; P < .0001).
TABLE 1—
Demographic and Clinical Characteristics of Study Sample: Hi5+ Intervention, Birmingham, Ala, 2001–2004
| No. (%) | |
| Age of child, y | |
| 8 | 516 (38.1) |
| 9 | 783 (57.8) |
| 10 | 10 (4.1) |
| Gender of child | |
| Boy | 679 (50.1) |
| Girl | 676 (49.9) |
| Race of child | |
| African American | 431 (31.8) |
| White | 924 (68.2) |
| Child’s weight status | |
| At risk for overweight | 122 (9) |
| Overweight | 149 (11) |
| Parent’s income | |
| < $10 000 | 81 (6) |
| $10 000–$19 999 | 115 (8.5) |
| $20 000–$29 999 | 131 (9.7) |
| $30 000–$39 999 | 125 (9.2) |
| $40 000–$49 999 | 136 (10) |
| $50 000–$59 999 | 126 (9.3) |
| $60 000–$69 999 | 106 (7.8) |
| ≥ $70 000 | 275 (20.3) |
| No answer given | 260 (19.2) |
| Parental BMI categories | |
| < 25 kg/m2 | 623 (46) |
| 25–29.9 kg/m2 | 420 (31) |
| ≥ 30 kg/m2 | 312 (23) |
Note. BMI = body mass index.
On average, parents reported having approximately 17 juice, fruit, or vegetable items available in the previous 2 weeks (Table 2 ▶). There was no statistical difference between racial groups in total availability of these items in the home (P = .16). Figure 1 ▶ shows that most homes had potatoes (other than french fries or tater tots), green beans, lettuce, corn, and orange juice available, and relatively few homes reported having items such as grapefruit, pears, and squash. As depicted in Figure 1 ▶, there was an inverse relationship between the proportion of homes reporting a particular item as being available and the cost per serving.
TABLE 2—
Frequency of Availability of Juices, Fruits, and Vegetables in Homes of School-Aged Children, by Race: Hi5+ Intervention, Birmingham, Ala, 2001–2004
| White, Mean ±SD | African American, Mean ±SD | Total, Mean ±SD | |
| Juice | 1.8 ±0.9 | 1.9 ±0.9 | 1.8 ±0.9 |
| Fruit | 5.8 ±2.4 | 5.7 ±2.6 | 5.8 ±2.5 |
| Vegetables | 10.0 ±3.1 | 10.5 ±3.7 | 10.1 ±3.3 |
| Total | 17.6 ±5.1 | 18.1 ±6.1 | 17.7 ±5.5 |
FIGURE 1—
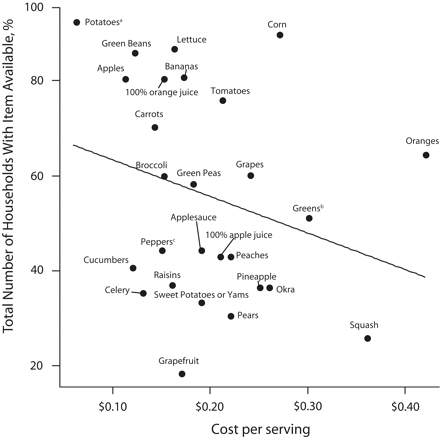
Unadjusted correlation between fruit and vegetable availability and cost per serving: Hi5+ intervention, Birmingham, Ala, 2001–2004
Note. Cost per serving of items obtained from US Department of Agriculture, Agricultural Research Service.21
aOther than French fries or tater tots.
bSpinach, collards, turnips, and so on.
cBell pepper or green pepper.
Figure 2 ▶ displays some of the differences in fruit and vegetable availability by race. Higher proportions of Whites reported having items such as carrots, applesauce, bananas, and raisins. By contrast, higher proportions of African Americans reported having items such as greens (including collards, turnip greens, spinach, and so on), sweet potatoes, and okra. All of these differences in proportions were statistically significant. It should be noted that several of the items reported in higher proportions by African Americans (e.g., greens, okra) cost more than the median cost per serving of $0.18.
FIGURE 2—
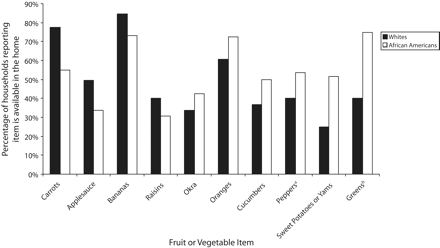
Proportions of Whites and African Americans reporting fruit and vegetable items available: Hi5+ intervention, Birmingham, Ala, 2001–2004
aBell pepper or green pepper.
bSpinach, collards, turnips, and so on.
The results of multivariate modeling of cost per serving of the items and their availabilities are shown in Table 3 ▶. Increasing the cost per serving of an item significantly decreased the odds of having the item available in the home by 23% (P < .001) for each $0.10-unit increase in cost. A higher income, African American race, and having a female child significantly increased the probability of having a fruit or vegetable item available at home. The BMI of the child or parent were not significant predictors of fruit and vegetable availability in the home. We also found a significant interaction between race and cost (P < .001). Although cost negatively impacted fruit or vegetable choice in both races, African Americans were less affected by increased cost compared with Whites. We controlled for income and gender and found that for each unit increase in cost (in units of $0.10) the odds ratio for having that fruit or vegetable in the home was 0.72 (95% CI, 0.7, 0.75) for Whites compared with 0.89 (95% CI, 0.82, 0.96) for African Americans.
TABLE 3—
Multivariate Predictors of Availability of Fruits and Vegetables in the Homes of School-Aged Children: Hi5+ Intervention, Birmingham, Ala, 2001–2004
| OR (95% CI) | ||
| Factor | Model 1 | Model 2 |
| Cost of item per serving (in $0.10 units) | 0.77 (0.75, 0.79) | . . .a |
| Cost of item per serving | ||
| Low cost (< $0.20 per serving) | . . .a | 1.0 |
| Medium cost ($0.20–$0.29 per serving) | . . .a | 0.99 (0.94, 1.03) |
| High cost (≥ $0.30 per serving) | . . .a | 0.67 (0.63, 0.71) |
| Race of child | ||
| White | 1.0 | 1.0 |
| African American | 1.12 (1.02, 1.23) | 1.12 (1.02, 1.23) |
| Gender of child | ||
| Boy | 1.0 | 1.0 |
| Girl | 1.08 (1.01, 1.17) | 1.08 (1.01, 1.17) |
| Household income (scored 1–8)b | 1.03 (1.01, 1.05) | 1.03 (1.01, 1.05) |
Note. CI = confidence interval; OR = odds ratio. Results are from a linear model utilizing the binomial link function. Model 1 included race, gender, income, and cost per serving in continuous units. Model 2 included race, gender, income, and cost per serving in categorical units.
a Indicates factor not used in model.
b As defined in the “Statistical Analysis” section.
Review of the simple correlation suggests that 2 items (squash and oranges) in the higher cost range may be primarily driving the inverse relationship between cost and fruit and vegetable availability. For this reason, we conducted a sensitivity analysis, removing oranges and squash from the multivariate model. With these items removed, the odds of having the remaining fruit and vegetable items available decreased by 30% (P<.001) as cost increased, with similar estimates for the previous predictors (data not shown).
To determine whether the relationship between cost per serving and fruit and vegetable availability was consistent at all levels of cost, we categorized fruit and vegetable items by price into low- (<$0.20 per serving), medium-($0.20–$0.29 per serving), or high- (≥ $0.30 per serving) price categories. Categories were based on approximate tertiles of cost and rounded to reflect market pricing schemes. When we replaced the continuous cost per serving variable with these categorical variables in the same model, we found that cost per serving was still a significant predictor of fruit and vegetable availability in the home, but only for the high price category (≥ $0.30 per serving; Table 3 ▶). Relative to the lowest priced items, when a fruit or vegetable item cost $0.30 or more per serving, the odds of having that item available in the home decreased by one third (P<.001). As in the first model, higher income, African American race, and having a female child had similar effects on fruit and vegetable availability in the home.
DISCUSSION
The results of this study demonstrate that in a sample of African American and White families from a broad socioeconomic spectrum, fruit and vegetable availability in the home decreased as the cost per serving increased. Although most homes had the low- to moderate-cost ($0.29 per serving) items available, relatively few homes had higher-cost (≥ $0.30 per serving) items available. The significant inverse relationship between in-home availability and cost per serving is consistent with the hypothesis of Drewnowski et al.12 that the cost of fruits and vegetables is a barrier to at-home availability and, ultimately, consumption.
However, in this study, cost per serving primarily influenced at-home availability for the most expensive fruits and vegetables. For instance, squash was $0.36 per serving and was available in only 26% of the homes. Therefore, public health policies that lower the cost of fruits and vegetables currently priced less than $0.30 per serving may have little effect. More appropriate intervention targets may be fruit and vegetable items that have the highest cost per serving in a given market. On the other hand, if families do not purchase the more expensive fruits and vegetables because of taste preferences or other factors unrelated to cost, lowering the cost of these items may have little impact on availability in the home or consumption.
In this study, we did not seek to determine the consumer’s motivation for purchasing the fruit or vegetable items. We believe that it will be necessary to understand consumer motivation for purchasing fruits and vegetables if interventions will be developed with the goal of making fruits and vegetables more attractive by cost manipulation alone. These results do support future testing of interventions that aim to make lower-priced fruits and vegetables more available in a variety of stores and in low-income and minority neighborhoods. Because there is a general lack of low-cost fruits and vegetables in some of these locales,22,23 it is our speculation that interventions with this approach may be more effective.
A higher income increased the odds of having an item in the home, but only modestly. This modest effect suggests that the impact of income on obesity may be mediated through other avenues aside from limiting availability of fruits and vegetables in the home. That is, as the category of income increased, the odds of reporting an item available at home increased by just 3%, indicating that those with higher incomes were not necessarily using the additional income to purchase a wider variety of fruits and vegetables largely different from those in lower income brackets. Those with higher incomes may, however, have larger quantities of fruits and vegetables in the home, but this was not ascertained in our survey. It is also possible that these individuals purchased items other than fruits and vegetables that were low in energy density and of higher nutritive quality.
Although the cost of fruits and vegetables reduced at-home availability, the impact of cost on fruit and vegetable availability in African American homes was less than that on availability in White homes. Compared with Whites, a significantly larger proportion of African Americans reported higher availability of items such as greens, sweet potatoes, okra, and other foods that are consistent with traditional African American dietary patterns. However, the cost per serving for greens and okra was higher than the median cost per serving for the group of food items surveyed. This implies that African Americans may purchase some fruit and vegetable items based on preference, cultural significance, family traditions, and taste, overriding potential cost concerns. Other studies have also suggested that fruit and vegetable availability in African American homes may be less influenced by economic factors. For example, Edmonds et al.24 demonstrated that median income was inversely associated with at-home fruit (r=−0.63; P=.05) and vegetable availability (r=−0.67; P<.05).
Even though being African American increased the odds of having several items available in the home, there was still a higher proportion (35% vs 18%) of obese African American adults compared with Whites. This suggests that lowering the cost and increasing the availability of fruits and vegetables (in isolation) may have little impact on obesity for African Americans. To better understand how at-home availability of fruits and vegetables impacts obesity in African Americans, investigators need more information regarding food preparation styles, consumption patterns of fruits and vegetables, and the role of fruits and vegetables in displacing high-energy-dense foods in African American populations. Although fruits and vegetables are low-energy-dense foods, preparation techniques common in African American households, such as deep-fat frying, adding high-fat meats for seasoning, and adding sugar, can result in significant changes in the energy density of the final food product. In addition, fruit and vegetable items may not displace consumption of fried foods or sugar-containing beverages. It is also important to consider the role of physical activity, as fruit and vegetable intake may not be associated with a physically active lifestyle in African Americans.
Limitations
This study may be limited because cost per serving may not be the best measure of cost—most foods are priced per pound or per ounce. However, cost per serving provides a reasonable way to compare different items that may weigh the same but have different yields of edible portions. In addition, cost per serving does not capture other cost factors such as perceived cost and indirect cost associated with food procurement, preparation, and storage (e.g., transportation costs, use of coupons and discounts, buying in bulk). These cost factors may have significant effects on fruit and vegetable availability, but are not measured in this study as potential confounders. The use of a national data source to estimate cost decreases the variability in cost that may be seen at the regional level. Because of the decreased variability, our results may actually underestimate the differences in price sensitivity by race, particularly if African Americans systematically shop at higher-priced, smaller stores that have less fruit and vegetable variety compared with the stores where Whites shop.
Also, we cannot make any real assertions regarding consumption. Even though the food was reported as available in the home, this does not mean that the child or parent in our sample was the one who actually consumed the food item. However, at-home availability is the first step to consumption. Finally, we cannot estimate the extent to which personal preferences override usual cost concerns when one purchases fruit and vegetable items. As mentioned previously, preferences may have particular implications for interventions and specific ethnic groups.
Conclusions
This study demonstrates that as the cost of fruits and vegetables increases, the availability of fruits and vegetables in the home decreases. This is most evident for fruit and vegetable items in the highest cost range. Despite this fact, African Americans were more likely than Whites to have fruit and vegetable items available. Cost may be a significant barrier to fruit and vegetable consumption, but the link between cost and consumption of fruits and vegetables remains to be established. There may be other factors such as taste, preference, and culture that may have a more significant impact on fruit and vegetable purchase and consumption. Across-the-board price reductions of fruits and vegetables may have less effect than anticipated.
Future studies should address consumers’ motivations and barriers to purchasing fruits and vegetables. For instance, despite the actual cost of fruits and vegetables as a barrier, there are other perceived costs such as shopping time (driving to and from the store and picking out the item) as well as preparing the food item (cleaning, cutting, boiling, etc.) that may be perceived as equally important barriers. Furthermore, researchers should examine the impact of preparation styles for low-energy-dense foods, which may be influenced by cultural traditions, as well as create interventions that provide education on preparing and purchasing fruits and vegetables.
Acknowledgments
This study was supported by J. P. Morgan & Co., the Robert Wood Johnson Foundation (grant 51894), and the Clinical Nutrition Research Center, University of Alabama, Birmingham (gran DK056336).
Peer Reviewed
Contributors J. D. Ard assisted in study design, led the preparation of the article, and assisted with design of the statistical analysis plan. S. Fitzpatrick assisted with data management and statistical analysis. R. A. Desmond completed the statistical analysis. B. S. Sutton and M. Pisu assisted with economic data interpretation. D. B. Allison assisted with study design and design of the statistical analysis plan. F. Franklin provided study data and assisted with study design and article preparation. M. L. Baskin led the scientific team and assisted with study design. All authors helped to conceptualize ideas, interpret findings, and review drafts of the article.
Human Participant Protection This study was approved by the University of Alabama at Birmingham institutional review board.
References
- 1.Baskin ML, Ard J, Franklin F, Allison DB. Prevalence of obesity in the United States. Obes Rev. 2005;6:5–7. [DOI] [PubMed] [Google Scholar]
- 2.Chou SY, Grossman M, Saffer H. An economic analysis of adult obesity: results from the Behavioral Risk Factor Surveillance System. J Health Econ. 2004; 23:565–587. [DOI] [PubMed] [Google Scholar]
- 3.Cutler D, Glaeser E, Shapiro J. Why Have Americans Become More Obese? Cambridge, Mass: National Bureau of Economic Research Inc; 2003. NBER working paper 9446.
- 4.McCrory MA, Fuss PJ, McCallum JE, et al. Dietary variety within food groups: association with energy intake and body fatness in men and women. Am J Clin Nutr. 1999;69:440–447. [DOI] [PubMed] [Google Scholar]
- 5.Rolls BJ, Ello-Martin JA, Tohill BC. What can intervention studies tell us about the relationship between fruit and vegetable consumption and weight management? Nutr Rev. 2004;62:1–17. [DOI] [PubMed] [Google Scholar]
- 6.Steinmetz KA, Potter JD. Vegetables, fruit, and cancer prevention: a review. J Am Diet Assoc. 1996;96: 1027–1039. [DOI] [PubMed] [Google Scholar]
- 7.Ard JD, Grambow SC, Liu D, Slentz CA, Kraus WE, Svetkey LP. The effect of the PREMIER interventions on insulin sensitivity. Diabetes Care. 2004;27:340–347. [DOI] [PubMed] [Google Scholar]
- 8.Svetkey LP, Simons-Morton D, Vollmer WM, et al. Effects of dietary patterns on blood pressure: subgroup analysis of the Dietary Approaches to Stop Hypertension (DASH) randomized clinical trial. Arch Intern Med. 1999;159:285–293. [DOI] [PubMed] [Google Scholar]
- 9.Glanz K, Basil M, Maibach E, Goldberg J, Snyder D. Why Americans eat what they do: taste, nutrition, cost, convenience, and weight control concerns as influences on food consumption. J Am Diet Assoc. 1998;98: 1118–1126. [DOI] [PubMed] [Google Scholar]
- 10.Putnam J, Allshouse J. Food Consumption, Prices, and Expenditures, 1970–97. Washington, DC: Food and Rural and Economic Division, Economic Research Services; 1999. USDA Statistical Bulletin 965.
- 11.French SA. Pricing effects on food choices. J Nutr. 2003;133:841S–843S. [DOI] [PubMed] [Google Scholar]
- 12.Drewnowski A, Specter S. Poverty and obesity: the role of energy density and energy costs. Am J Clin Nutr. 2004;79:6–16. [DOI] [PubMed] [Google Scholar]
- 13.Zenk SN, Schulz AJ, Hollis-Neely T, et al. Fruit and vegetable intake in African Americans income and store characteristics. Am J Prev Med. 2005;29:1–9. [DOI] [PubMed] [Google Scholar]
- 14.Park JL, Capps O Jr. Demand for prepared meals by US households. Am J Agricultural Econ. 1997;79: 814–824. [Google Scholar]
- 15.Park JL, Holcomb RB, Raper KC, Capps O Jr. A demand systems analysis of food commodities by US households segmented by income. Am J Agricultural Econ. 1996;78:290–300. [Google Scholar]
- 16.Raper KC, Wanzala MN, Nayga RM Jr. Food expenditures and household demographic composition in the US: a demand systems approach. Appl Econ. 2002; 34:981–992. [Google Scholar]
- 17.Davies SL, Harrington K, Franklin FA, Shewchuk RM, Feese ML, Windle M. Hi5+: systematic development of a family intervention to increase fruit and vegetable intake. Health Promot Pract. 2005;6:190–201. [DOI] [PubMed] [Google Scholar]
- 18.Harrington KF, Franklin FA, Davies SL, Shewchuk RM, Binns MB. Implementation of a family intervention to increase fruit and vegetable intake: the Hi5+ experience. Health Promot Pract. 2005;6:180–189. [DOI] [PubMed] [Google Scholar]
- 19.Marsh T, Cullen KW, Baranowski T. Validation of a fruit, juice, and vegetable availability questionnaire. J Nutr Educ Behav. 2003;35:93–97. [DOI] [PubMed] [Google Scholar]
- 20.Cullen KW, Baranowski T, Owens E, Marsh T, Rittenberry L, de Moor C. Availability, accessibility, and preferences for fruit, 100% fruit juice, and vegetables influence children’s dietary behavior. Health Educ Behav. 2003;30:615–626. [DOI] [PubMed] [Google Scholar]
- 21.Reed J. How Much Do Americans Pay for Fruits and Vegetables? Washington, DC: US Dept of Agriculture, Economic Research Service; 2004.
- 22.Morland K, Wing S, Diez Roux A, Poole C. Neighborhood characteristics associated with the location of food stores and food service places. Am J Prev Med. 2002;22:23–29. [DOI] [PubMed] [Google Scholar]
- 23.Horowitz CR, Colson KA, Hebert PL, Lancaster K. Barriers to buying healthy foods for people with diabetes: evidence of environmental disparities. Am J Public Health. 2004;94:1549–1554. [DOI] [PMC free article] [PubMed] [Google Scholar]
- 24.Edmonds J, Baranowski T, Baranowski J, Cullen KW, Myres D. Ecological and socioeconomic correlates of fruit, juice, and vegetable consumption among African-American boys. Prev Med. 2001;32:476–481. [DOI] [PubMed] [Google Scholar]