

Abstract
Intestinal intraepithelial lymphocytes (IELs), T-cell receptor αβ+ CD8+ T cells located between epithelial cells, are thought to contribute to Fas ligand (FL)-mediated epithelial cell death in coeliac disease, a condition characterized by excess interleukin-15 (IL-15). This study evaluates the effects of prolonged IL-15 stimulation on IELs. Human IELs were obtained from jejunal mucosa from gastric bypass operations for morbid obesity and cultured for 3 or 10 days with IL-15. As the culture progressed, an increasing number of IELs became CD94+ and produced massive quantities of interferon-γ (IFN-γ) and IL-10. There was a steady rate of transcription with no feedback regulation. Few chronically activated IELs produced IL-2, IL-4, or tumour necrosis factor-α (TNF-α). To determine whether the accumulation of IL-10 affected IEL functions, endogenous IL-10 was neutralized by antibody during culture with IL-15. This manipulation reduced expression of CD94, NKG2D, and FL as well as FL-mediated killing of Jurkat cells by IELs. It did not affect perforin or TNF-α expression or the associated cytotoxic activities. This study shows that IL-15 induces the development of CD94+ IELs containing IFN-γ and IL-10, and that endogenous IL-10 promotes FL-mediated cytotoxicity.
Keywords: intraepithelial lymphocytes, IL-15, IL-10, IFN-γ, Fas ligand, cytotoxicity
Introduction
Human intestinal intraepithelial lymphocytes (IELs) are T-cell receptor (TCR) αβ+ CD8+ T cells located between epithelial cells (ECs). Their function may be the recognition and destruction of abnormal ECs. Intestinal ECs produce interleukin-15 (IL-15), especially when compromised by infection1,2. Presentation of this cytokine on the basolateral surfaces of ECs is likely to promote survival of IELs.3–6 With greater IL-15 secretion during infection or inflammation, the IELs may become activated and develop cytotoxic activity. IL-15 prolongs the CD8+ T-cell mediated immune response7. Antigen-specific cytotoxic IELs, mainly CD8+ TCRαβ+, are critical to elimination of infectious agents in the epithelium as they can confer protection when adoptively transferred to a naïve mouse8. This protective response requires interferon-γ (IFN-γ) as it is abrogated by antibody neutralizing this cytokine. IFN-γ inhibits the invasion and replication of pathogens in the ECs and activates bacteriocidal killing.9–11 Unbrieability and activation of antigen-presenting cells (APCs).12 It also intensifies major histocompatibility complex (MHC) class II expression on enterocytes that in turn stimulates IFN-γ production by IELs.13 Cytokines such as transforming growth factor-β (TGF-β) or IL-10 may be necessary to down-regulate the immune response.14,15
The present study shows that IL-10 is one down-regulatory cytokine produced in large quantities by IL-15-activated IELs. This cytokine can reverse IFN-γ-induced alterations in enterocyte viability, growth, MHC class II expression, and permeability.16 Its effects on IELs depend on the stimulus. IL-10 reduces TCR-triggered T-cell functions but increases IL-2- or IL-15-induced CD8+ T cell and natural killer (NK) cell functions.17–21 The ability of IL-10 to enhance the immune response accounts for its antitumour properties.
IELs have been implicated in the pathogenesis of coeliac sprue.22–25 The numbers of IELs increase particularly in untreated patients or in response to a gluten challenge. Such IELs strongly express Fas ligand (FL) and CD94, a C-lectin-like natural killer receptor found on a portion of the TCRαβ+ CD8+ subset.23 They produce IFN-γ and, with prolonged stimulation, IL-10.26 The massive overexpression of IL-15 in active coeliac disease3 may induce these changes in IELs as well as Fas-mediated apoptosis of ECs.27 In a murine model, overexpression of IL-15 causes inflammation localized to the proximal small bowel with enterocyte apoptosis and shortening of villi, similar to sprue.28 Unlike coeliac disease, the IEL numbers in this model were not increased. However, murine IELs have some characteristics that differ from human IELs, such as their greater numbers of TCRγδ cells and lack of effector responses to IL-15.4,5
IELs, which are poorly responsive to TCR triggering29 may be modulated by the cytokine milieu. IL-15 induces their proliferation, cytotoxic activities, and production of IFN-γ, independent of TCR ligation.6 It is unknown how IELs respond to chronic IL-15 stimulation. Using an in vitro model, this study finds that a 10-day culture with IL-15 converts IELs to CD94+ producers of IL-10 and IFN-γ with strong FL-mediated cytotoxic activity.
Methods
Isolation and culture of IELs
IELs were separated from jejunal mucosa obtained from patients undergoing gastric bypass operations for morbid obesity after informed consent. Minced mucosa was treated in a shaking water bath (37°) for 30 min with 1 mm dithiothreitol in complete medium (RPMI-1640 containing 10% fetal calf serum, glutamine and antibiotic–antimycotic solution). The mucosa was then exposed to 0·75 mm ethylenediaminetetra acetic acid (Sigma Chemicals, St Louis, MO), washed every 45 min with Hank's balanced salt solution (Biowhittaker, Walkersville, MD), for three cycles. The cell pellet was resuspended in 40% Percoll solution and layered over 60% Percoll (Pharmacia, Piscataway, NJ). After centrifuging at 500 g for 20 min, the cells between the two layers were collected.
IELs (2 × 10⁶/ml) were cultured for various intervals up to 10 days in complete medium supplemented with combinations of IL-2, IL-10, IL-15, IFN-γ (each at 10 ng/ml) or antibodies (10 µg/ml) neutralizing IL-2, IL-4, IL-10, tumour necrosis factor-α (TNF-α), transforming growth factor-β (TGF-β), or IFN-γ (compared to isotype-matched immunoglobulin G (IgG) controls; R & D Systems, Minneapolis, MN). Medium and additives were renewed on day 7 of a 10-day culture. After a 3- or 10-day incubation in complete medium at 37°, viability was over 90% and 85%, respectively, regardless of the stimulus.
Immunofluorescence
Cells were stimulated with IL-15 for 3 or 10 days, then pulsed for 6 hr with phytohaemagglutinin (PHA, 1 µg/ml), phorbol 12-myriatate 13-acetate (PMA, 50 ng/ml), and brefeldin A (5 µg/ml; Sigma). Surface markers were labelled by direct immunofluorescence using monoclonal antibodies (mAbs) against CD2, CD4, CD8, CD16, CD56, CD94, or 1L-12Rβ1 conjugated to fluorescein isothiocyanate (FITC) or phycoerythrin (PE; R & D Systems). Intracytoplasmic markers were identified by first permeabilizing the cells (Cytofix/Cytoperm, PharMingen, San Diego, CA), then staining directly with FITC- or PE-labelled mAbs recognizing IL-2, IL-4, IL-10, TNF-α, or IFN-γ (R & D Systems). Preliminary experiments showed minimal surface staining for these cytokines, indicating that all signals were from intracellular sources. Apoptotic cells were identified by staining for surface annexin while excluding propidium iodide (PI; Immunotech, Marseille, France).
Fluorescence was detected by an Epics II flow cytometer (Coulter, Hialeah, FL). Colour compensation was adjusted so that there were the same percentages of positive cells for marker A, whether counterstained with IgG or antibody against marker B conjugated with a different colour. In order to determine the percentages of positive cells, statistical quadrants were set so as to score as negative over 98% of the cells stained with IgG–PE and IgG–FITC. For markers present on most cells, a relative fluorescence intensity (RFI) or the fold-increase in intensity of staining compared to an IgG–FITC or –PE control was calculated.
Functional assays
Soluble IL-10 or IFN-γ concentrations were measured by quantitative assays using an enzyme-linked immunosorbent assay (ELISA)-based format (R & D Systems). The numbers of transcripts were determined using an ELISA-based assay (R & D Systems). In all cases, the numbers of viable cells were adjusted after culture to 2 × 10⁵ per test.
In some experiments, serine esterase release was detected using the N-α-benzyloxycarbonyl-l-lysine thiobenzyl ester (BLT; Calbiochem, San Diego, CA) assay. In brief, IELs were cultured for 4 h with immobilized anti-CD3 antibody with medium lacking phenol red and the supernatants collected. To each sample was added 0·2 mm 5,5′-dithio-bis-(2-nitrobenzoic acid; Sigma) and 0·2 mm BLT in phosphate-buffered saline (PBS). During the 45-min incubation in the dark, granzymes in each sample cleave BLT, causing a yellow colour that can then be quantitated by absorbance measurements at 410 nm after subtraction of background.
For cytotoxicity assays, IELs were cultured for 3 or 10 days with combinations of IL-2, IL-10, IL-12, IL-15, and antibody neutralizing IL-10. Using a range of effector-to-target cell ratios, IELs were exposed for 4 hr to 51Cr-labelled HT-29, Jurkat, P815, or WEHI target cells as described previously.6 Specific release of radiolabel was determined. For redirected lysis using P815 cells, anti-CD3 (50 pg/ml, R & D Systems) was added to the assay.
Statistics
Statistical analysis was performed using the Mann–Whitney test or paired Student's t-test depending on the distribution of the data. In all graphs, *** indicates P < 0·001; ** indicates P < 0·01, and * indicates P < 0·05. The error bars denote standard deviation.
Results
Cytokine profile, day 3 and day 10
Unlike naïve T cells, IELs produced cytokines and developed cytotoxic activity with IL-2 or IL-15 in the absence of TCR triggering.6 IL-15 is likely to be more important in vivo because it is produced by ECs and presented at their basolateral surfaces.3 Before stimulation, the IELs consisted of 97 ± 2% CD2+, 10 ± 4% CD4+, 85 ± 6% CD8+, 5 ± 3% CD56+, 28 ± 5% CD94+ cells with less than 10% cytokeratin+ epithelial cells, rare CD14+, and no CD20+ or CD68+ cells (Fig. 1). By day 3 in IL-15, there were 5 ± 2% CD4+, 90 ± 3% CD8+, 3 ± 3% CD56+, and 45 ± 5% CD94+ cells with no cytokeratin+, CD14+, CD20+, or CD68+ cells.
Figure 1.
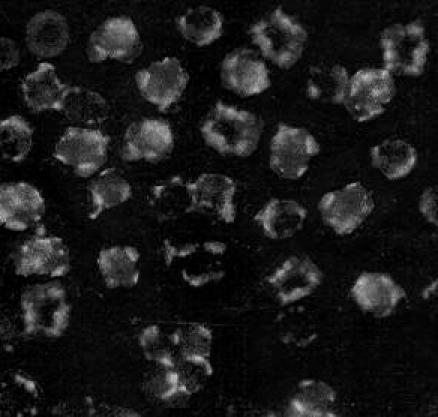
Immunofluorescence analysis of IELs. IELs were stained indirectly with anti-CD2 antibody followed by goat anti-mouse IgG conjugated to FITC. Most (>97%) cells were positive. Note the red blood cell in the left upper corner for comparison.
To assess the cytokine profile occurring with short-term stimulation, IELs were cultured for 3 days with IL-15, then pulsed with PHA, PMA, and brefeldin for 6 hr before staining for intracytoplasmic cytokines (Fig. 2). Large fractions of IELs strongly expressed IFN-γ, TNF-α, or both, with a discrete negative population. The density of expression was widely variable. In contrast, most cells developed low level IL-10 without a discrete negative population and with little variation in expression. IL-2 was found on occasional cells, while IL-4 was rarely detected (Table 1). When free cytokines were measured by ELISA in medium supporting cells for three days, IFN-γ and IL-10 concentrations were greater with IL-15 than with IL-2 (Fig. 3). Double staining for CD94 and either IFN-γ or IL-10 showed that both CD94+ and CD94− cells produced both cytokines. Less than 50 pg/ml of IL-2, IL-4, or TNF-α was retrieved in the medium with IL-2 or IL-15, even though TNF-α was one of the predominant cytokines by intracytoplasmic staining.
Figure 2.

Intracytoplasmic cytokines – day 3. IELs were cultured for 3 days with IL-15 and pulsed for 6 hr with PHA, PMA, and brefeldin A before staining for intracytoplasmic cytokines and surface CD94. Similar data was obtained without the PHA/PMA/brefeldin A pulse. Colour compensation was adjusted using conjugated isotype-matched IgG controls. The numbers indicate the percentage of events in each quadrant. This is a representative experiment out of four.
Table 1.
Expression of intracytoplasmic cytokines on days 3 and 10 with IL-2 or IL-15
| Day 3 with IL-2 | Day 10 with IL-2 | Day 3 with IL-15 | Day 10 with IL-15 | |||||
|---|---|---|---|---|---|---|---|---|
| % positive | RFI | % positive | RFI | % positive | RFI | % positive | RFI | |
| IFN-γ | 21 ± 4 | 4 ± 2 | – | 9 ± 4* | 21 ± 4 | 4 ± 2 | – | 9 ± 4* |
| IL-10 | – | 2 ± 1 | – | 5 ± 2* | – | 3 ± 1 | – | 6 ± 2* |
| TNF-α | 22 ± 4 | 4 ± 2 | 4 ± 4* | 2 ± 1 | 25 ± 5 | 4 ± 2 | 8 ± 4* | 2 ± 1 |
| IL-2 | 1 ± 2 | 2 ± 0 | 3 ± 2 | 2 ± 2 | 2 ± 1 | 2 ± 2 | 5 ± 7 | 2 ± 2 |
| IL-4 | 1 ± 1 | 2 ± 1 | 5 ± 6 | 2 ± 2 | 1 ± 1 | 2 ± 1 | 6 ± 8 | 3 ± 1 |
IELs were cultured for 3 or 10 days with IL-2 or IL-15. They were pulsed for 6 hr with a PHA/PMA/brefeldin cocktail. After permeabilization, they were stained for intracytoplasmic cytokines and analysed by flow cytometry (n = 6). The results are expressed as the percentage positive cells and RFI. The dashes indicate those markers whose expression was found on most IELs and where distinct positives and negatives could not be identified.
Values at 10 days that differed significantly from those obtained at 3 days.
Figure 3.

IFN-γ and IL-10 production: day 3 and day 10. IELs were cultured for 3 or 10 days with IL-2 or IL-15 (each at 10 ng/ml). IFN-γ and IL-10 content was quantitated in medium supporting cells from days 0–3 or days 7–10 (n = 8). The production of both cytokines increased from day 3 to day 10 using either stimulus. IL-15 was a more effective agent than IL-2. *P < 0·05; ***P < 0·001.
On day 10, surface and intracytoplasmic markers were again measured. At this point, 85 ± 6% of IELs were CD94+. The majority were TCRαβ+ and CD8+ (80 ± 5% and 77 ± 3%, respectively) with rare CD56+ cells (3 ± 3%). Intracytoplasmic staining showed a marked increase from day 3 to day 10 in staining for IFN-γ and IL-10 and a decline in TNF-α (Table 1). When cytokine concentrations were measured by ELISA in medium supporting cultures from days 0–3 and days 7–10, there was a massive 10-fold increase in IFN-γ and IL-10 concentrations with IL-15 (Fig. 3). IL-2, IL-4, or TNF-α were minimally secreted. These studies show that prolonged IL-15-stimulation promoted CD94+ IELs producing IFN-γ and IL-10.
To determine the relationship between IL-10- and IFN-γ-producers, IELs were double stained for IFN-γ and IL-10 on day 3 and day 10 (Fig. 4). Early on, most IL-10-containing cells also expressed IFN-γ. IFN-γ-expressing cells, however, were found in both 1L-10hi and IL-10low subsets. By day 10, the majority of IELs contained both IFN-γ and IL-10. The density of expression was greater for IFN-γ than for IL-10, agreeing with the increased accumulation of IFN-γ compared to IL-10 extracellularly (Fig. 3).
Figure 4.

IL-15 stimulation promotes IELs expressing both IL-10 and IFN-γ. IELs, cultured for 3 or 10 days with IL-15, were permeabilized and stained with PE-conjugated anti-IL-10 and FITC-conjugated anti-IFN-γ or isotype-matched IgG. The numbers indicate the percentage of events in each quadrant. This is a representative experiment of four.
IL-12, a known up-regulator of IFN-γ and IL-10 production30 was combined with either IL-2 or IL-15. The resulting production of IFN-γ and IL-10 measured by ELISA on day 3 rose eight- and sixfold, respectively; production of IFN-γ and IL-10 on day 10 rose five- and fourfold, respectively.
Lack of feedback inhibition or positive autocrine loops
When the numbers of transcripts for IFN-γ and IL-10 were assessed, they were similar to one another (averaging 65 ± 3 and 68 ± 4 amol/ml/2 × 105 cells, respectively) and remained constant from day 3 to day 10. Because the numbers of cytokine-synthesizing cells increased over time, this suggests a decline in the transcriptional rate per cell. The accumulation of more IFN-γ than IL-10 despite equal transcriptional rates suggests that other processes alter extracellular levels, such as uptake of IL-10. To evaluate whether the decline in transcriptional rate per cell was in response to the extracellular accumulation of cytokine, cultures were supplemented with IFN-γ (10 ng/ml) or its neutralizing antibody (10 µg/ml), and mRNA expression for this cytokine was measured (Fig. 5). No changes occurred, suggesting that feedback regulation was not prominent. Similarly, addition of IL-10 or its neutralizing antibody had no effect on IL-10 mRNA.
Figure 5.

Amounts of mRNA for IFN-γ and IL-10 with the addition of cytokines or neutralizing antibodies. IELs were cultured for 3 days with the cytokines, IFN-γ or IL-10, or antibodies (designated with ‘a’) neutralizing IFN-γ, IL-10, IL-2, IL-4, TGF-β, or TNF-α. The amount of mRNA was quantitated and expressed as a percentage of the amount present with irrelevant IgG (‘none’) (n = 10) for 2 × 10⁵ viable IELs per test.
The high quantities of IFN-γ and IL-10 could also be due to a positive autocrine loop through an intermediate cytokine. For example, endogenous IL-10 production with IL-15 stimulation may increase IL-2, which in turn would promote more IL-10 synthesis31. To evaluate this, antibodies neutralizing cytokines known to regulate IL-10 production – IL-2, IL-4, TNF-α, and TGF-β31–34 – were introduced at the start of IL-15-stimulated cultures. None of these altered the transcriptional rates of IFN-γ or IL-10 (Fig. 5). Nor did there appear to be any interaction between IFN-γ and IL-10 – that is, addition or neutralization of one did not affect the transcriptional rate of the other.
Effects of endogenous IL-10 on IL-15-induced phenotypic changes and cytotoxic activity
The rapid release of IL-10, occurring even after 18 hr with IL-15 stimulation, was surprising since it is usually secreted late in activation and rarely described with CD8+ T cells. Endogenous IL-10 may mediate some of the phenotypic changes seen with IL-15. To evaluate this, IELs were cultured for 3 or 10 days with IL-2 or IL-15, with or without IL-10 or its neutralizing antibody (Table 2). With IL-2, addition of IL-10 increased surface expression of CD94, NKG2C, and NKG2D in a 3- but not 10-day culture. In converse, in the presence of IL-15, antibody neutralization of IL-10 reduced CD94, NKG2C, and NKG2D expression after 3 days and particularly after 10 days. As for intracytoplasmic markers, IL-10 promoted expression of FL, but not perforin, IFN-γ, TNF-α, or IL-10. Similarly, neutralizing IL-10 reduced FL expression. Manipulation of IL-10 levels had no effects on expression of NKG2A, CD2, CD8, CD16, CD25, CD56, or CD122. The ability of IL-10 to up-regulate only IL-2-induced markers at day 3 was probably due to the low amounts of endogenous IL-10 produced with IL-2 (50 ± 20 pg/ml, Fig. 3). Conversely, anti-IL-10 reduced marker expression with IL-2 on day 10 and IL-15 on either day, because all these conditions resulted in endogenous IL-10 accumulation of over 200 pg/ml. In summary, these studies show that the endogenously produced IL-10 accounts for some of the IL-15-mediated up-regulation of CD94, NKG2C, NKG2D, and FL.
Table 2.
Effects of IL-10 and anti-IL-10 on surface and intracytoplasmic markers on day 3
| Day 3 | Day 10 | |||||||
|---|---|---|---|---|---|---|---|---|
| IL-15 + | IL-2 + | IL-15 + | ||||||
| IL-2 + | IL-10 | IL-10 | IL-10 | |||||
| IL-2 | IL-10 | IL-15 | antibody | IL-2 | antibody | IL-15 | antibody | |
| Surface | ||||||||
| CD94 (%) | 32 ± 4 | 44 ± 6* | 45 ± 5 | 34 ± 5* | 66 ± 10 | 44 ± 8* | 86 ± 6 | 55 ± 6** |
| NKG2D (RFI) | 3 ± 0 | 4 ± 0* | 4 ± 1 | 3 ± 1* | 5 ± 2 | 3 ± 1* | 6 ± 2 | 4 ± 1* |
| Annexin (%) | 3 ± 1 | 10 ± 2* | 2 ± 1 | 1 ± 1 | 6 ± 2 | 4 ± 1 | 6 ± 2 | 4 ± 3 |
| Cytoplasmic | ||||||||
| Perforin (%) | 33 ± 8 | 35 ± 8 | 41 ± 5 | 38 ± 8 | 58 ± 8 | 60 ± 3 | 66 ± 9 | 67 ± 10 |
| FAS ligand(%) | 26 ± 5 | 59 ± 6* | 44 ± 7 | 26 ± 5* | 55 ± 5 | 29 ± 5** | 66 ± 8 | 31 ± 5** |
| IFN-γ (RFI) | 3 ± 2 | 4 ± 1 | 4 ± 2 | 6 ± 2 | 8 + 4 | 9 ± 2 | 9 ± 4 | 10 + 3 |
| TNF-α (%) | 22 ± 4 | 25 ± 6 | 25 ± 5 | 39 ± 5 | 4 ± 4 | 6 ± 2 | 8 ± 4 | 12 ± 5 |
| IL-10 (RFI) | 2 ± 1 | 2 ± 1 | 3 ± 1 | 3 ± 1 | 5 ± 4 | 4 ± 3 | 6 ± 2 | 5 ± 3 |
IELs were cultured for 3 or 10 days with IL-2 or IL-15 ± IL-10 or anti-IL-10. After a 6 hr PHA/PMA/brefeldin cocktail, they were stained for surface markers or, after permeabilization, for i.c. markers by direct immunofluorescence and analysed by flow cytometry (n = 6). The results are expressed as percentage positive cells or, if most cells display the marker, RFI. Some data were excluded for the sake of clarity as the values resembled those with IL-2 or IL-15 alone: IL-2 + anti-IL-10 (day 3); IL-15 + IL-10 (day 3); IL-2 + IL-10 (day 10); IL-15 + IL-10 (day 10). Asterisks represents values significantly different from those with IL-2 or IL-15 alone;
P < 0·05
P < 0·01
Experiments were then conducted to determine the functional effects of endogenous IL-10 on IL-2- and IL-15-stimulated IEL cytotoxicity against HT-29 or Jurkat cells and against P815 cells in redirected lysis. With IL-2 or IL-15 stimulation alone, cytotoxic activity increased markedly from day 3 to day 10 (Fig. 6). The effects of manipulating IL-10 levels on lysis of Jurkat cells paralleled those on marker expression, including FL. That is, IL-10 only increased IL-2-induced killing on day 3, while anti-IL-10 reduced lysis with IL-2 on day 3 and IL-15 on both days. With HT-29 cells, which are killed by both FL- and perforin-mediated events by the CD94+ IELs,35 IL-10 again increased killing with IL-2 on day 3. However, unlike Jurkat cells, anti-IL-10 reduced killing only with IL-15 on day 10. Because HT-29 cells are less sensitive to FL-mediated killing than Jurkat cells, the effects of anti-IL-10 may only occur when endogenous IL-10 and FL expression are maximum, that is, with IL-15 on day 10. Manipulating IL-10 levels had no effects on killing of P815 cells (in the presence of anti-CD3) or WEHI cells, targets that are particularly susceptible to perforin- and TNF-mediated cytotoxicity, respectively. Manipulations of IL-10 levels, then, altered FL-mediated killing of Jurkat cells and FL expression by IELs in the same way.
Figure 6.

IL-2- and IL-15-induced cytotoxicity—day 3 and day 10. IELs were cultured for 3 or 10 days with IL-2 or IL-15 + IL-10 or anti-IL-10, and cytotoxic activities against four target cells were compared (n = 10). Note the different E : T ratios for day 3 and day 10. The asterisks mark significantly different values compared to those with IL-2 or IL-15 for that day.
A study of the cytotoxic mediators on day 3 corroborated these findings. Soluble concentrations of FL and TNF-α were determined by ELISA while those of serine esterases were assessed using the BLT assay (Table 3). Quantitation of membrane FL and TNF-α proved difficult due to the low amounts expressed. Again, IL-10 increased IL-2-induced release of FL, but did not affect the secretion of TNF-α or serine esterases. Anti-IL-10 reduced IL-15-stimulated FL release only.
Table 3.
Effects of IL-10 and anti-IL-10 on release of cytotoxic mediators
| IL-15 + | ||||
|---|---|---|---|---|
| IL-2 | IL-2 + IL-10 | IL-15 | anti-IL-10 | |
| FL (pg/ml) | 20 ± 10 | 120 ± 15* | 80 ± 8 | 40 ± 8 * |
| TNF-α (pg/ml) | 8 ± 4 | 10 ± 10 | 9 ± 8 | 10 ± 7 |
| Serine esterases(fold increase) | 1·4 ± 0·2 | 1·4 ± 0·1 | 1·6 ± 0·2 | 1·6 ± 0·2 |
IELs were cultured for 3 days with IL-2 ± IL-10 or IL-15 ± anti-IL-10. Amounts of FL and TNF-α that were released were measured by ELISA. Release of serine esterases was measured by the BLT assay where the OD readings are a ratios of experimental values to those obtained with IELs cultured in medium alone.
Significantly different from the values with IL-2 or IL-15 alone.
The modest increase in apoptosis with 10 ng/ml of IL-10 (Table 2) rose to over 30% when concentrations greater than 20 ng/ml were added (Table 4). To determine the mechanism, Abs inhibiting FL or TNF-α were introduced at the start of the culture in conjunction with IL-2 and high-dose IL-10 (Table 4). The IL-10-induced apoptosis was reversed by neutralizing FL but not TNF-α, again showing that IL-10 promotes FL-mediated killing.
Table 4.
Effects of blocking FL or TNF-α on IL-10-induced apoptosis
| % Annexin+ PI– IELs | |
|---|---|
| IgG | 30 ± 4 |
| Anti-FL | 3 ± 1* |
| Anti-TNF-α | 28 ± 4 |
IELs were cultured for 18 hr with IL-2 (10 ng/ml) and IL-10 (30 ng/ml) with antibodies neutralizing either FL or TNF-α (n = 4). The percentages of annexin+PI– IELs were determined by immunofluorescence.
Significantly less than the IgG control.
Discussion
This study shows that IL-15-stimulated IELs initially secreted IFN-γ and to a lesser extent, IL-10. With prolonged stimulation, the IELs became predominantly CD94+ and produced massive amounts of IFN-γ and IL-10. These cytokines accumulated because the cells did not adjust their transcriptional rate according to extracellular levels. Chronic IL-15 stimulation enhanced cytotoxic activities, particularly those mediated by perforin and FL. The up-regulated FL synthesis and cytotoxic actions were mediated in part by endogenous IL-10.
IFN-γ has been shown to be the predominant cytokine secreted by IELs in response to infection 2 and in pathogenic states such as coeliac sprue.3,23,24,26 While IL-10 is mainly produced by APCs, several reports describe CD8+ T cells as IL-10-producers, generally using T cell clones.36–39 All such CD8+ T cells were either resistant to or inhibited by IL-10. IELs, too, are occasionally described as IL-10-secretors in vitro although not as a predominant cytokine.40,41 IL-10-producing IELs have been documented histologically in coeliac sprue when gluten challenge was performed in vivo for at least one month.26 IL-10-producing IELs were not found when gluten challenge was performed in vitro for several hours.24 This is consistent with the idea that IL-10 production is best manifested after chronic stimulation.
T cells producing both IFN-γ and IL-10 have been described in chronic intracellular infections such as Mycobacterium tuberculosis and Leishmania major. Such double-producers are usually CD4+, with only rare reports of double-producing CD8+ T-cell clones.42,43 These cells may form in response to chronic infection. Alternatively, the chronic infection may persist because of the inhibitory influences of IL-10.42 Such chronic infections involve activated APCs that produce IL-12, a potent stimulus for both IFN-γ and IL-10 production.30,43
The massive accumulation of IFN-γ and IL-10 by chronically stimulated IELs, especially in the absence of IL-12, is novel. The effect was possible because of a lack of measurable feedback regulation. That is, the numbers of transcripts for each cytokine remained stable despite addition of IFN-γ or IL-10 or their neutralizing antibodies to the cultures. This was not caused by an unresponsiveness to IL-10 as this cytokine moulded the phenotype and cytotoxic activities of IELs.
This study also showed that TNF-α-producing IELs were found in substantial numbers on day 3 but not day 10 with IL-15-stimulation. The numbers of TNF-α-producing IELs in coeliac sprue is variable. They decrease with prolonged gluten challenge27 perhaps similar to the effects of prolonged IL-15-stimulation seen here. TNF-α was also notable for minimal extracellular accumulation. Preliminary data indicate that this is caused by substantial uptake of TNF-α with negative feedback control of the rate of transcription.
Cytotoxic activity of IELs, cultured for 3 or 10 days with IL-2 or IL-15, was measured against HT-29 cells (sensitive to perforin and FL)35 Jurkat cells (sensitive to FL), P815 cells with anti-CD3 (sensitive to perforin), and WEHI cells (sensitive to TNF). Activated IELs killed greater numbers of each target cell type, compared to fresh IELs whose cytotoxic activities were measurable only against HT-29 and Jurkat cells in an 18-hr assay (manuscript in preparation). Again, IL-10 manipulations altered lysis of HT-29 and Jurkat cells, but not P815 or WEHI cells. This parallels the findings that expression and release of FL, but not perforin or TNF-α, were altered by manipulating IL-10 levels. Similarly, high amounts of IL-10 during stimulation of IELs induced FL-mediated apoptosis. The relationship of IL-10 with FL-mediated killing has been shown using IL-10-transgenic mice with CD4+ T cell killing of salivary glands.44 In another study of lymphocytes from patients with serum lupus erythematosis, 20 ng/ml of IL-10 induced FL-mediated apoptosis.45 IL-10 has also been shown to induce FL-mediated apoptosis of monocytes.46
IL-15 is a survival factor and stimulus for IELs. As shown here, its effects are different when evaluated after short- or long-term stimulation. When extrapolating to the in vivo picture, IL-15 responses by IELs are likely to differ in acute infections compared to chronic inflammatory diseases, such as coeliac sprue. Changes in IL-10 levels are important to understand if this cytokine is to be used therapeutically.
Abbreviations
- IEL
intraepithelial lymphocytes
- EC
epithelial cells
- BLT
N-α-benzyloxycarbonyl-l-lysine thiobenzyl ester
- FL
Fas ligand
References
- 1.Reinecker HC, MacDermott RP, Mirau S, Dignass A, Podolsky DK, et al. Intestinal epithelial cells both express and respond to interleukin 15. Gastroenterology. 1996;111:1706–13. doi: 10.1016/s0016-5085(96)70036-7. [DOI] [PubMed] [Google Scholar]
- 2.Hirose K, Suzuki H, Nishimura H, et al. Interleukin 15 may be responsible for early activation of intestinal intraepithelial lymphocytes after oral infection with Listeria monocytogenes in rats. Infection Immunity. 1998;66:5677–83. doi: 10.1128/iai.66.12.5677-5683.1998. [DOI] [PMC free article] [PubMed] [Google Scholar]
- 3.Mention J-J, Ahmed M, Bègue B, et al. IL-15: a key to disrupted intraepithelial lymphocyte homeostasis and lymphomagenesis in celiac disease. Gastroenterology. 2003;125:730–45. doi: 10.1016/s0016-5085(03)01047-3. 10.1016/S0016-5085(03)01047-3. [DOI] [PubMed] [Google Scholar]
- 4.Lai Y-G, Gelfanov V, Gelfanova V, et al. IL-15 promotes survival but not effector function differentiation of CD8+ TCRαβ+ intestinal intraepithelial lymphocytes. J Immunol. 1999;163:5843–50. [PubMed] [Google Scholar]
- 5.Inagaki-Ohara K, Nishimura H, Mitani A, et al. Interleukin 15 preferentially promotes the growth of intestinal intraepithelial lymphocytes bearing αδ T cell receptor in mice. Eur J Immunol. 1997;27:2885–91. doi: 10.1002/eji.1830271121. [DOI] [PubMed] [Google Scholar]
- 6.Ebert EC. IL-15 is a potent stimulant of intraepithelial lymphocytes. Gastroenterology. 1998;115:1439–45. doi: 10.1016/s0016-5085(98)70022-8. [DOI] [PubMed] [Google Scholar]
- 7.Khan IA, Casciotti L. IL-15 prolongs the duration of CD8+ T cell-mediated immunity in mice infected with a vaccine strain of Toxoplasma gondii. J Immunol. 1999;163:4503–9. [PubMed] [Google Scholar]
- 8.Lepage AC, Buzoni-Gatel D, Bout DT, Kasper LH. Gut-derived intraepithelial lymphocytes induce long-term immunity against Toxoplasma gondii. J Immunol. 1998;161:4902–8. [PubMed] [Google Scholar]
- 9.Bass DM. Interferon gamma and interleukin 1, but not interferon alfa, inhibit rotavirus entry into human intestinal cell lines. Gastroenterology. 1997;113:81–9. doi: 10.1016/S0016-5085(97)70083-0. [DOI] [PMC free article] [PubMed] [Google Scholar]
- 10.Dimier IH, Bout DT. Rat intestinal epithelial cell line IEC-6 is activated by recombinant interferon-γ to inhibit replication of the coccidian Toxoplasma gondii. Eur J Immunol. 1993;23:981. doi: 10.1002/eji.1830230435. [DOI] [PubMed] [Google Scholar]
- 11.Rottenberg ME, Rothfuchs AG, Gigliotti D, Ceausu M, Une C, Levitsky V, Wigzell H. Regulation and role of IFN-γ in the innate resistance to infection with Chlamydia pneumoniae. J Immunol. 2000;164:4812–8. doi: 10.4049/jimmunol.164.9.4812. [DOI] [PubMed] [Google Scholar]
- 12.Bruewer M, Luegering A, Kucharzik T, Parkos CA, Madara JL, Hopkins AM, Nusrat A. Proinflammatory cytokines disrupt epithelial barrier function by apoptosis-independent mechanisms. J Immunol. 2003;171:6164–72. doi: 10.4049/jimmunol.171.11.6164. [DOI] [PubMed] [Google Scholar]
- 13.Roberts AI, Blumberg RS, Christ AD, Brolin RE, Ebert EC. Staphylococcal enterotoxin B induces potent cytotoxic activity by intraepithelial lymphocytes. Immunol. 2000;101:185–90. doi: 10.1046/j.1365-2567.2000.00088.x. 10.1046/j.1365-2567.2000.00088.x. [DOI] [PMC free article] [PubMed] [Google Scholar]
- 14.Buzoni-Gatel D, Debbabi H, Mennechet FJD, Martin V, Lepage AC, Schwarzman JD, Kasper LH. Murine ileitis after intracellular parasite infection is controlled by TGF-β-producing intraepithelial lymphocytes. Gastroenterology. 2001;120:914–24. doi: 10.1053/gast.2001.22432a. [DOI] [PubMed] [Google Scholar]
- 15.Suzuki Y, Sher A, Yap G, et al. IL-10 is required for prevention of necrosis in the small intestine and mortality in both genetically resistant BALB/c and susceptible C57BL/6 mice following peroral infection with Toxoplasma gondii. J Immunol. 2000;164:5375–82. doi: 10.4049/jimmunol.164.10.5375. [DOI] [PubMed] [Google Scholar]
- 16.Madsen KL, Lewis SA, Tavernini MM, et al. IL-10 prevents cytokine-induced disruption of T84 monolayer barrier integrity and limits chloride secretion. Gastroenterology. 1997;113:151–9. doi: 10.1016/s0016-5085(97)70090-8. [DOI] [PubMed] [Google Scholar]
- 17.de Winter H, Elewaut D, Turovskaya O, et al. Regulation of mucosal immune responses by recombinant IL-10 produced by intestinal epithelial cells in mice. Gastroenterology. 2002;122:1829–41. doi: 10.1053/gast.2002.33655. [DOI] [PubMed] [Google Scholar]
- 18.Groux H, Bigler M, de Vries JE, Roncarolo MG, et al. Inhibitory and stimulatory effects of IL-10 on human CD8+ T cells. J Immunol. 1998;160:3188–93. [PubMed] [Google Scholar]
- 19.Ebert EC. IL-10 enhances IL-2-induced proliferation and cytotoxicity by human intestinal lymphocytes. Clin Exp Immunol. 2000;119:426–32. doi: 10.1046/j.1365-2249.2000.01147.x. 10.1046/j.1365-2249.2000.01147.x. [DOI] [PMC free article] [PubMed] [Google Scholar]
- 20.Fujii S, Shimizu K, Shimizu T, Lotze MT, et al. Interleukin-10 promotes the maintenance of antitumor CD8+ T cell effector function in situ. Blood. 2001;98:2143. doi: 10.1182/blood.v98.7.2143. [DOI] [PubMed] [Google Scholar]
- 21.Mocellin S, Panelli MC, Wang E, et al. The dual role of IL-10. Trends Immunol. 2003;24:36–43. doi: 10.1016/s1471-4906(02)00009-1. 10.1016/S1471-4906(02)00009-1. [DOI] [PubMed] [Google Scholar]
- 22.Maiuri L, Picarelli A, Boirivant M, Coletta S, Mazzilli MC, De Vincenzi M, Londei M, Auricchio S. Definition of the initial immunologic modifications upon in vitro gliadin challenge in the small intestine of celiac patients. Gastroenterology. 1996;110:1368–78. doi: 10.1053/gast.1996.v110.pm8613040. [DOI] [PubMed] [Google Scholar]
- 23.Jabri B, De Serre N, Cellier C, et al. Selective expansion of intraepithelial lymphocytes expressing the HLA-E-specific natural killer receptor CD94 in celiac disease. Gastroenterology. 2000;118:867–79. doi: 10.1016/S0016-5085(00)70173-9. [DOI] [PMC free article] [PubMed] [Google Scholar]
- 24.Nilsen E, Jahnsen FL, Lundin KEA, Johansen F-E, Fausa O, Sollid LM, Jahnsen S, Scott H, Brandtzaeg P. Gluten induces an intestinal cytokine response strongly dominated by interferon-γ in patients with celiac disease. Gastroenterology. 1998;115:551–63. doi: 10.1016/s0016-5085(98)70134-9. [DOI] [PubMed] [Google Scholar]
- 25.Ciccocioppo R, DiSabatino A, Parroni R, et al. Cytolytic mechanisms of intraepithelial lymphocytes in celiac disease. Clin Exp Immunol. 2000;120:235–40. doi: 10.1046/j.1365-2249.2000.01200.x. [DOI] [PMC free article] [PubMed] [Google Scholar]
- 26.Forsberg G, Hernell O, Melgar S, Israelsson A, Hammarstrom S, Hammarstrom M-L. Paradoxical coexpression of proinflammatory and down-regulatory cytokines in intestinal T cells in childhood celiac disease. Gastroenterology. 2002;123:667–78. doi: 10.1053/gast.2002.35355. 10.1053/gast.2002.35355. [DOI] [PubMed] [Google Scholar]
- 27.Maiuri L, Ciacci C, Auricchio S, Brown V, Quaratino S, Londei M. Interleukin 15 mediates epithelial changes in celiac disease. Gastroenterology. 2000;119:996–1006. doi: 10.1053/gast.2000.18149. [DOI] [PubMed] [Google Scholar]
- 28.Ohta N, Hiroi T, Dweon M-N, Kinoshita N, Jang MH, Mashimo T, Miyazaki J-I, Kiyono H. IL-15-dependent activation-induced cell death-resistant Th1 type CD8αβ+ NK1.1+ T cells for the development of small intestinal inflammation. J Immunol. 2002;169:460–8. doi: 10.4049/jimmunol.169.1.460. [DOI] [PubMed] [Google Scholar]
- 29.Ebert EC. Proliferative responses of human intraepithelial lymphocytes to various T-cell stimuli. Gastroenterology. 1989;97:1372–81. doi: 10.1016/0016-5085(89)90379-x. [DOI] [PubMed] [Google Scholar]
- 30.Nishijima K-I, Hisatsune T, Minal Y, et al. Anti-IL-10 antibody enhances the proliferation of CD8+ T cell clones: autoregulatory role of murine IL-10 in CD8+ T cells. Cell Immunol. 1994;154:193–201. doi: 10.1006/cimm.1994.1068. 10.1006/cimm.1994.1068. [DOI] [PubMed] [Google Scholar]
- 31.Foey AD, Parry SL, Williams LM, et al. IL-12 synergizes with IL-2 and other stimuli in inducing IL-10 production by human T cells. J Immunol. 1996;156:3159–65. [PubMed] [Google Scholar]
- 32.Jeannin P, Delneste Y, Seveso M, Life P, Bonnefoy JY. TGF-beta enhances macrophage ability to produce IL-10 in normal and tumor-bearing mice. J Immunol. 1995;155:4926–32. [PubMed] [Google Scholar]
- 33.Parry SL, Sebbag M, Feldmann M, Brennan FM. Contact with T cells modulates monocyte IL-10 production. role of T cell membrane TNF-alpha. J Immunol. 1997;158:3673–81. [PubMed] [Google Scholar]
- 34.Schmidt-Weber CB, Alexander SI, Henault LE, James L, Lichtman AH. IL-4 enhances IL-10 gene expression in murine Th2 cells in the absence of TCR engagement. J Immunol. 1999;162:238–44. [PubMed] [Google Scholar]
- 35.Ebert EC. IL-12 up-regulates perforin- and Fas-mediated lymphokine activated killer activity by intestinal intraepithelial lymphocytes. Clin Exp Immunol. 2004;138:259–65. doi: 10.1111/j.1365-2249.2004.02614.x. 10.1111/j.1365-2249.2004.02614.x. [DOI] [PMC free article] [PubMed] [Google Scholar]
- 36.Minai Y, Goto M, Kohyama M, et al. Difference in signal transduction for IL-10 and IFNγ production in a CD8+ T cell clone. Cell Immunol. 1996;172:200–4. doi: 10.1006/cimm.1996.0233. 10.1006/cimm.1996.0233. [DOI] [PubMed] [Google Scholar]
- 37.Rohrer JW, Coggin JH. CD8+ T cell clones inhibit antitumor T cell function by secreting IL-10. J Immunol. 1995;155:5719–27. [PubMed] [Google Scholar]
- 38.Gerosa F, Paganin C, Peritt D, et al. IL-12 primes human CD4 and CD8 T cell clones for high production of both IFNγ and IL-10. J Exp Med. 1996;183:2559. doi: 10.1084/jem.183.6.2559. 10.1084/jem.183.6.2559. [DOI] [PMC free article] [PubMed] [Google Scholar]
- 39.Wang H-C, Klein JR. Multiple levels of activation of murine CD8+ IELs defined by OX40 (CD134) expression: effects on cell-mediated cytotoxicity, IFNγ, and IL-10 regulation. J Lmmunol. 2001;167:6717–23. doi: 10.4049/jimmunol.167.12.6717. [DOI] [PubMed] [Google Scholar]
- 40.Lundqvist C, Melgar S, Yeung MM, Hammarstrom S, Hammarstrom M-L. Intraepithelial lymphocytes in human gut have lytic potential and a cytokine profile that suggest T helper 1 and cytotoxic functions. J Immunol. 1666(157):1926–34. [PubMed] [Google Scholar]
- 41.Beagley KW, Fujihashi K, Lagoo AS, et al. Differences in intraepithelial lymphocyte T cell subsets isolated from murine small versus large intestine. J Immunol. 1995;154:5611–9. [PubMed] [Google Scholar]
- 42.Trinchieri G. Regulatory role of T cells producing both interferon γand interleukin 10 in persistent infection. J Exp Med. 2001;194:F53–F57. doi: 10.1084/jem.194.10.f53. 10.1084/jem.194.10.f53. [DOI] [PMC free article] [PubMed] [Google Scholar]
- 43.Windhagen A, Anderson DE, Carrizosa A, Williams RE, Hafler DA. IL-12 induces human T cells secreting IL-10 with IFNγ. J Immunol. 1996;157:1127–31. [PubMed] [Google Scholar]
- 44.Saito I, Haruta K, Shimuta M, et al. Fas ligand-mediated exocrinopathy resembling Sjogren's syndrome in mice transgenic for IL-10. J Immunol. 1999;162:2488. [PubMed] [Google Scholar]
- 45.Georgescu L, Vakkalanka K, Elkon KB, Crow MK. Interleukin-10 promotes activation-induced cell death of SLE lymphocytes mediated by Fas ligand. J Clin Invest. 1997;100:2622. doi: 10.1172/JCI119806. [DOI] [PMC free article] [PubMed] [Google Scholar]
- 46.Schmidt M, Lugering N, Pauels HG, Schulze-Osthoff K, Domschke W, Kucharzik T. IL-10 induces apoptosis in human monocytes involving the CD95 receptor/ligand pathway. Eur J Immunol. 2000;30:1769. doi: 10.1002/1521-4141(200006)30:6<1769::AID-IMMU1769>3.0.CO;2-9. 10.1002/1521-4141(200006)30:6<1769::AID-IMMU1769>3.0.CO;2-9. [DOI] [PubMed] [Google Scholar]