Abstract
Canine cutaneous histiocytoma is a benign epidermal neoplasm of Langerhans cell origin, which usually displays spontaneous regression. Based on the degree of lymphocytic infiltration, 30 histiocytomas were classified into four groups representing different stages of tumour regression. To elucidate further the mechanisms of the antitumour immune response CD3+, CD21+, CD4+, CD8+ and myeloid/histiocyte antigen+ inflammatory cells were differentiated by immunohistochemistry and quantified. In addition, the number of apoptotic cells was detected using the TdT-mediated biotin–dUTP nick-end labelling (TUNEL) method. Furthermore, the expression of interleukin- (IL-2), IL-12(p40), tumour necrosis factor-α (TNF-α), interferon-γ (IFN-γ), IL-10 and transforming growth factor-β (TGF-β) as well as inducible nitric oxid synthase (iNOS) mRNA was determined by reverse transcription–polymerase chain reaction (RT–PCR). Phenotyping of inflammatory cells revealed a significantly increased infiltration of all lymphocyte subsets and myeloid/histiocytic cells with the onset of tumour regression. The latter was significantly correlated to up-regulation of IL-2, TNF-α, IFN-γ and iNOS mRNA expression. Expression of remaining cytokines and percentage of apoptotic cells showed no group-specific changes. The results indicate an initial infiltration of CD4+ T cells followed by increased expression of Th1 cytokines and recruitment of antitumour effector cells as the principal mechanism for tumour regression. Canine cutaneous histiocytoma is a unique example for an effective immune response in a naturally occurring neoplasm derived from epidermal Langerhans cells and might represent a valuable animal model to investigate tumour immunity.
Keywords: canine cutaneous histiocytoma, CD4+ T cells, CD8+ T cells, macrophages, Th1 cytokines
Introduction
Canine cutaneous histiocytoma (CCH or histiocytoma) is a common histiocytic tumour of the skin most frequently affecting young dogs. The neoplasm occurs solitarily, often localized on the head or limbs. It is well circumscribed and ranges in diameter from 0·2 to 3 cm. After a period of rapid growth, the tumour regresses spontaneously in most cases. Recurrence is seldom seen and metastasis has not been described.1–5 Rare cases of multiple histiocytomas have been mentioned. In the latter, tumours tend to persist and involvement of regional lymph nodes may occur.4 Tumour cells express leucocyte antigens characteristic for canine Langerhans cells, such as major histocompatibility antigen (MHC) class II, CD1 and CD11c, as shown by immunohistochemistry.4 Similarly, investigations on an ultrastuctural level confirmed features of Langerhans cells.6 Immunophenotyping of histiocytoma cells by flow cytometry has substantiated the conclusion that CCH represents a neoplasm of Langerhans cell origin.7
CCH is one of the few naturally occurring neoplasms that display spontaneous regression. Histologically, there are accumulations of mature lymphocytes at the periphery and within the tumour, interpreted as a sign of the host immune response.1–5 In a previous study the amount and distribution of infiltrating lymphocytes was examined histologically in four separate tumour groups, to show that the degree of lymphocytic infiltration in CCH was correlated with a proposed scheme of tumour regression.5 In an immunohistochemical investigation, tumour infiltrating lymphocytes were almost exclusively CD8+ cells, and only scant numbers of CD4+ lymphocytes or B cells were observed. It was concluded that tumour regression in CCH is mediated by CD8+ T lymphocytes. However, a distinction of different tumour groups depending upon the degree of lymphocytic infiltration was not performed.4
Investigations on the expression pattern of MHC II indicated a shift of antigen distribution from the cytoplasm to the tumour cell surface in histiocytomas with increased infiltration of CD3+ T cells.8 Similarly, a comparison of antigen expression by flow cytometry showed a higher expression of MHC I, MHC II and intercellular adhesion molecule-1 (ICAM-1) and a lower expression of E-cadherin in neoplastic cells isolated from histiocytomas with lymphocytic infiltrates. Furthermore, tumour cells obtained from these neoplasms induced a significantly stronger proliferative response in autologous peripheral blood mononuclear cells, consistent with the hypothesis of different maturation states during tumour progression and regression.7 Summarizing previous investigations, tumour cells in regressing CCH differentiate towards a phenotype of activated dendritic cells and regression is associated with an increase of lymphocytic infiltrates composed mainly of CD8+ T cells.
The interaction between neoplastic cells and the immune system involves a multitude of cell types and mediators. Understanding the process of spontaneous regression in a naturally occurring neoplasm may provide important information on antitumour immunity. To detail further the possible effector mechanisms in CCH, the aim of the present study was (i) to investigate the composition of tumour infiltrating lymphocytes, (ii) to detect the expression of selected pro- and anti-inflammatory cytokines, (iii) to evaluate the number of myeloid/histiocyte antigen+ cells and nitric oxide synthase (iNOS) mRNA expression as indicators of macrophage action and (iv) to estimate the degree of apoptosis in different stages of tumour regression.
Materials and methods
Tissue processing and tumour classification
A total of 30 histiocytomas, excised for medical reasons at the request of the dog's owners, were used in this study. The animals' history, including affected breed, gender, age and tumour localization, was provided by the attending veterinarian (Table 1). Tumours were collected immediately after surgery. One-half of the neoplasm was used for the preparation of frozen tissue blocks9 and stored at −80° until used. The remaining half was fixed in 10% non-buffered formalin and paraffin-embedded. Sections were cut at 2–4 µm thickness and stained with haematoxylin and eosin (H & E). Additionally, serial sections were prepared for immunohistochemistry. Histiocytomas were classified into four groups using the degree and pattern of lymphocytic infiltration in H & E-stained sections as key parameters for grouping, as described by others (Table 2).5 Briefly, lymphocytic infiltration was minimal to absent and restricted mainly to the periphery of the tumour in group I. In group II, a moderate lymphocytic infiltration, displaying a diffuse distribution pattern in the centre and nodular infiltrates at the periphery of the tumour, was present. Histiocytomas in group III were characterized by marked nodular infiltrates both at the periphery and in the centre. In group IV, the lymphocytic cell population outnumbered the histiocytic tumour cell population with infiltrates extending from the deep tumour margin to the epithelial surface.
Table 1.
Breed, sex, and age of affected dogs; localization of histiocytomas and their grouping based on findings in haematoxylin and eosin-stained sections
| Breed | Sex, age | Localization | Group |
|---|---|---|---|
| Staffordshire terrier | Male, 8 months | Paw | 1 |
| Boxer | Female, 3 yr | Ear | 1 |
| Yorkshire terrier | Female, 2 yr | Nose | 1 |
| Fox terrier | Male, 3 yr | Paw | 1 |
| Rottweiler | Female, 6 months | Lip | 1 |
| Husky mix | Female, 1 y | Leg | 1 |
| Yorkshire terrier | Female, 13 yr | Thigh | 2 |
| Great Dane | Male, 1 yr | Ear | 2 |
| Pit bull terrier | Female, 4 yr | Paw | 2 |
| Staffordshire terrier | Male, 1 y | Nose | 2 |
| Labrador mix | Female, 4 yr | Ear | 2 |
| Mongrel | Male, 6 months | Knee | 3 |
| Retriever mix | Male, 5 months | Jaw | 3 |
| Boxer | Female, 4 yr | Ear | 3 |
| Rottweiler | Female, 6 months | Cheek | 3 |
| Labrador mix | Female, 9 months | Chest | 3 |
| Labrador mix | Male, 3 yr | Neck | 3 |
| Jack Russell terrier | Male, 6 months | Leg | 3 |
| Pit bull terrier | Female, 1 yr | Chest | 3 |
| Great Dane | Male, 4 yr | Ear | 3 |
| Cocker spaniel mix | Male, 1 yr | Ear | 3 |
| Terrier mix | Male, 1 yr | Chest | 4 |
| Boxer mix | Male, 6 months | Paw | 4 |
| Boxer | Female, 3 yr | Paw | 4 |
| German shepherd | Female, 1 yr | Ear | 4 |
| Bedlington terrier | Male, 2 yr | Lip | 4 |
| Great Dane | Male, 3 yr | Paw | 4 |
| Dachshund | Female, 1 yr | Eyelid | 4 |
| German shorthaired | Male, 1 yr | Leg | 4 |
| Mongrel | Female, 2 yr | Eyelid | 4 |
Table 2.
Histological classification of canine cutaneous histiocytomas using the degree of lymphocytic infiltration; number of tumours in each group (n); median minimum and maximum age of dogs in years
| Age of dogs | |||||
|---|---|---|---|---|---|
| Group | Degree and distribution of lymphocytic infiltration* | n | Min | Median | Max |
| I | None to minimal; diffuse | 6 | 0.5 | 1.5 | 3.0 |
| II | Moderate; diffuse infiltration in the centre, nodular infiltrates at the periphery | 5 | 1.0 | 4.0 | 1.0 |
| III | Marked; nodular infiltrates central and peripheral | 10 | 0.4 | 0.9 | 4.0 |
| IV | Lymphocyte population is greater than tumour cell population | 9 | 0.5 | 1.0 | 3.0 |
According to Cockerell and Slauson 19795
Immunohistochemistry and TdT-mediated biotin–dUTP nick-end labelling (TUNEL) assay
Different subpopulations of infiltrating lymphocytes were identified on serial frozen tissue sections using antibodies directed against CD3ε- (clone: CD3-12; Connex Munich, Germany), CD21(like)- (clone: CA2.1D6; Dr P. Moore UC Davis, CA), CD4- (clone: YKIX302.9.3.7.; Dr S. Cobbold University of Cambridge, UK) and CD8-antigen (Dr C. Vogel, GSF National Research Center for Environment and Health, Munich, Germany). Detection was performed by the avidin–biotin–peroxidase complex (ABC) method.9,10 Myeloid/histiocyte antigen positive cells were detected by MAC 387 immunoreactivity (Dako Diagnostika, Hamburg, Germany)11,12 on formalin-fixed paraffin-embedded sections after protease treatment. The peroxidase antiperoxidase (PAP) system was used for detection of this antigen. For each antigen the number of positive cells per square unit of tissue was counted using an ocular morphometric grid in a light microscope. Values represented the average number of positive cells per mm2.
Apoptotic cells in paraffin-embedded tissue sections were detected by using the TUNEL assay (in situ cell death detection kit, AP; Boehringer, Mannheim, Germany, according to the manufacturer's instructions) and their light microscopic appearance. TUNEL-positive cells with and without morphological features of apoptosis were counted as described above. The ratio of positive cells per total cell number (%) was evaluated.
Semi-quantitative real time polymerase chain reaction (PCR)
Total ribonucleic acid (RNA) was isolated from 10 consecutive frozen tissue sections with a thickness of 20 µm using Trizol reagent (Life Technologies, Eggstein, Germany). After RNA isolation, samples were diluted in water to gain an equal RNA concentration of 100 ng/µl for each sample. The samples were DNAse-treated (Boehringer) to avoid amplification of genomic DNA and reverse-transcribed using the reverse transcription–polymerase chain reaction (RT–PCR) core kit (Perkin Elmer, Applied Biosystems, Weiterstadt, Germany).13 The generated cDNA was used for real time PCR in the LightCycler rapid thermal cycler system (Roche Diagnostics, Mannheim, Germany) using a SYBR-green PCR kit according to the manufacturer's instructions (LightCycler-FastStart DNA master SYBR green I, Roche Diagnostics, Mannheim, Germany). The primers for PCR were taken from the literature10 or designed using published canine cDNA sequences (Table 3). β-Actin was employed as housekeeping gene. Canine peripheral blood leucocytes stimulated with concanavalin A (Con A) served as a positive control for the detection of cytokine mRNA. A tissue sample from a case of cutaneous Leishmaniasis was used as positive control for the amplification of iNOS mRNA.
Table 3.
Primer sequences used for the amplification of cytokine, inducible nitric oxide synthase (iNOS) and housekeeping gene transcripts
| Primer | Sequence (5′−3′) | Acc. no., position |
|---|---|---|
| β-Actin S | CGT TGC TAT CCA GGC TGT GC | M10277, 2064–83 |
| β-Actin AS | GTA GTT TCG TGG ATG CCA CA | M10277, 2593–2574 |
| IL-2 S | AGA TGG AGC AAT TAC TGC TGG | U28141, 139–159 |
| IL-2 AS | ATT CTG TGG CCT TCT TGG GCG TGT | U28141, 258–235 |
| IL-10 S | CCT GGG TTG CCA AGC CCT GTC | U338433, 235–255 |
| IL-10 AS | ATG CGC TCT TCA CCT GCT CC | U338433, 446–427 |
| IL-12 (p40)S | CAC CTG CCA TAC CCC TGA AG | U49100, 144–163 |
| IL-12 (p40)AS | TGA CCC TCT CTG CTG AAA GT | U49100, 541–522 |
| TGF-β S | TTC CTG CTC CTC ATG GCC AC | L34956, 826–854 |
| TGF-β AS | GCA GGA GCG CAC GAT CAT GT | L34956, 1218–1199 |
| TNF-α S | CCA AGT GAC AAG CCA GTA GC | Z70046, 32–51 |
| TNF-α AS | TCT TGA TGG CAG AGA GTA GG | Z70046, 305–286 |
| IFN-γ S | GCA AGT AAT CCA GAT GTA TCG | S41201, 67–87 |
| IFN-γ AS | TTA TCG CCT TGC GCT GGA CC | S41201, 349–330 |
| iNOS S | AGA CAC ACT TCA CCA CAA GG | AF077821, 369–388 |
| iNOS AS | TGC TTG GTG GCG AAG ATG AGC | AF077821, 653–633 |
Acc. no. = GenBank Accession no.; S = sense primer, AS = antisense primer.
Samples were considered PCR positive when they displayed fluorescence signals above background threshold and generated well-defined, temperature-specific peaks in the melting point analysis of the LightCycler System. For quantification of the amplified mRNA, data were analysed with the LightCyler software 3 (Roche, Diagnostics, Mannheim, Germany) using the fit point method. To minimize interassay variations all 30 histiocytomas, a positive and a negative control were analysed in the same PCR run. As the LightCycler provides space for only 32 samples, quantification was performed by importation of an external standard curve. Relative amounts of mRNA for each sample were determined by calculating the ratio of cytokine/iNOS expression and the expression of the housekeeping gene β-actin (% of β-actin).
Statistical analysis
For statistical analysis of the obtained cell numbers per square unit in groups I–IV (almost log-normal distributed), one-way analysis of variance with a following pairwise group comparison by the Tukey test was applied. The data were presented graphically by geometric mean and dispersion factor. Analysis of mRNA expression in groups I–IV (not normally distributed) was performed using the Kruskal–Wallis test with a pairwise test according to Nemenyi. For data presentation box-and-whisker plots were used, showing median and quartiles as well as minimum and maximum. The correlation of inflammatory cell numbers versus relative cytokine/iNOS mRNA expression was tested using Spearman's rank correlation coefficient. A level of P < 0·05 was considered statistically significant for all tests. Analysis was performed using the statistical program package bmdp/Dynamic, release 7·0.14
Results
Histopathological findings and tumour classification
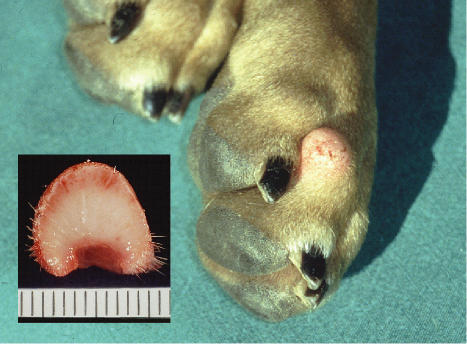
The collected histiocytomas originated from dogs of different breeds, ranging in age from 5 months to 13 yr. Fifteen dogs were male and 15 female. The majority of tumours were localized on the head and legs and only rarely on the chest (Fig. 1) (Table 1). Except for the tumour, all animals were found to be healthy at clinical examination. Reliable information upon first appearance of the neoplasm and growth development was not provided by the dog's owner.
Figure 1.
Canine cutaneous histiocytoma on the paw of an 8-month-old female Staffordshire terrier. Insert: cut surface.
Based on the degree of lymphocytic infiltration in H & E-stained sections 6, 5, 10 and 9, histiocytomas were classified as groups I, II, III and IV, respectively. The median age of dogs was 1·5, 4·0, 0·9 and 1·0 yr in groups I–IV, respectively (Table 2).
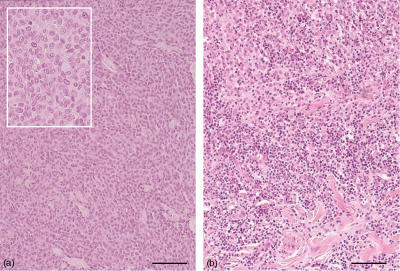
Group I histiocytomas displayed a minimal perivascular to diffuse lymphocytic infiltration in the tumour periphery and none or only few scattered lymphocytes in the centre (Fig. 2a). Two of six histiocytomas in group I showed focal ulceration with crust formation and infiltration of neutrophilic granulocytes. In group II histiocytomas, a mild to moderate lymphocytic infiltration in the centre of the tumour and a moderate nodular infiltration in the periphery was found. Three of five histiocytomas in this group showed focal ulceration associated with neutrophilic granulocytes. In group III, nodular accumulations of lymphocytes were observed in the centre and periphery of the tumours (Fig. 2b). Numerous infiltrates were located at the border to the subcutis and in four cases there were marked nodular lymphocytic infiltrations in the adjacent subcutaneous adipose tissue. Seven of 10 group III histiocytomas showed ulcerations with neutrophilic infiltration, in three cases extending to the superficial corium. In histiocytomas of group IV, cells were packed less densely and there were larger amounts of connective tissue, especially in the deeper corium. Few tumour cells were found between large accumulations of infiltrating lymphocytes. All tumours in this group showed ulcerations of varying degree. In addition a marked neutrophilic infiltration was noted in four cases.
Figure 2.
(a) Histocytoma of group l, tumour cells with round to oval nuclei and indistinct cell borders. Insert: high power magnification. (b) Histiocytoma of group III, infiltration with numerous lymphocytes between tumour cells. Paraffin sections, haematoxylin and eosin, bar=100 µm.
Immunohistochemistry and TUNEL assay
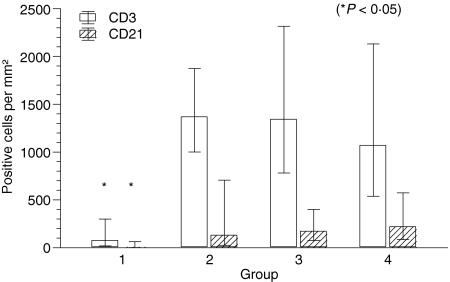
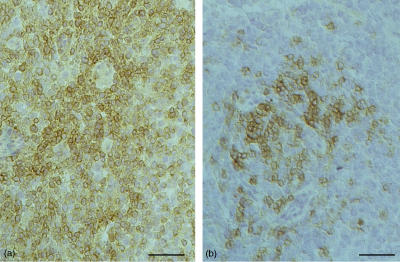
CD3+, CD21+, CD4+ and CD8+ lymphocytes were present in all four tumour groups in varying numbers. Statistical analysis revealed a significant increase of CD3+ T lymphocytes from group I with a geometric mean of 76/mm2 to groups II, III and IV with 1369/mm2, 1345/mm2 and 1071/mm2, respectively (P = 0·003). The number of CD21+ B lymphocytes also showed a significant increase with a geometric mean of 7/mm2 in group I to 133/mm2, 174/mm2 and 221/mm2 in groups II, III and IV (P = 0·003). The comparison of CD3+ and CD21+ cells showed that there were far more T cells than B cells present in all tumour groups (Figs 3 and 4).
Figure 3.
Number of CD3+ and CD21+ lymphocytes per mm2 in groups I–IV histiocytoma. Columns represent geometric mean and dispersion factor. Asterisk indicates significant group difference.
Figure 4.
Immunoreactivity of CD3+ and CD21+ lymphocytes in a group II histiocytoma. Frozen sections, avidin-biotin-peroxidase complex (ABC) method, bar=50 µm. (a) Numerous CD3+ cells; (b) few CD21+ cells.
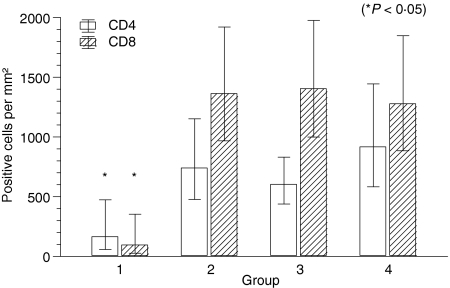
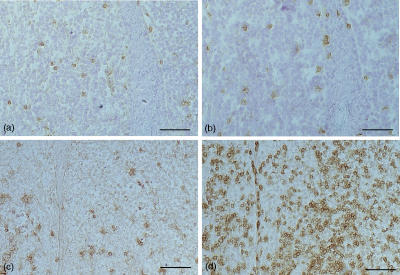
Quantification of CD4+ and CD8+ T cells revealed an increase of positive cells from group I to groups II, III and IV. The geometric mean of CD4+ cells in group I was 165/mm2, followed by 741/mm2, 603/mm2 and 918/mm2 in groups II, III and IV, respectively (P = 0·022). The geometric mean of CD8+ cells rose from 96/mm2 in group I to 1363/mm2, 1405/mm2 and 1278/mm2 in groups II, III and IV, respectively (P = 0·006). There were slightly more CD4+ than CD8+ T cells in group I, whereas the CD8+ cells were clearly the dominant cell type in groups II, III and IV, leading to a significant change in the CD4/CD8 ratio (P = 0·002) (Figs 5 and 6).
Figure 5.
Number of CD4+ and CD8+ lymphocytes per mm2 in groups I–IV histiocytoma. Columns represent geometric mean and dispersion factor. Asterisk indicates significant group difference.
Figure 6.
Immunoreactivity of CD4+ and CD8+ infiltrating lymphocytes in group I and group III histiocytoma. Slightly more CD4+ cells in group I (a, b). Dominance of CD8+ cells in group III (c, d). Frozen sections, ABC method, bar=100 µm. (a) CD4/group I; (b) CD8/group I; (c) CD4/group III; (d) CD8/group III.
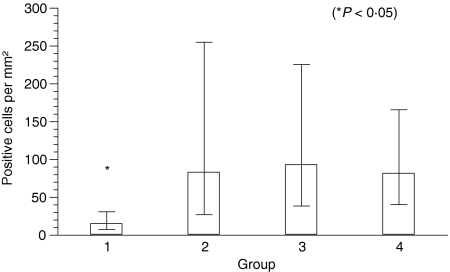
A significant increase of myeloid/histiocyte antigen+ cells from group I to groups II, III and IV with a geometric mean of 15/mm2; 83/mm2, 93/mm2, and 82/mm2 was also observed (P = 0·002) (Fig. 7).
Figure 7.
Number of myeloid/histiocyte antigen+ cells per mm2 in groups I–IV histiocytomas. Columns represent geometric mean and dispersion factor. Asterisk indicates significant group difference.
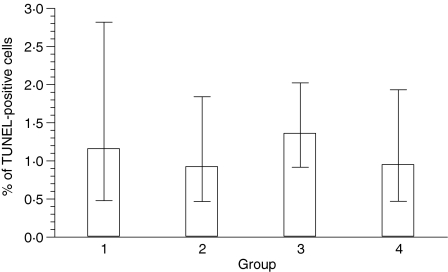
The mean percentage of TUNEL-positive cells remained similar in all four groups with 1·2%, 0·9%, 1·4% and 1·0% in groups I, II, III and IV, respectively. Statistical analysis revealed no significant group difference (P = 0·61) (Fig. 8). Similarly, the percentage of TUNEL-positive cells, which displayed morphological features of apoptosis, did not reveal significant differences between the four groups (P = 0·20) with a mean of 0·1%, 0·1%, 0·2% and 0·1% in groups I, II, III and IV, respectively.
Figure 8.
Percentage of TdT-mediated biotin–dUTP nick-end labelling (TUNEL)-positive cells in groups I–IV histiocytomas. Columns represent geometric mean and dispersion factor.
Cytokine and iNOS mRNA expression
The integrity of isolated RNA was demonstrated by amplification of β-actin in all samples. Cytokine or iNOS transcripts were amplified from canine controls and randomly selected samples obtained from investigated tumours were sequenced to confirm their specificity. Results matched published canine sequences to 95–100%, thus confirming the suitability of the used PCR primers.
Qualitative analysis of PCR results, considering the number of positive samples in each group regardless of the semiquantitative values, is shown in Table 4. All samples in group I were negative for iNOS mRNA, but in groups II, III and IV, three of five, seven of ten and seven of nine investigated neoplasms were positive. IL-2 mRNA was detected in only one of six histiocytomas in group I but in four of five, nine of ten and eight of nine histiocytomas of groups II, III and IV. IL-12(p40) transcripts were present in one of six tumours in group I and in none of the tumours in group II. In groups III and IV, four of ten and five of nine samples were positive. Five of six histiocytomas in group I and all histiocytomas in the remaining three groups were positive for TNF-α. IFN-γ was not detected at all in group I neoplasms. However, all tumours in groups II and III and eight of nine tumours in group IV were positive. Transcripts of the anti-inflammatory cytokines IL-10 and TGF-β were amplified in all samples of each group (Table 4).
Table 4.
Number and percentage of mRNA positive samples in histiocytomas of groups I, II, III and IV
| Group I (n = 6) | Group II (n = 5) | Group III (n = 10) | Group IV (n = 9) | |
|---|---|---|---|---|
| iNOS | 0/6 (0%) | 3/5 (60%) | 7/10 (70%) | 7/9 (78%) |
| IL-2 | 1/6 (17%) | 4/5 (80%) | 9/10 (90%) | 8/9 (89%) |
| IL-12 | 1/6 (17%) | 0/5 (0%) | 4/10 (40%) | 5/9 (56%) |
| TNF-α | 5/6 (83%) | 5/5 (100%) | 10/10 (100%) | 9/9 (100%) |
| IFN-γ | 0/6 (0%) | 5/5 (100%) | 10/10 (100%) | 8/9 (89%) |
| IL-10 | 6/6 (100%) | 5/5 (100%) | 10/10 (100%) | 9/9 (100%) |
| TGF-β | 6/6 (100%) | 5/5 (100%) | 10/10 (100%) | 9/9 (100%) |
Positive tumours/total number of tumours (percentage), n=number of animals in group.
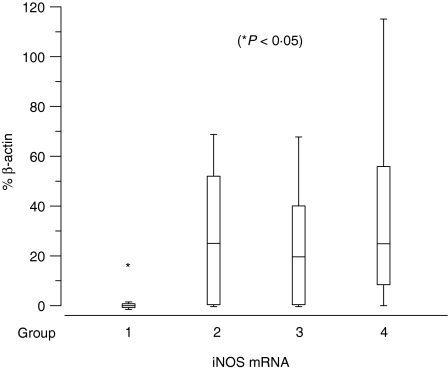
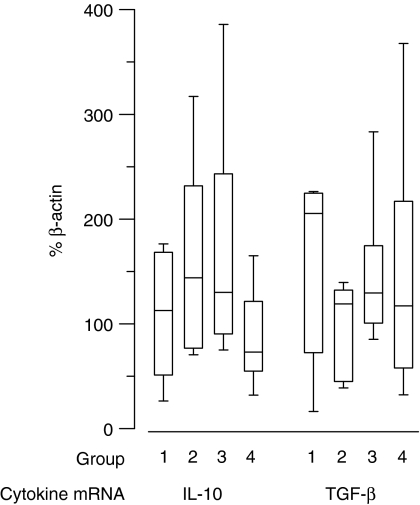
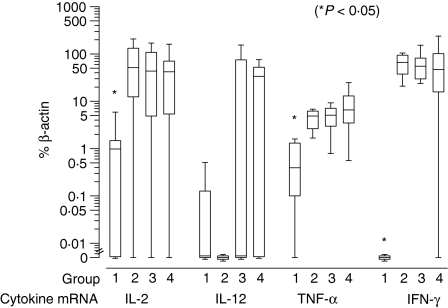
Results of semiquantitative PCR are presented as percentage of β-actin mRNA expression in Figs 9–11. Significant up-regulation of iNOS, IL-2, TNF-α and IFN-γ expression was found in groups II, III and IV compared to group I. The median of relative iNOS expression showed a significant increase from 0% in group I to 25%, 19·6% and 24·9% in groups II, III and IV, respectively (P = 0·045; Fig. 9). IL-2 expression rose approximately 45-fold with a median of 1% in group I and 51·6%, 43·6% and 42% in groups II, III and IV, respectively (P = 0·026). The relative IL-12(p40) expression displayed a median of 0% in the first three groups and 33·7% in the fourth group. However, this difference was not significant (P = 0·13). The level of TNF-α expression showed an approximately 12-fold increase from group 1 with a median of 0·4% to 4·8%, 5% and 6·5% in groups II, III and IV, respectively (P = 0·003). The values of IFN-γ were elevated significantly from a median of 0% in group I to 66·4%, 55·4% and 46·9% in groups II, III and IV, respectively (P = 0·003) (Fig. 10). For IL-10 and TGF-β the relative expression was similar in all four groups with medians of 112·7%, 143·9%, 130% and 73% for IL-10 and 205·3%, 119%, 129·4% and 117% for TGF-β. Statistical analysis revealed no significant differences (IL-10: P = 0·12; TGF-β: P = 0·22) (Fig. 11).
Figure 9.
Relative expression of inducible nitric oxide synthase (iNOS) mRNA as percentage of β-actin in groups I–IV histiocytoma. Box-and-whisker plots display values as minimum, maximum, median, lower and upper quartiles. Asterisk indicates significant group difference.
Figure 11.
Relative expression of anti-inflammatory cytokines mRNA as percentage of β-actin in groups I–IV histiocytoma. Box-and-whisker plots display values as minimum, maximum, median, lower and upper quartiles.
Figure 10.
Relative expression of inflammatory cytokine mRNA as percentage of β-actin in groups I–IV histiocytomas. Box-and-whisker plots display values as minimum, maximum, median, lower and upper quartiles. Asterisk indicates significant group difference.
Results of statistical correlation of inflammatory cell numbers per square unit of tissue versus relative cytokine/iNOS mRNA expression, regardless of the initial tumour classification, are shown in Table 5. Relative iNOS expression was correlated significantly with the number of CD3+, CD21+, CD8+ and myeloid/histiocyte antigen+ cells. IL-2 expression was correlated significantly with the amount of CD3+ and CD8+ cells. TNF-α expression was correlated significantly with all detected cell types and IFN-γ expression was correlated significantly with the number of CD3+, CD21+, CD8+ and myeloid/histiocyte antigen+ cells. The expression of the remaining cytokines IL-12, IL-10 and TGF-β was not correlated significantly with any of the inflammatory cells (Table 5).
Table 5.
Statistical correlation of inflammatory cell numbers versus relative cytokine/inducible nitric oxide synthase (iNOS) mRNA expression in canine cutaneous histiocytoma
| iNOS | IL-2 | IL-12 | TNF-α | IFN-γ | IL-10 | TGF-β | |
|---|---|---|---|---|---|---|---|
| CD3+ | P = 0·007 | P = 0·005 | NS | P = 0·011 | P = 0·007 | NS | NS |
| CD21+ | P = 0·011 | NS | NS | P = 0·004 | P = 0·002 | NS | NS |
| CD4+ | NS | NS | NS | P = 0·001 | NS | NS | NS |
| CD8+ | P = 0·017 | P = 0·014 | NS | P = 0·005 | P = 0·032 | NS | NS |
| myeloid/histiocyte antigen+ | P = 0·030 | NS | NS | P = 0·012 | P = 0·012 | NS | NS |
IFN: interferon; IL: interleukin; TGF: transforming growth factor; TNF: tumour necrosis factor.
NS=not significant.
Discussion
The aim of the present study was to gain more insightful information on the mechanisms of antitumour immune response in regressing CCH. Immunohistological quantification of tumour-infiltrating lymphocytes showed a significant increase of CD3+, CD21+, CD4+ and CD8+ cells. As initial tumour grouping was based on the degree and distribution of lymphocytic infiltration in H & E-stained sections,5 an increased number of lymphocytes was expected. However, a continuous increase of inflammatory cells from group I to group IV, as originally anticipated, was not found. All significant changes between groups were restricted to group I versus groups II, III and IV. This finding might be caused by the fact that the initial tumour classification was based on subjectively estimated morphological features. The detection of specific antigens provided additional information on the lymphocyte subsets and more accurate data on cell numbers per square unit of tissue. Surprisingly, the previously observed dominance of CD8+ T lymphocytes could not be confirmed for all tumour groups. In group I histiocytomas with few diffusely scattered lymphocytes slightly more CD4+ T cells than CD8+ T cells were present. CD4+ T cells are known to be important for the initiation of the antitumour immune response, mainly through cytokine release. In addition, they are essential for ‘cross presentation’, making antigen-presenting cells fully competent to prime CD8+ T cells.15–17 The high proportion of CD8+ T cells in regressive histiocytomas could therefore be due to a initial T helper function. Beyond the activation of tumour specific lymphocytes, CD4+ T cells possess further antitumour functions in the recruitment of non-specific effector cells such as macrophages, which can exert additional tumouricidal activity by synthesis of reactive metabolites.18 In the present study, tumour infiltrating macrophages, detected by myeloid/histiocyte antigen-immunoreactivity, showed a significant increase from group I to groups II, III and IV. The up-regulation of iNOS expression, an enzyme that produces the cytotoxic metabolite nitric oxide, also suggests that macrophages as cells of the innate immunity might contribute to the reduction of the tumour mass. However, there is also evidence for a tumour-promoting effect of nitric oxide and the tumoricidal potential of tumour-infiltrating macrophages is controversially discussed.19–21
The lack of increased apoptosis in regressive histiocytomas was surprising. Cytotoxic effector cells can induce apoptosis of tumour cells, mediated through different pathways. However, in many tumour types the extent of apoptosis is not correlated with their biological behaviour. Phagocytosis and proliferation rate should also be considered when tumour development is evaluated.22 In human Langerhans cell histiocytosis, for example, low numbers of TUNEL-reactive cells were detected, although Fas and Fas ligand (Fas-L) were highly expressed. This finding was explained by the rapid turnover of apoptotic cells in the tissue.23 A similar mechanism might account for the observed lack of increased apoptosis in the present study.
The cytokine mRNA detection by semiquantitative real time PCR revealed that the progress of tumour infiltration from group I to groups II, III and IV was accompanied by increased expression of Th1 cytokines such as IL-2-, TNF-α and IFN-γ. Whereas a significant group-specific up-regulation of IL-12(p40) or the anti-inflammatory cytokines IL-10 and TGF-β was lacking. The up-regulation of IL-2 expression in histiocytomas with advanced lymphocytic infiltration could be due to its role as a proliferation factor for T cells. Additionally, IL-2 might contribute to the reduction of tumour cells through the generation of lymphokine-activated killer cells.24–26 IFN-γ is an important factor for the induction of a Th1 immune response and it enhances the cytotoxic potential of CD8+ T cells.27 Accordingly, IFN-γ expression in CCH started with increased infiltration of lymphocytes. In addition, IFN-γ represents an important factor for the cytotoxic activity of macrophages by inducing the synthesis of the reactive metabolite NO.28,29 In the present investigation, up-regulation of iNOS mRNA started simultaneously with IFN-γ expression in group II. This finding could indicate that tumour infiltrating macrophages might be activated by IFN-γ. TNF-α promotes the proliferation of T cells and natural killer (NK) cells and it can induce apoptosis directly by binding to specific receptors.30 Although at high concentrations it can cause tumour necrosis through thrombosis of blood vessels, chronic low-dose TNF-α might act as a tumour promoter.31 The finding that TNF-α expression is significantly up-regulated with increasing numbers of inflammatory cells indicates that the antitumour effect of TNF-α predominated in CCH. The indistinct IL-12(p40) expression was surprising, as mature dendritic cells are known to express large amounts of IL-12. Moreover, this cytokine represents a key factor for the development of a type Th1 immune response.32,33 It should be taken into account that the p40 subunit, recognized by the applied primers, is also part of IL-23. This cytokine also exerts antitumour activity, but acts by different mechanisms in which CD8+ T cells seem to play a crucial role.34,35 In the case of CCH, the role of IL-12/IL-23 remains unclear. Whether the onset of lymphocytic infiltration and Th1 cytokine expression are triggered by other mechanisms remains to be investigated. IL-10 and TGF-β were equally present in all four groups. Similarly, in other studies these anti-inflammatory cytokines were detected in tumour tissue and in vitro they are produced by many tumour cell lines.36–38 However, the biological significance of IL-10 or TGF-β production in neoplasm remains uncertain. Possibly, they contribute to immune escape of neoplastic cells through their immunosuppressive function.39 In CCH the levels of IL-10 or TGF-β apparently did not prevent the development of an effective cellular immune response.
Summarizing, the increase of lymphocytic infiltration was accompanied by up-regulation of type Th1 cytokines, which are known to support the induction and activity of cellular immunity. Furthermore, the expression of iNOS mRNA, an indicator for macrophage activity, was up-regulated. As the up-regulation of IL-2, TNF-α, IFN-γ and iNOS coincides with the increase of infiltrating inflammatory cells in groups II–IV, it can be assumed that tumour-associated immune cells are most probably their source. To support this hypothesis a statistical correlation analysis was applied, regardless of the initial tumour grouping. It confirmed that IL-2, TNF-α, IFN-γ and iNOS expression was correlated significantly with numbers of lymphocytes or macrophages. However, this needs to be substantiated by future investigations using isolated cells or tissue areas composed mainly of neoplastic or inflammatory cells, respectively. In this manner it could also be determined whether the total increase of cytokine expression is the result of increased numbers of immune cells or increased mRNA expression on a single-cell basis.
In the case of dendritic cells there is some debate as to whether true ‘dendritic cell cancer’ actually exists. A possible reason for its rarity is that mature dendritic cells are terminally differentiated, making their transformation unlikely. Another explanation could be that dendritic cell tumours have the unique capacity to prime T cells leading to their own eradication.40 The events taking place during the regression of CCH could support the latter hypothesis. As it has been shown previously that the neoplastic cells of CCH have features of dendritic APCs,4,6,7 they might present neoantigens in combination with adequate costimulatory molecules. The presence of CD4+ and CD8+ T cells in the tumour environment, as observed in this study, indicated that both MHC II- and MHC I-restricted antigen presentation might take place. Additionally, activated macrophages as non-specific effector cells were detected. Finally, proinflammatory cytokines that are necessary for activation and proliferation of tumoricidal effectors were up-regulated. The combination of these findings seems to fulfill the theoretical prerequisites for a successful antitumour immune response. However, the initial signal for these events remains unknown. The expression of surface molecules that are needed for an optimal interaction between dendritic APCs and T cells needs to be investigated in further studies.
The presence of host leucocytes in solid tumours is seen commonly. In many studies tumour infiltration was associated with an improved prognosis. In contrast, there is growing evidence that inflammatory cells and cytokines within tumours are more likely to contribute to tumour growth.41,42 CCH is a naturally occurring neoplasm and to date inoculation studies to reproduce the tumour experimentally have not been reported. It cannot be ruled out that inflammation is only an epiphenomenon in an otherwise self-limiting process. In vitro or transplantation studies would be required to detail further the role of various cell populations or individual cytokines for tumour regression. Nevertheless, the results of the present investigation are compatible with the hypothesis that cellular infiltration and cytokine release lead to the regression of a solid tumour of epidermal Langerhans cell origin.
Acknowledgments
The authors wish to thank U. Meyer, A. Lemmer and H. Menzel for the collection of tumour samples, H. Heiter for the support in graphical illustration and A. Artelt for technical assistance. Ute Kaim received a scholarship from the ‘Graduiertenkolleg Molekulare Veterinärmedizin’, Justus-Liebig-University Giessen, Germany.
References
- 1.Scott DW, Miller WH, Jr, Griffin CE. Neoplastic and non-neoplastic tumours. In: Muller GH, editor. Muller and Kirk's Small Animal Dermatology. 6. Philadelphia: WB Saunders Company; 2001. pp. 1236–414. [Google Scholar]
- 2.Taylor DON, Dorn CR, Luis OH. Morphologic and biologic characteristics of the canine cutaneous histiocytoma. Cancer Res. 1969;29:83–92. [PubMed] [Google Scholar]
- 3.Hendrick MJ, Mahaffey EA, Moore FM, Vos JH, Walder EJ. Histiocytic tumours. In: Schulman Fy., editor. WHO International Histological Classification of Mesenchymal Tumours of Skin and Soft Tissues of Domestic Animals. II. Washington, DC: Armed Forces Institute of Pathology; 1998. pp. 29–31. Second series. [Google Scholar]
- 4.Moore PF, Schrenzel MD, Affolter VK, Olivry T, Naydan D. Canine cutaneous histiocytoma is an epidermotropic Langerhans cell histiocytosis that expresses CD1 and specific beta 2-integrin molecules. Am J Pathol. 1996;148:1699–708. [PMC free article] [PubMed] [Google Scholar]
- 5.Cockerell GL, Slauson DO. Patterns of lymphoid infiltrate in the canine cutaneous histiocytoma. J Comp Pathol. 1979;89:193–203. doi: 10.1016/0021-9975(79)90058-6. [DOI] [PubMed] [Google Scholar]
- 6.Marchal T, Dezutter-Dambuyant C, Fournel C, Magnol JP, Schmitt D. Electron microscopic study on canine cutaneous histioytoma: a benign Langerhans cell tumour. In: Banchereau J, Scmitt D, editors. Dendritic Cells in Fundamental and Clinical Immunology. Advances in Experimental Medicine and Biology 378. New York: Plenum Press; 1995. pp. 549–51. Series 2. [DOI] [PubMed] [Google Scholar]
- 7.Baines SJ, Bujdoso R, Blacklaws BA, McInnes E, Moore PF, McConnel IM. Maturation stages of dendritic cells in canine cutaneous histioytoma. Vet Dermatol. 2000;11(Suppl. 1):9–10. [Google Scholar]
- 8.Kipar A, Baumgärtner W, Kremmer E, Frese K, Weiss E. Expression of major histocompatibility complex class II antigen in neoplastic cells of canine cutaneous histiocytoma. Vet Immunol Immunopathol. 1998;62:1–13. doi: 10.1016/s0165-2427(97)00170-0. [DOI] [PubMed] [Google Scholar]
- 9.Wünschmann A, Alldinger S, Kremmer E, Baumgärtner W. Identification of CD4+ and CD8+ T-cell subsets and B cells in the brain of dogs with spontaneous acute, subacute, and chronic-demyelinating distemper encephalitis. Vet Immunol Immunopathol. 1999;67:101–16. doi: 10.1016/s0165-2427(98)00216-5. [DOI] [PubMed] [Google Scholar]
- 10.Markus S, Failing K, Baumgärtner W. Increased expression of pro-inflammmatory cytokines and lack of up-regulation of anti-inflammatory cytokines in early distemper CNS lesions. J Neuroimmunol. 2002;125:30–41. doi: 10.1016/s0165-5728(02)00027-9. [DOI] [PubMed] [Google Scholar]
- 11.Flavell DJ, Jones DB, Wright DH. Identification of tissue histiocytes on paraffin sections by a new monoclonal antibody. J Histochem Cytochem. 1987;35:1217–26. doi: 10.1177/35.11.3309045. [DOI] [PubMed] [Google Scholar]
- 12.Perez J, Day MJ, Mozos E. Immunohistochemical study of the local inflammatory infiltrate in spontaneous canine transmissible veneral tumour at different stages of growth. Vet Immunol Immunopathol. 1998;64:133–47. doi: 10.1016/s0165-2427(98)00131-7. [DOI] [PubMed] [Google Scholar]
- 13.Gröne A, Frisk AL, Baumgärtner W. Cytokine mRNA expression in whole blood samples from dogs with natural canine distemper virus infection. Vet Immunol Immunopathol. 1998;65:11–27. doi: 10.1016/s0165-2427(98)00170-6. [DOI] [PubMed] [Google Scholar]
- 14.Dixon WJ, editor. BMDP Statistical Software Manual. 1 and 3. Berkeley, LA/Oxford: University of California Press; 1993. [Google Scholar]
- 15.Bennett SRM, Carbone FR, Karamalis F, Miller JFAP, Heath WR. Induction of a CD8+ cytotoxic T-lymphocyte response by cross-priming requires cognate CD4+ T cell help. J Exp Med. 1997;186:65–70. doi: 10.1084/jem.186.1.65. [DOI] [PMC free article] [PubMed] [Google Scholar]
- 16.Huang AYC, Golumbek P, Ahmadzadeh M, Jaffee E, Pardoll D, Levitsky H. Role of bone marrow-derived cells in presenting MHC class 1-restricted tumour antigens. Science. 1994;264:961–5. doi: 10.1126/science.7513904. [DOI] [PubMed] [Google Scholar]
- 17.Bennett SRM, Carbone FR, Karamalis F, Flavell RA, Miller JFAP, Heath WR. Help for cytotoxic T cell response is mediated by CD40 signaling. Nature. 1998;393:478–80. doi: 10.1038/30996. [DOI] [PubMed] [Google Scholar]
- 18.Hung K, Hayashi R, Lafond-Walker A, Lowenstein C, Pardoll D, Levitsky H. The central role of CD4+ T-cells in the antitumour immune response. J Exp Med. 1998;188:2357–68. doi: 10.1084/jem.188.12.2357. [DOI] [PMC free article] [PubMed] [Google Scholar]
- 19.Bingle L, Brown NJ, Lewis CE. The role of macrophages in tumour progression: implications for new anticancer therapies. J Pathol. 2002;196:254–65. doi: 10.1002/path.1027. [DOI] [PubMed] [Google Scholar]
- 20.Jenkins DC, Charles IG, Thomsen LL, et al. The role of nitric oxide in tumour growth. Proc Natl Acad Sci USA. 1995;92:4392–6. doi: 10.1073/pnas.92.10.4392. [DOI] [PMC free article] [PubMed] [Google Scholar]
- 21.Coussens LM, Werb Z. Inflammation and cancer. Nature. 2002;420:860–7. doi: 10.1038/nature01322. [DOI] [PMC free article] [PubMed] [Google Scholar]
- 22.Soini Y, Pääkkö P, Letho V-P. Histopathological evaluation of apoptosis in cancer. Am J Pathol. 1998;153:1041–53. doi: 10.1016/S0002-9440(10)65649-0. [DOI] [PMC free article] [PubMed] [Google Scholar]
- 23.Petersen BL, Rengtved P, Bank MI, Carstens H. High expression of markers of apoptosis in Langerhans cell histiocytosis. Histopathology. 2003;42:186–93. doi: 10.1046/j.1365-2559.2003.01565.x. [DOI] [PubMed] [Google Scholar]
- 24.Rodella L, Rezzani R, Zauli G, Mariani AR, Rizzoli R, Vitale M. Apoptosis induced by NK cells is modulated by the NK-active cytokines IL-2 and IL-12. Int Immunol. 1997;10:719–25. doi: 10.1093/intimm/10.6.719. [DOI] [PubMed] [Google Scholar]
- 25.Rosenberg SA. Progress in the development of immunotherapy for the treatment of patients with cancer. J Intern Med. 2001;250:462–75. doi: 10.1046/j.1365-2796.2001.00911.x. [DOI] [PMC free article] [PubMed] [Google Scholar]
- 26.Fehinger TA, Cooper MA, Caligiuri MA. Interleukin-2 and interleukin-15: immunotherapy for cancer. Cytokine Growth Factor Rev. 2002;13:169–83. doi: 10.1016/s1359-6101(01)00021-1. [DOI] [PubMed] [Google Scholar]
- 27.Ikeda H, Old LJ, Schreiber RD. The roles of IFNγ in protection against tumour development and cancer immunoediting. Cytokine Growth Factor Rev. 2002;13:95–109. doi: 10.1016/s1359-6101(01)00038-7. [DOI] [PubMed] [Google Scholar]
- 28.Fujiwara H, Clark SC, Hamaoka T. Cellular and molecular mechanisms underlying IL-12 induced tumour regression. Ann NY Acad Sci. 1996;795:294–309. doi: 10.1111/j.1749-6632.1996.tb52679.x. [DOI] [PubMed] [Google Scholar]
- 29.Fujiwara H, Hamaoka T. The anti-tumour effects of IL-12 involve enhanced IFN-γ production by anti-tumour T cells, their accumulation to tumour sites and in situ IFN-γ production. Leukemia. 1997;11(Suppl. 3):570–1. [PubMed] [Google Scholar]
- 30.Le J, Vilcek J. Tumour necrosis factor and interleukin 1: cytokines with multiple overlapping biological activities. Lab Invest. 1987;56:234–48. [PubMed] [Google Scholar]
- 31.Balkwill F. Tumour necrosis factor or tumour promoting factor? Cytokine Growth Factor Rev. 2002;13:135–41. doi: 10.1016/s1359-6101(01)00020-x. [DOI] [PubMed] [Google Scholar]
- 32.Banchereau J, Steinman RM. Dendritic cells and the control of immunity. Nature. 1998;392:245–52. doi: 10.1038/32588. [DOI] [PubMed] [Google Scholar]
- 33.Colombo MP, Trinchieri G. Interleukin-12 in anti-tumour immunity and immunotherapy. Cytokine Growth Factor Rev. 2002;13:155–68. doi: 10.1016/s1359-6101(01)00032-6. [DOI] [PubMed] [Google Scholar]
- 34.Langrish CL, McKenzie BS, Wilson NJ, de Waal Malefyt R, Kastelein RA, Cua DJ. IL-12 and IL-23: master regulators of innate and adaptive immunity. Immunol Rev. 2004;202:96–104. doi: 10.1111/j.0105-2896.2004.00214.x. [DOI] [PubMed] [Google Scholar]
- 35.Lo CH, Lee S-H, Wu PY, et al. Antitumour and antimetastatic activity of IL-23. J Immunol. 2003;171:600–7. doi: 10.4049/jimmunol.171.2.600. [DOI] [PubMed] [Google Scholar]
- 36.Fiorentino DF, Zlotnik A, Vieira P, Mosman TR, Howard M, Moore KW, O'Garra A. IL-10 acts on the antigen-presenting cell to inhibit cytokine production by Th 1 cells. J Immunol. 1991;146:3444–51. [PubMed] [Google Scholar]
- 37.Fontana A, Constam DB, Frei K, Malipiero U, Pfister HW. Modulation of the immune response by transforming growth factor beta. Int Arch Allergy Immunol. 1992;99:1–7. doi: 10.1159/000236328. [DOI] [PubMed] [Google Scholar]
- 38.Kim J, Modlin RL, Moy RL, Dubinett SM, McHugh T, Nickoloff BJ, Uyemura K. IL-10 production in cutaneous basal and squamous cell carcinomas. A mechanism for evading the local immune response. J Immunol. 1995;155:2240–7. [PubMed] [Google Scholar]
- 39.Mocellin S, Wang E, Marincola FM. Cytokines and immune response in the tumour microenvironment. J Immunother. 2001;24:392–407. [PubMed] [Google Scholar]
- 40.Levitsky HI. Tumours derived from antigen presenting cells. Semin Immunol. 1996;8:281–7. doi: 10.1006/smim.1996.0036. [DOI] [PubMed] [Google Scholar]
- 41.Drake CG, Pardoll DM. Tumour immunology − towards a paradigm of reciprocal research. Semin Cancer Biol. 2002;12:73–80. doi: 10.1006/scbi.2001.0403. [DOI] [PubMed] [Google Scholar]
- 42.Balkwill F, Mantovani A. Inflammation and cancer: back to Virchow? Lancet. 2001;357:539–45. doi: 10.1016/S0140-6736(00)04046-0. [DOI] [PubMed] [Google Scholar]


