

Abstract
SNARE proteins mediate membrane fusion in eukaryotic cells. They contain conserved SNARE motifs that are usually located adjacent to a C-terminal transmembrane domain. SNARE motifs spontaneously assemble into four helix bundles, with each helix belonging to a different subfamily. Liposomes containing SNAREs spontaneously fuse with each other, but it is debated how the SNAREs are distributed between the membranes. Here, we report that the SNAREs mediating homotypic fusion of early endosomes fuse liposomes in five out of seven possible combinations, in contrast to previously studied SNAREs involved in heterotypic fusion events. The crystal structure of the early endosomal SNARE complex resembles that of the neuronal and late endosomal complexes, but differs in surface side-chain interactions. We conclude that homotypic fusion reactions may proceed with multiple SNARE topologies, suggesting that the conserved SNARE structure allows for flexibility in the initial interactions needed for fusion.
Keywords: crystal structure, early endosomes, membrane fusin, proteoliposomes, SNAREs
Introduction
SNARE proteins comprise a superfamily of small and mostly membrane-anchored proteins that are key mediators of membrane fusion in the secretory pathway. Characteristic feature of each SNARE is a stretch of 60–70 amino acids arranged in heptad repeats, which is referred to as SNARE motif and which is usually located adjacent to a single C-terminal transmembrane domain. SNARE motifs are unstructured in solution. However, when appropriate SNARE motifs are combined, they assemble into stable four helix bundles, also termed core complexes, in which each α-helix is represented by a different SNARE motif (Hong, 2005; Jahn and Scheller, 2006). The crystal structures of two distantly related SNARE complexes revealed a high degree of structural conservation, suggesting that these structures are exemplary for all SNARE complexes (Sutton et al, 1998a; Antonin et al, 2002). In both complexes, the SNARE motifs are aligned in parallel in a coiled-coil structure. The core of the bundle is formed by 16 mostly hydrophobic layers of interacting side chains that are oriented perpendicular to the axis. An exception is found in the middle layer (‘0' layer) that is formed by four polar side chains, including three glutamines (Q) and one arginine (R), which are among the most highly conserved residues. According to their position in the bundle, SNARE motifs are classified into Qa-, Qb-, Qc-, and R-SNAREs (Fasshauer et al, 1998b; Bock et al, 2001). Sequence comparisons of many SNAREs revealed that these classes represent related subfamilies that diverged early in eukaryotic evolution, suggesting that each functional SNARE complex has a QabcR composition (Bock et al, 2001; for a review, see Hong, 2005; Jahn and Scheller, 2006).
According to the ‘zipper' hypothesis, assembly of SNAREs residing in the membranes destined to fuse is the key step in membrane fusion. Formation of such ‘trans'-complexes is thought to be initiated at the distal N-terminal ends of the SNARE motifs and then to proceed towards the C-terminal membrane anchors, thus clamping the membranes together and initiating fusion. This concept requires that a complete set of Qa-, Qb-, Qc-, and R-SNAREs is distributed among the membranes, and that each membrane contains at least one SNARE with a transmembrane domain (Jahn and Scheller, 2006). However, it is less clear which subclasses of SNAREs need to be together on the same membrane for fusion to proceed. In both constitutive exocytosis of yeast and regulated exocytosis in neurons, the R-SNARE is predominantly localized on the vesicle, whereas the Q-SNAREs are concentrated in the plasma membrane, indicating that in this case, the donor membrane contributes the R-SNARE, whereas the Q-SNAREs function as acceptors. However, for intracellular fusion events, the SNARE topologies are less clear. SNAREs recycle via membrane trafficking, resulting in a widespread distribution, which makes it difficult to discern where a given SNARE operates and where it is merely a ‘passenger'. Furthermore, in homotypic fusion events, both fusing membranes contain a full complement of SNAREs, and it thus can not be differentiated which topology allows for assembly (for a review, see Hong, 2005; Jahn and Scheller, 2006).
When complementary sets of SNAREs are reconstituted into proteoliposomes, spontaneous fusion is observed (Weber et al, 1998). Fusion is inhibited by soluble SNARE motifs, is associated with the formation of SNARE complexes, and shows other characteristics of biological fusion reactions involving SNAREs, leading to the widespread application of this approach for the study of SNARE-mediated membrane fusion (Weber et al, 1998; Brandhorst et al, 2006). Rothman and co-workers have used fusion of SNARE-containing liposomes to investigate which SNARE topologies result in fusion. In a systematic analysis of yeast SNARE complexes that are involved in trafficking at the Golgi apparatus, they found that only a single of all possible combinations resulted in fusion (Parlati et al, 2000; Paumet et al, 2001; Parlati et al, 2002). Donor vesicles contained only one SNARE (designed as v-SNARE in these studies), whereas the acceptor vesicle contained three SNAREs (t-SNARE). These findings led to the idea that for each SNARE complex, only a single 3:1 combination is fusogenic and that this limitation contributes to a SNARE-encoded specificity of intracellular membrane fusion. Surprisingly, however, the SNAREs identified as v-SNAREs in these experiments do not belong to the same subfamily. Using yeast endosomal SNAREs, fusion was only observed when the donor vesicle contained the R-SNARE Snc2p (Paumet et al, 2001). This topology agrees with observations on other SNARE complexes such as neuronal exocytosis. However, when the SNARE complex involved in anterograde traffic from the ER to the Golgi was investigated, the only SNARE functioning as v-SNARE was the Qc-SNARE Bet1p, whereas no fusion was observed when liposomes containing the R-SNARE Sec22 were combined with liposomes containing the three Q-SNAREs Sed5p (Qa), Bos1p (Qb), and Bet1p (Qc) (Parlati et al, 2000). Thus, it remains to be established whether the conserved structure of the SNARE complex also defines the pathway of SNARE assembly or whether sequence variations in each of the subclasses allow for a higher variety of assembly pathways and thus for more flexibility in defining which combinations of SNAREs are fusogenic.
In the present study, we have used the mammalian SNAREs syntaxin 13 (Qa), vti1a (Qb), syntaxin 6 (Qc), and VAMP4 (R) as model for a SNARE complex involved in homotypic fusion in order to investigate which combinations of SNAREs are fusogenic. This group of SNAREs has previously been shown to be involved in homotypic fusion of early endosomes (Brandhorst et al, 2006). Early endosomes comprise sorting organelles that communicate by vesicular traffic with the plasma membrane, the recycling endosome, the trans-Golgi network, and they mature to form late endosomes and lysosomes (for a review, see Maxfield and McGraw, 2004). The crystal structure of the complex displayed a high degree of structural similarity with the previously crystallized neuronal and late endosomal SNARE complexes, showing the typical QabcR composition. Surprisingly, however, we found that upon reconstitution into proteoliposomes, five of the possible seven combinations of SNAREs resulted in efficient fusion, including two in which each of the liposome sets contained two different SNAREs, suggesting that SNARE topologies permissive for fusion are not dictated by structural elements common to all SNARE complexes.
Results
Physical properties of the early endosomal SNARE complex
Sequence comparison between syntaxin 13, vti1a, syntaxin 6, and VAMP4 with the components of neuronal and late endosomal SNARE complexes shows a high degree of conservation in the amino acids forming the central interacting layers (42 out of a total of 64 side chains are identical; Figure 1). The non-interacting amino acids are less well conserved (Figure 1), in agreement with previous observations (Weimbs et al, 1998; Bock et al, 2001). For further characterization, the following fragments encompassing the SNARE motifs were expressed and purified: syntaxin 13 (residues 182–250), vti1a (residues 115–192), syntaxin 6 (169–232), and VAMP4 (47–117) (see also Figure 1).
Figure 1.
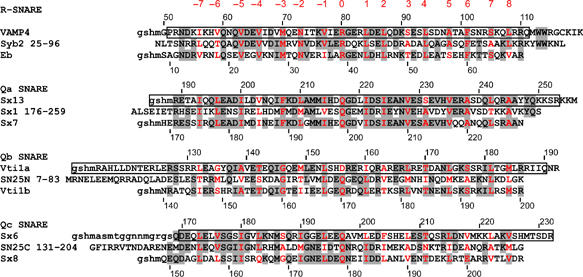
Sequence alignment of early endosomal SNAREs (top) with the neuronal (middle) and late endosomal SNARES (bottom). The alignment is restricted to the seven layers upstream (layers −1 to −7) and eight layers downstream (layers +1 to +8) of the ionic 0 layer. The amino acids of the 16 layers are shown in red and identical amino acids are shown with a gray shadow. Residues represented in the crystal structure of the early endosomal complex are boxed. Lowercase characters indicate the remaining residues of the affinity tag. Syb2, synaptobrevin/VAMP2; Eb, endobrevin/VAMP8; sx13, syntaxin 13; sx1, syntaxin 1a; sx7, syntaxin 7; SN25N, SNAP-25 (N-terminal region); sx6, syntaxin 6; SN25C, SNAP-25 (C-terminal region); sx8; syntaxin 8.
Previous work on the neuronal and late endosomal SNAREs has shown that the SNARE motifs are unstructured in solution, but assume a helical conformation when they interact with each other. Whereas in the late endosomal complex an increase in α-helicity was observed only when all four SNARE motifs were combined (Antonin et al, 2000), interactions between the neuronal SNAREs are also observed in certain binary and ternary combinations including, QabR, QacR, Qabc, and Qab (Fasshauer et al, 1998a). Using circular dichroism (CD) spectroscopy, we therefore investigated which of the possible combinations of early endosomal SNARE motifs result in increases in α-helicity (Figure 2A). As expected for SNARE core complexes, combination of all four SNARE motifs resulted in a major increase of α-helical content (Figure 2A, right). In addition, two of the four ternary combinations (QacR, QbcR) showed significant increases, suggesting that these SNAREs are capable of forming partial complexes, a conclusion that was supported when the samples were analyzed by native PAGE (Supplementary Figure 1).
Figure 2.
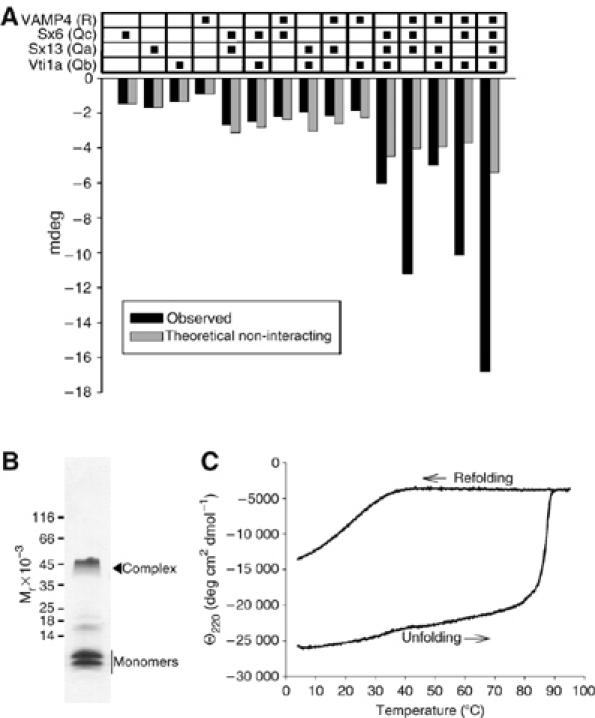
Characterization of complexes formed by early endosomal SNAREs. (A) Interactions between the SNARE motifs of syntaxin 13, syntaxin 6, vti1a, and VAMP4, measured by CD spectroscopy. Changes in ellipticity (mdeg) at 220 nm were recorded as described in Materials and methods. Gray columns represent theoretically non-interacting ellipticity at 220 nm calculated from the CD spectra of the individual proteins (columns 1–4). To obtain the observed CD spectra (black columns) of the various combinations, the proteins were incubated overnight at 4°C using equimolar ratios. Sx13, syntaxin 13; sx6, syntaxin 6. (B) Analysis of the purified complex by SDS–PAGE reveals partial resistance to SDS (Coomassie blue staining). (C) Thermal unfolding and reconstitution of the purified early endosomal SNARE complex, 15 μM protein concentration (20 mM Tris, 1000 mM NaCl, 1 mM EDTA, 1 mM DTT, and pH 7.4) monitored by CD spectroscopy. Ellipticity at 220 nm was recorded as a function of the temperature. The temperature was increased from 4 to 94°C at a rate of 60°C/h. Unfolding occurred in a steep transition, with Tm=87°C. To monitor refolding, the temperature was lowered from 90 to 4°C at a rate of −60°C/h. Refolding occurred only partially.
For further characterization, the core complex was purified by ion-exchange chromatography. The purified complex migrated as a single peak in size-exclusion chromatography, exhibiting a molecular weight of 38 kDa, as determined by multi-angle laser light scattering (see Supplementary Figure 2), very close to the predicted mass (36.5 kDa). Unlike previously characterized SNARE complexes, the purified early endosomal complex showed a strong tendency for aggregation unless kept in 0.5–1 M salt or 1 M urea.
Analysis by SDS–PAGE revealed that the complex is partially resistant to SDS, as some dissociation into monomers was observable (Figure 2B). This is similar to the late endosomal complex (Antonin et al, 2000), but differs from the neuronal complex that is fully resistant to SDS denaturation at room temperature (Hayashi et al, 1994). Next, we examined the thermal stability of the complex by monitoring the loss of α-helical content using CD spectroscopy. When the temperature was increased, significant unfolding was observed only above 80°C, with an apparent unfolding transition temperature of 87°C (Figure 2C). Subsequent cooling of the sample resulted in refolding, but at a much lower temperature (between 30 and 40°C; Figure 2C), with complete refolding being observed only when the sample was incubated overnight at 4°C (not shown). Both thermal stability and unfolding–refolding hysteresis are typical features of SNARE core complexes (Fasshauer et al, 2002).
Crystal structure of the early endosomal SNARE complex
The crystal structure of the early endosomal SNARE complex was solved and refined at a resolution of 2.7 Å (see Supplementary Table 1 for details of the crystallographic data). The overall structure revealed that the SNARE complex forms a four-helix bundle with a left-handed superhelical twist (Figure 3A). The positioning of the Qa-, Qb-, Qc-, and R-SNAREs is identical to the previously crystallized neuronal and late endosomal complexes (Sutton et al, 1998b; Antonin et al, 2002; see Figure 3A for a backbone overlay with the neuronal SNARE complex). As discussed in introduction, the center of all SNARE complexes is characterized by an unusual layer of hydrophilic residues consisting of three glutamines and one arginine. In vti1a, the glutamine is substituted by an aspartate (see Figure 1 and Supplementary Figure 3). The crystal structure shows that the aspartate occupies the same position as the glutamine in other complexes, and is involved in a similar network of hydrogen bonds (viz. salt bridges) with the other layer of amino acids (Figure 3B). In vti1a, D156 of the ‘0' layer also interacts with N152 on the surface of the vti1a helix and a water molecule (Figure 3D). Sx6 Q197 interacts with the backbone of vti1a D156 and also with sx6 E193, which in turn interacts with vti1a R157. Vti1a R157 interacts with sx6 E196. This outwardly directed network of interactions resembles that observed in the neuronal complex, where it originates from R56 of synaptobrevin (Ernst and Brunger, 2003b). The structural features of the other layers are generally similar to those of the neuronal and late endosomal complexes. In layer 6, the Qc-SNARE syntaxin 6 contains a valine, whereas the late endosomal Qc-SNARE syntaxin 8 contains a glutamate that is involved in additional interactions with surface residues. Such interactions are absent in the early endosomal and the neuronal complexes (not shown).
Figure 3.
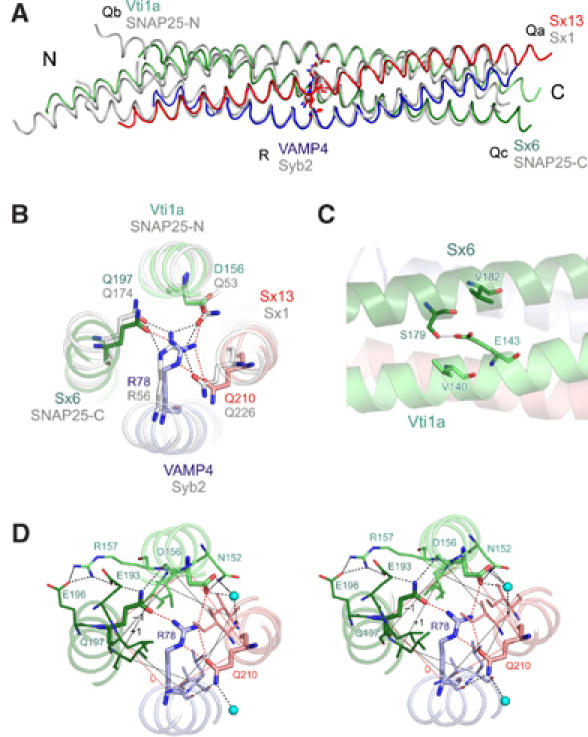
Crystal structure of the early endosomal SNARE complex. (A) Backbone overlay of the structures of the early endosomal SNARE complex (in color) and the structure of the neuronal SNARE complex (gray). QabcR classification is indicated next to protein names. (B) N- to C-terminal view of the 0 layer containing the unusual aspartate in vti1a (ribbon-ball-and-stick representation). Color, early endosomal SNARE complex; gray, neuronal SNARE complex. (C) Residue E143 builds a salt bridge with the residue S179. The residue E143 is also sandwiched by residues V182 and V140, which strengthen polar interactions. In the late endosomal and in the neuronal SNARE complex, this glutamate is conserved and interacts with a conserved arginine that occupies the position equivalent to V182 (Antonin et al, 2002; Ernst and Brunger, 2003a). (D) Stereo view of the 0 layer, including hydrogen bonds with surface residues and water molecules.
In the previously crystallized SNARE complexes, the SNARE motifs are not only connected by the central interacting layers, but also by surface interactions that frequently involve side chains with opposite charges. We have therefore analyzed the crystal structure of the early endosomal complex for surface interactions between different helices. For example, an interaction between the helices of syntaxin 6 and vti1a involves a hydrogen bond between E143 (vti1a) and S179 (sx6) (Figure 3C). At a similar (but not identical) position in the late endosomal complex, a salt bridge is formed between D157 (vti1b) and R164 (sx8) (Antonin et al, 2002). All of these side chains are conserved between the respective SNAREs of Drosophila and mammals (Supplementary Figure 4). A complete listing of all surface interactions is shown in Supplementary Table 2. While the contribution of these surface interactions to the overall stability of the complex is unknown, it is conceivable that they may contribute to the formation of partial complexes and thus influence assembly kinetics and the specificity of SNARE complex formation and therefore may also determine possible topological combinations in which homotypic fusion can occur.
Liposome fusion mediated by early endosomal SNAREs measured by spectrofluorometry
Fusion of early endosomes is considered to be ‘homotypic', that is, both fusing membranes are similar with respect to their trafficking state and thus, with respect to their major trafficking proteins. Consequently, both of the fusing membranes are likely to contain a full complement of early endosomal SNAREs, which in theory would allow the SNAREs to form trans-complexes in any of the possible topological combinations. The highly conserved structure of the early endosomal SNARE complex lends strong support to the notion that all SNARE complexes are four-helix bundles with defined positions for Qa-, Qb-, Qc-, and R-helices. For these reasons, we have used the early endosomal SNAREs as paradigm to reassess whether only a single or several of all possible topological combinations are able to assemble in trans-complexes and induce liposome fusion.
His6-tagged full-length versions of all four SNAREs were expressed in Escherichia coli and purified by NTA agarose chromatography, followed by tag removal with thrombin and further purification by ion-exchange chromatography. The proteins were reconstituted into proteoliposomes in all possible non-redundant 1:3 and 2:2 combinations (Figure 4).
Figure 4.
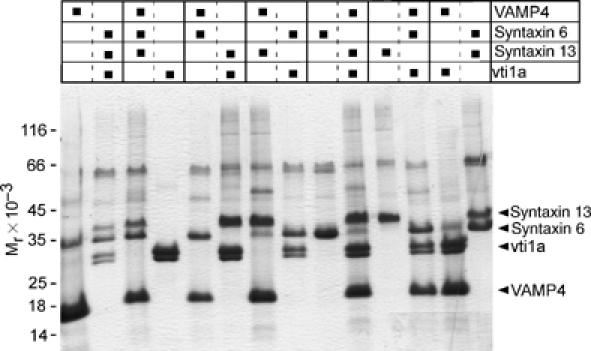
Analysis by tricine–SDS–PAGE of the seven sets of liposomes containing all possible SNARE combinations. The figure shows Coomassie blue staining and includes the sets that were used in fusion assays. A 10 μl measure of each liposome preparation was analyzed.
In the first set of experiments, we used a standard fluorescence dequenching assay to monitor liposome fusion (Hoekstra et al, 1984). In these experiments, donor liposomes containing phosphatidylethanolamine labeled with either rhodamine or with NBD were incubated with an excess amount of unlabeled acceptor liposomes. Upon fusion, the labeled phospholipids are diluted with unlabeled phospholipids, resulting in a greater average distance of the labeled fluorophores and a decrease of fluorescence resonance energy transfer (FRET), associated with an increase of donor (NBD) fluorescence (fluorescence dequenching). Fusion experiments were carried out using sets of liposomes, including all seven possible topologies. As control, the liposomes were preincubated with excess amounts of the respective complementary SNAREs (using variants lacking their transmembrane domains) as competitive inhibitors.
As shown in Figure 5, efficient fusion was observed in five of the seven combinations. In each case, fusion was significantly faster than that observed with neuronal SNAREs (Weber et al, 1998, and own unpublished observations), reaching plateau levels after 10–20 min of incubation. Preincubation with the complementary soluble SNAREs resulted in significant reduction of fusion activity, although fusion was not completely blocked in all cases. Generally, the fusion-competent 1:3 combinations displayed faster fusion kinetics and stronger dequenching signals than the two 2:2 combinations.
Figure 5.
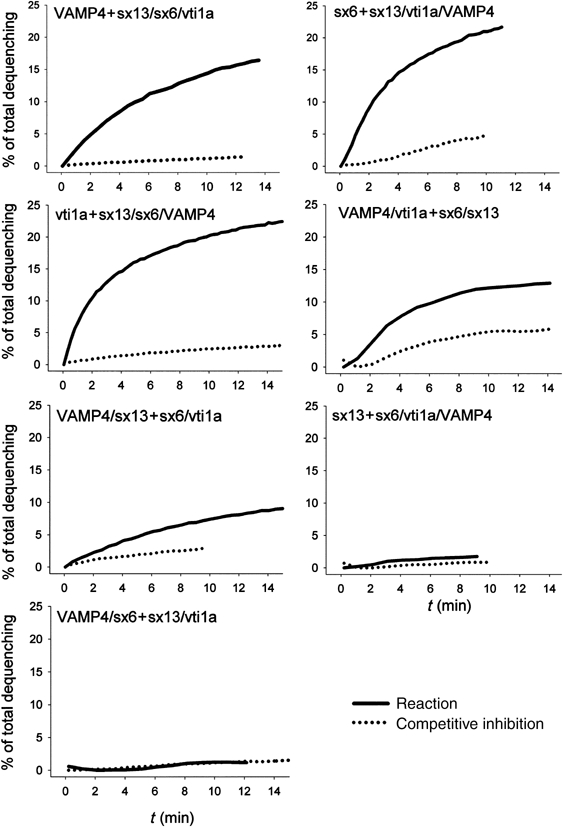
Fusion of liposomes reconstituted with early endosomal SNAREs in all possible topological combinations, measured by fluorescence dequenching. The figure shows exemplary traces of the seven fusion reactions analyzed by fluorescence dequenching. A 5 μl measure of NBD/rhodamine containing donor liposomes was mixed with 35 μl acceptor liposomes and 10 μl buffer (solid line). As control, the acceptor liposomes were preincubated for 1 h at room temperature with 10 μl of donor SNARE variants lacking their transmembrane domains (final concentration 15 μM) as competitive inhibitors (dotted line). Fusion was monitored by increase in NBD (donor) fluorescence. The data were normalized to the fluorescence value measured after adding detergent at the end of the reaction. Fusion experiments in which the NBD/rhodamine label was swapped showed similar results. Measurements were performed at 37°C with an overall protein concentration of 5–15 μM in the liposomes.
To confirm these findings with an independent assay, we have developed a new assay in which each liposome population is labeled with different lipid-anchored fluorescent dye (here Oregon green and Texas red). It is expected that a FRET signal is generated upon fusion, as both dyes are residing in the same membrane.
Using this approach, we prepared dye-labeled donor and acceptor liposomes using the same SNARE combinations as above. Fusion was then measured by recording acceptor fluorescence using donor and acceptor liposomes in a similar concentration range. As shown in the exemplary traces of Figure 6A, a rapid increase of fluorescence was observed. In comparison to the dequenching assay (Figure 5), the kinetics was faster and the plateau was reached sooner, which is probably owing to the fact that the signal is mainly caused by the first fusion reaction, with subsequent rounds of fusion having only small effects on acceptor fluorescence. No significant fluorescence increase was observed when the acceptor liposomes were incubated with the soluble fragment of syntaxin 6 or when acceptor liposomes containing all four SNAREs were used. Furthermore, no fluorescence increase was observed when a combination was used that was non-fusogenic in the dequenching assay (donor liposomes containing syntaxin 13, acceptor liposomes containing syntaxin 6, vti1a, and VAMP4). As shown in Figure 6B, the results obtained with this assay were essentially identical with those obtained with the dequenching assay, with five of the possible seven combinations being fusogenic.
Figure 6.
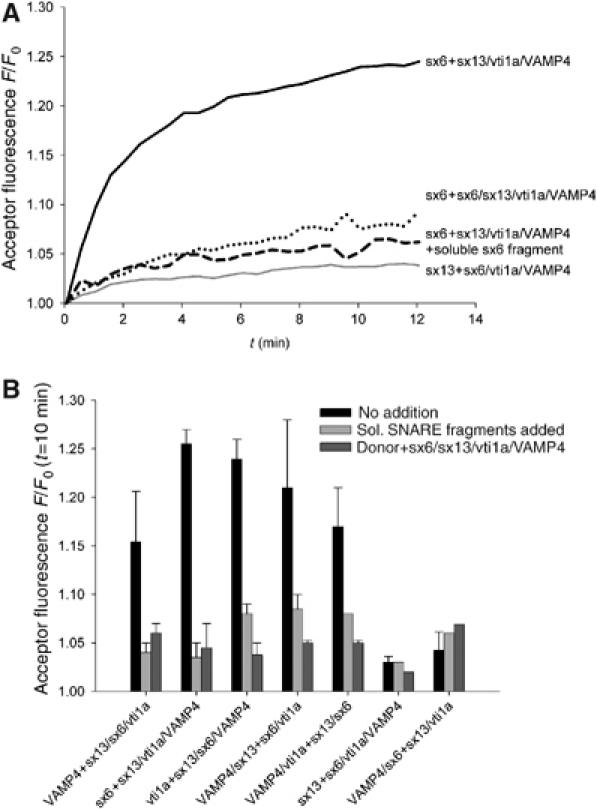
Fusion of liposomes reconstituted with early endosomal SNAREs in all possible topological combinations, measured by a new FRET-based assay. (A) Exemplary traces of fusion reaction using FRET. Phosphatidylethanolamine labeled with either Oregon green or Texas red was incorporated together with the indicated SNAREs into donor and acceptor liposomes, respectively. Fusion is monitored by measuring the increase in acceptor fluorescence upon donor excitation. Controls included preincubation of the acceptor liposomes with soluble syntaxin 6 (see legend to Figure 5), and reconstitution of acceptor liposomes with all four SNAREs in a 1:1:1:1 molar ratio (dashed line). All reactions were carried out at 37°C. Acceptor fluorescence was normalized to the starting value. (B) Five out of seven SNARE combinations mediate liposome fusion. After the end of the experiment, the data were normalized to the starting value of the acceptor fluorescence and the value at t=10 min was used to compare the different reactions represented as bars (black). Control experiments using soluble SNARE fragments or liposomes containing all four SNAREs are shown in light or dark gray. Values are means of 2–5 experiments (±s.e.m. or maximal/minimal value), except for the negative combinations sx13+sx6/vti1a/VAMP4 and VAMP4/sx6+sx13/vti1a, which were measured only once.
Assessment of liposome fusion by fluorescence correlation spectroscopy
All experiments described above use bulk assays that only yield average information about the liposome population. In contrast, confocal fluorescence microscopy allows for detecting and distinguishing individual donor and acceptor liposomes diffusing through the focal area (dimensions ∼200–500 nm). We used fluorescence correlation spectroscopy (FCS) and fluorescence cross-correlation spectroscopy (Magde et al, 1972; Eigen and Rigler, 1994; Schwille, 2001) to analyze liposome solutions from fusion experiments. With these methods, it is possible to determine the average numbers of donor and acceptor liposomes in the focal area, to determine the extent of colocalization of the two types of liposomes (docking/fusion), and to measure particle brightness and diffusion times as a rough estimate of particle size. Simultaneously, the fluorescence lifetime of the donor liposomes can be determined as a measure for FRET, providing an accurate indicator for membrane fusion.
Figure 7A shows cross-correlation curves for three exemplary fusion reactions (all samples were diluted at the end of the reaction). A strong cross-correlation signal (black curve) was observed for the liposome combination vti1a (donor) and syntaxin 13/syntaxin 6/VAMP4 (acceptor). This is expected, as after fusion, both dyes are localized in the same particle. In contrast, no cross-correlation was observed when control liposomes containing all four SNAREs were used as acceptors. Similarly, no cross-correlation was observed when a non-fusogenic set of liposomes was analyzed (donor: syntaxin 13; acceptor: vti1a/syntaxin 6/VAMP4).
Figure 7.
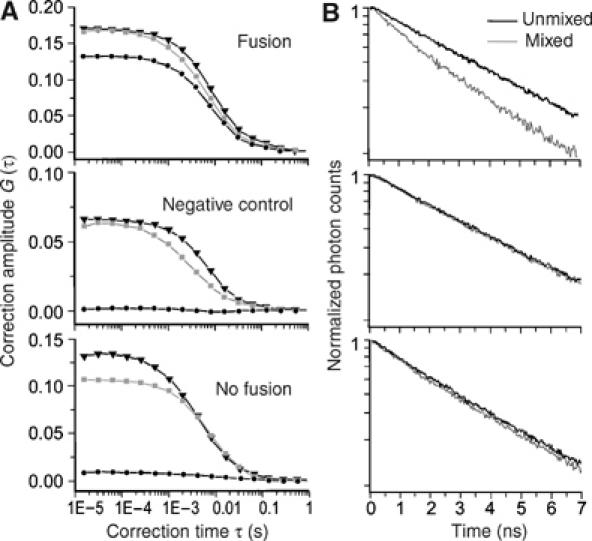
(A) Liposome fusion reactions analyzed by fluorescence cross-correlation spectroscopy. Fusion reactions were carried out as in Figure 6. At the end of the reaction (60 min), the samples were diluted 100-fold. Examples of cross-correlation curves (black lines with circles) and autocorrelation curves of Oregon green- (light gray lines with squares) and Texas red- (gray lines with triangles) labeled liposomes. Top: a cross-correlation signal is present in thecase of the liposome combination vti1a (Oregon green) and syntaxin 6/syntaxin 13/VAMP4 (Texas red). Middle: in contrast, no cross-correlation is observed when control liposomes containing all four SNAREs are used. Bottom: similarly, no cross-correlation is observed with the non-fusogenic combination of Oregon green liposomes containing syntaxin 13 with Texas red liposomes containing vti1a/syntaxin 6/VAMP4. (B) Corresponding measurements of the donor (Orgeon green) fluorescence lifetime decay observed before (black lines) and after (gray lines) mixing of the same liposome populations. The decrease in donor fluorescence lifetime upon fusion is indicated by a steeper slope of the fluorescence decay after mixing (logarithmic plot). Cross-correlation is based on colocalization of donor and acceptor fluorescence dyes, whereas the donor fluorescence lifetime decrease is based on FRET in the case of membrane fusion. Hence, a positive cross-correlation signal lacking a corresponding decrease in the donor fluorescence lifetime would indicate a docking interaction rather than fusion.
Cross-correlation does not distinguish between docking and fusion. For this reason, we determined the fluorescence lifetime of the same single particles. In all fusion reactions, a decrease of lifetime was observed (Figure 7B), excluding the presence of docked but unfused liposome populations.
Next, we determined the degree of cross-correlation for all seven SNARE combinations. Cross-correlation is expressed as the percentage of double-labeled particles with respect to the total number of Texas red-labeled particles, thus allowing for a direct assessment of fusion efficiency. As shown in Figure 8, all of the three fusogenic 1:3 combinations showed high cross-correlation, ranging between 50 and 85%. The exact percentage of fusion efficiency likely depends on how well the liposome population numbers and the protein concentrations in the liposomes were matched. The two fusogenic 2:2 combinations showed colocalization of around 40%, thus reflecting lower fusion efficiencies as already observed in the dequenching assay for these combinations (Figure 5). That, however, was several times higher than the non-fusogenic combinations and the negative controls (all between 5 and 15%). A similar picture was obtained when donor lifetimes were measured. All fusogenic combinations displayed significant lifetime shortening, with the 2:2 combinations again being somewhat lower but significantly above the negative controls. We conclude that five out of seven possible combinations of early endosomal SNAREs efficiently fuse liposomes, and that neither fusion nor docking occurs in the remaining two combinations.
Figure 8.
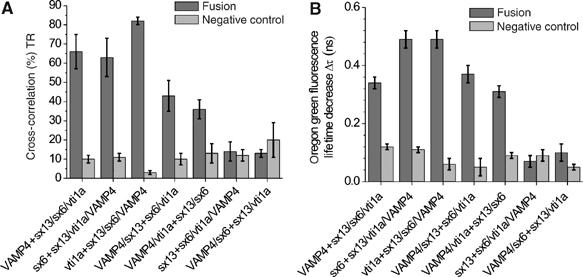
(A) Cross-correlation amplitudes of liposome preparations (dark gray) and negative controls (light gray) obtained with samples corresponding to the FRET measurements shown in Figure 6. Cross-correlation amplitudes higher than about 30% of the autocorrelation amplitudes demonstrate fusion by colocalization of green and red fluorescence in single, fused liposomes. (B) Donor fluorescence lifetime reduction observed after mixing of the liposomes (dark gray) and corresponding negative controls (light gray) simultanesously measured with the cross-correlation-measurements shown in Figure 7A. Cross-correlation measurements can not distinguish docking from fusion, but the simultaneous measurement of the donor fluorescence lifetime reduction allows one to distinguish fused from docked particles.
Discussion
In the present study, we have investigated the structure and the fusogenic properties of four SNAREs involved in the homotypic fusion of early endosomes. Despite limited sequence conservation, the four-helix bundle structure of the early endosomal SNARE complex is highly similar to that of the previously characterized neuronal and late endosomal complexes, lending further support to the view that this core structure is common to all SNARE complexes, and that it defines the structural end point of SNARE-mediated fusion catalysis. Reconstitution into liposomes revealed that five out of seven topological combinations are fusogenic, suggesting that multiple pathways of complex nucleation that all converge on the same terminal structure are possible.
SNAREs are presently considered to constitute the minimal fusion machinery in the secretory pathway. Despite some caveats (Chen et al, 2006; Dennison et al, 2006), fusion of SNARE-containing liposomes is widely being used as read-out for the fusogenic properties of given sets of SNAREs. So far, fusion has only been observed if the liposomes contain one of each SNARE subfamily (QabcR ‘rule'; Weber et al, 1998; Parlati et al, 2000; Paumet et al, 2001; Parlati et al, 2002; Brandhorst et al, 2006), confirming that the formation of the conserved four-helix bundle is an absolute requirement for fusion. SNAREs of the same subclass can substitute for each other to a certain extent, both in in vitro assembly (Fasshauer et al, 1999; Yang et al, 1999) and in liposome fusion (McNew et al, 2000; Brandhorst et al, 2006).
Our data clearly show that fusion catalysis by SNAREs is not limited to only a single topological distribution of the SNAREs between the fusion partners. Both 1:3 and 2:2 combinations are fusogenic, with the latter being slightly less active (see Figures 5 and 8). Preliminary observations on liposome fusion involving late endosomal SNAREs also revealed fusion activity by multiple topologies, although with different combinatorial preferences (D Zwilling and R Jahn, unpublished observations). These findings are in contrast to the fusogenic properties of several sets of yeast SNAREs studied by Rothman and co-workers. For a given set of SNAREs, only a single fusogenic topology was identified, although the fusogenic combinations were not equivalent (Parlati et al, 2000; Parlati et al, 2002; see also Introduction). Although many of the combinations tested in these studies violated the QabcR-rule and thus are not expected to fuse, the experiments included many topologies of given QabcR sets that did not show any fusion activity.
What may be the reason for these differences? It is likely that individual SNARE complexes differ in the nucleation reactions that initiate the formation of trans-complexes. Several lines of evidence suggest that SNARE assembly is not a random process, but proceeds via defined and partially helical intermediates that serve as acceptors for the SNAREs contributed by the donor membrane. Detailed investigations of the neuronal complex revealed that assembly involves a labile Qabc intermediate that then binds the R-SNARE synaptobrevin (Fasshauer and Margittai, 2004). This intermediate readily recruits a second Qa-SNARE, resulting in a ‘dead-end' complex that is primarily responsible for the slow fusion kinetics of liposomes containing neuronal SNAREs (Fasshauer and Margittai, 2004). When the acceptor complex is stabilized, binding of synaptobrevin occurs with subsecond kinetics and liposomes fuse rapidly, reaching plateau levels after 1 min (Pobbati et al, 2006).
Our data now suggest that despite the high structural conservation of SNARE core complexes, the composition of these intermediates may not be conserved, possibly owing to differences in surface interactions between the SNARE helices. These differences are likely to have a major impact on the assembly pathway and to define which topological combinations are fusogenic. In contrast to the neuronal complex, evidence for partial complexes (at least in solution) was obtained for only two combinations of early endosomal SNAREs, and these combinations only partially overlap with those observed for the neuronal complex. Intriguingly, there is no correlation between the ability to form partial complexes in solution and the ability to serve as an acceptor complex in liposome fusion. When the two interacting combinations of early endosomal SNAREs are incorporated into liposomes and incubated with liposomes containing the final complementary SNARE, one of these combinations is fusogenic whereas the other one is not. Also, fusion is observed between combinations for which no evidence for partial complexes was found. It remains to be established whether the non-fusogenic combination forms ‘dead-end' complexes similar to the neuronal complex. Furthermore, other less-stable partial complexes may exist that, however, are either too labile or are associated with structural changes too small to be seen by CD spectroscopy. This could be the case or the fusogenic 2:2 combinations that we observed and the reason why they fuse less efficiently.
What conclusions can be drawn for the function of SNAREs in their native environment? Liposome fusion may be considered as a ‘bare-bones' assay that shows the capability of SNAREs as basic fusion catalysts. SNARE reactivity is probably regulated by accessory proteins, such as SM proteins (Toonen and Verhage, 2003). Such accessory proteins may regulate nucleation of SNARE complexes, restricting the fusogenic topologies in native membranes. However, it may be of biological advantage if SNAREs involved in homotypic fusions have greater flexibility than those involved in heterotypic fusion events. Early endosomes are a highly dynamic compartment that receive vesicles from different intracellular locations. If only a single topology of SNAREs would be fusogenic, it would require high fidelity in SNARE sorting and recycling. This is less of a problem for heterotypic fusion events, such as fusion of ER-derived vesicles with the Golgi, or fusion of post-Golgi vesicles with the plasma membrane, where both the source and destination compartments are stable and perhaps better capable of maintaining a defined SNARE composition.
Materials and methods
Molecular cloning and recombinant proteins
All full-length constructs for syntaxin 6, syntaxin 13, vti1a, and VAMP4 were generated as described (Brandhorst et al, 2006). The full-length DNA constructs were used as templates for the amplification of the SNARE core fragments by PCR. The core fragment syntaxin 6 169–232 was amplified using the oligonucleotides 5′aaaggatccatgcaggatgagcagttgg3′, and 5′tattttaagcttttattggcgccgatcactgg3′. The core fragment of syntaxin 13 182–250 was amplified using the primers 5′aacttattcatatgagggaaacg3′ and 5′atactcgagcacatcttcttgcgag3′. The vti1a core fragment 115–192 was amplified using the oligonucleotides 5′gggaattccatatgagggcacatctgctggata acacgg3′ and 5′aaagaagctttcagcggttttggatgattcttc g3′. VAMP4 47–117 was provided by Dr W Antonin. All constructs were subcloned into the pET28a vector. Each clone was verified by DNA sequencing
Recombinant proteins were expressed as His6-tagged or GST-tagged fusion proteins and purified by Ni2+-agarose or glutathione–Sepharose, respectively. The tags of all proteins were removed by using thrombin cleavage. All proteins were further purified by ion-exchange chromatography. All proteins were 95% pure, as judged by SDS–PAGE and Coomassie blue staining.
Assembly of the early endosomal SNARE complex
Assembly was performed as described (Antonin et al, 2002). The core fragments of VAMP4, syntaxin 6, syntaxin 13, and vti1a were mixed in a 1:1:1:1 molar ratio with a total amount of approximately 20 mg protein in 20 mM Tris–HCl, pH 7.4, 500 mM NaCl, 1 mM EDTA, and 1 mM DTT in an approximate volume of 5 ml. The mixture was then dialyzed overnight in 20 mM Tris–HCl buffer, pH 7.4, with 1 mM EDTA, 1 mM DTT, and 1 M NaCl. The buffer was then changed to 20 mM Tris–HCl buffer, pH 7.4, with 100 mM NaCl and 2 M urea. After dialysis, the complex was purified using ion-exchange chromatography (MonoQ) and the peak fractions were analyzed by SDS–PAGE.
Circular dichroism spectroscopy
CD spectroscopy was performed as described (Fasshauer et al, 1999). Spectra were obtained by measuring the purified complex at a concentration of 15 μM in a buffer containing 20 mM Tris–HCl (pH 7.4) and 1000 mM NaCl. For the thermal melt experiment, the wavelength was set to 220 nm and the temperature to 4°C. Then the measurement was started by gradually increasing the temperature to 95°C at a rate of 60°C/h. Subsequently, the temperature was again lowered to 4°C at a rate of −60°C/h. Double and triple combinations were investigated by mixing each core fragment to a final concentration of 5 μM in 300 μl buffer containing 20 mM Tris–HCl (pH 7.4) and 1000 mM NaCl.
Crystallization, diffraction data collection, structure solution, and refinement
The early endosomal SNARE complex was prepared in 20 mM Tris–HCl, pH 7.4, 500 mM NaCl, 1 mM EDTA, and 1 mM DTT at a concentration of 6 mg/ml. Crystallization trials were conducted at room temperature and 4°C in sitting drop vapor diffusion format. Initial screens made use of commercial reservoir collections (Crystal Screen 1 and 2, Crystal Screen Cryo, PEG/Ion Screen, and Grid Screens from Hampton Research) and automated dispensing of 200 nl drops (100 nl protein plus 100 nl reservoir) in 96-well trays. Initial conditions producing micro-crystals were subsequently optimized manually (2 μl protein plus 2 μl reservoir drops) by systematic variation of chemical components in 24-well trays. Thin crystal plates were ultimately obtained with a reservoir solution of 0.1 M trisodium citrate dihydrate, pH 5.6, 36% (v/v) 2-methyl-2,4-pentandiol, and 0.2 M Li2SO4 at room temperature.
Crystals were flash frozen in liquid nitrogen without additional cryo-protection. Diffraction data were collected at 100 K at the PXII beamline of the Swiss Light Source (Villigen, Switzerland) on a MarResearch CCD detector. Data from five crystals were combined to arrive at a complete data set. Diffraction data were processed with the HKL package (Otwinowski and Minor, 1996). Crystals diffracted slightly anisotropically, yielding incomplete data between 2.7 and 2.5 Å resolution. We conservatively estimated the effective resolution of the structure to be 2.7 Å.
The structure of the complex was solved by molecular replacement (Vagin and Teplyakov, 2000) using the late endosomal SNARE complex (PDB entry 1GL2) (Antonin et al, 2002) as the search model. After initial rigid body and positional refinement with CNS (Brunger et al, 1998), the protein sequences were adjusted by manual model building with MAIN (www-bmb.ijs.si/doc/index.html). Refinement was completed by alternating between refinement cycles (simulated annealing, positional and B-factor refinement) and manual inspection. In the final stages of refinement, water oxygen were manually positioned into vacant spherical peaks of the Fo−Fc difference electron density map. All reflections without intensity cutoff were used in the refinement, including incomplete data between 2.7 and 2.5 Å resolution. During all refinement steps, 5% of the reflections were set aside for monitoring of the Rfree factor. Refinement converged at an Rwork of 24.7% and an Rfree of 28.9%, maintaining good stereochemistry (Supplementary Table 1). Coordinates and structure factors have been submitted to the RSCB Protein Databank (http://www.rcsb.org/pdb/) under accession code 2NPS and will be released upon publication.
Liposome preparation and fusion assays
All unlabeled and labeled phospholipids were obtained from Avanti Polar Lipids (Alabaster, AL, USA). For the fluorescence dequenching assay (Hoekstra et al, 1984), liposome preparation and liposome fusion assays were performed as described (Schuette et al, 2004), except that the Hepes buffer contained 1 M KCl (HB 1000). Further purification of liposomes on Nycodenz gradients was omitted. A 5 μl volume of the NBD/rhodamine liposomes was mixed with 35 μl of acceptor liposomes and 10 μl HB1000 or recombinant soluble protein (total volume=50 μl). Preincubation with recombinant protein was carried out at room temperature for 1 h. (Antonin et al, 2002 in order to show that fusion is SNARE-mediated, soluble SNARE fragments were added as competitive inhibitors. Fusion is inhibited by building cis-SNARE complexes on the liposome surface and inhibition is most efficient with a 1 h preincubation at room temperature.)
For measuring fusion by FRET, the lipid mixes contained either 1.5% Oregon green-labeled or Texas red-labeled phosphatidylethanolamine. Liposome preparation was as described (Schuette et al, 2004), except that liposomes were generated on a SMART system Pharmacia Biotech (μ Separation unit, μ Precision pump, μ Peak monitor) using a fast desalting column PC 3.2/10. Fusion experiments were carried out by mixing 20 μl of each liposome population, adding 10 μl of HB 1000 or recombinant soluble protein as competitive inhibitor. For the FCS measurements, the liposome particle number was adjusted to 1:1. All fusion experiments were carried out at 37°C.
Two-photon fluorescence cross-correlation spectroscopy
The confocal fluorescence correlation setup has been described previously (Pohl et al, 2006). For cross-correlation analysis, the detection path has been extended by a dichroic mirror (590DCXR, AHF Analysentechnik, Tübingen), a second APD (avalanche photodiode, AQR-13, Perkin Elmer, Dumberry, Canada), and two band pass spectral filters (HQ535/50 and HQ645/70, AHF Analysentechnik, Tübingen) to separate the fluorescence originating from Oregon green- and Texas red-labeled liposomes, respectively (Schwille, 2001). Photons detected by both APDs were simultaneously counted by a single photon counter (Time Harp 200, Picoquant GmbH, Berlin) using a rooter (PRT400, Picoquant GmbH, Berlin), and analyzed by homebuilt software. Pulsed two-photon excitation was provided by a homebuilt titanium–sapphire laser (800 nm, 90 MHz, 100 fs FWHM), which allowed for measuring simultaneously the fluorescence lifetime of the fluorescent liposomes diffusing through the focus of the confocal microscope setup.
For the measurements, the liposome preparations were diluted to a concentration corresponding to about 5–20 particles in the focus (∼10 nM) in a way that the ratio of the particle numbers of Oregon green and Texas red liposomes was close to 1. Five droplets of 50 μl of each sample were measured three times for 30 s.
Other methods
SDS–PAGE was performed as described (Laemmli, 1970). For the tricine variant of SDS–PAGE, we followed the procedure of Schagger and von Jagow (1987). Protein determination was performed according to Bradford (1976).
Supplementary Material
Supplemental Data
Acknowledgments
We thank Ursel Ries for expert technical assistance. DZ acknowledges the support of the International Masters/PhD Program (IMPRS) ‘Molecular Biology'. This work was supported in part by grants from the Deutsche Forschungsgemeinschaft to PJW (Emmy-Noether Program) and to RJ (SFB 523, TP B6) and by grants of the Fonds der chemischen Industrie to PJW and RJ
References
- Antonin W, Fasshauer D, Becker S, Jahn R, Schneider TR (2002) Crystal structure of the endosomal SNARE complex reveals common structural principles of all SNAREs. Nat Struct Biol 9: 107–111 [DOI] [PubMed] [Google Scholar]
- Antonin W, Holroyd C, Fasshauer D, Pabst S, Fischer von Mollard G, Jahn R (2000) A SNARE complex mediating fusion of late endosomes defines conserved properties of SNARE structure and function. EMBO J 19: 6453–6464 [DOI] [PMC free article] [PubMed] [Google Scholar]
- Bock JB, Matern HT, Peden AA, Scheller RH (2001) A genomic perspective on membrane compartment organization. Nature 409: 839–841 [DOI] [PubMed] [Google Scholar]
- Bradford MM (1976) A rapid and sensitve method for the quantitation of microgram quantities of protein utilizing the principle of protein–dye binding. Anal Biochem 72: 248–254 [DOI] [PubMed] [Google Scholar]
- Brandhorst D, Zwilling D, Rizzoli SO, Lippert U, Lang T, Jahn R (2006) Homotypic fusion of early endosomes: SNAREs do not determine fusion specificity. Proc Natl Acad Sci USA 103: 2701–2706 [DOI] [PMC free article] [PubMed] [Google Scholar]
- Brunger AT, Adams PD, Clore GM, DeLano WL, Gros P, Grosse-Kunstleve RW, Jiang JS, Kuszewski J, Nilges M, Pannu NS, Read RJ, Rice LM, Simonson T, Warren GL (1998) Crystallography & NMR system: A new software suite for macromolecular structure determination. Acta Crystallogr D 54: 905–921 [DOI] [PubMed] [Google Scholar]
- Chen X, Arac D, Wang TM, Gilpin CJ, Zimmerberg J, Rizo J (2006) SNARE-mediated lipid mixing depends on the physical state of the vesicles. Biophys J 90: 2062–2074 [DOI] [PMC free article] [PubMed] [Google Scholar]
- Dennison SM, Bowen ME, Brunger AT, Lentz B (2006) Neuronal SNAREs do not trigger fusion between synthetic membranes but do promote PEG-mediated membrane fusion. Biophys J 90: 1661–1675 [DOI] [PMC free article] [PubMed] [Google Scholar]
- Eigen M, Rigler R (1994) Sorting single molecules: application to diagnostics and evolutionary biotechnology. Proc Natl Acad Sci USA 91: 5740–5747 [DOI] [PMC free article] [PubMed] [Google Scholar]
- Ernst JA, Brunger AT (2003a) High resolution structure, stability, and synaptotagmin binding of a truncated neuronal SNARE complex. J Biol Chem 278: 8630–8636 [DOI] [PubMed] [Google Scholar]
- Ernst JA, Brunger AT (2003b) High resolution structure, stability, and synaptotagmin binding of a truncated neuronal SNARE complex. J Biol Chem 278: 8630–8636 [DOI] [PubMed] [Google Scholar]
- Fasshauer D, Margittai M (2004) A transient N-terminal interaction of SNAP-25 and syntaxin nucleates SNARE assembly. J Biol Chem 279: 7613–7621 [DOI] [PubMed] [Google Scholar]
- Fasshauer D, Antonin W, Margittai M, Pabst S, Jahn R (1999) Mixed and non-cognate SNARE complexes. Characterization of assembly and biophysical properties. J Biol Chem 274: 15440–15446 [DOI] [PubMed] [Google Scholar]
- Fasshauer D, Antonin W, Subramaniam V, Jahn R (2002) SNARE assembly and disassembly exhibit a pronounced hysteresis. Nat Struct Biol 9: 144–151 [DOI] [PubMed] [Google Scholar]
- Fasshauer D, Eliason WK, Brunger AT, Jahn R (1998a) Identification of a minimal core of the synaptic SNARE complex sufficient for reversible assembly and disassembly. Biochemistry 37: 10354–10362 [DOI] [PubMed] [Google Scholar]
- Fasshauer D, Sutton RB, Brunger AT, Jahn R (1998b) Conserved structural features of the synaptic fusion complex: SNARE proteins reclassified as Q- and R-SNAREs. Proc Natl Acad Sci USA 95: 15781–15786 [DOI] [PMC free article] [PubMed] [Google Scholar]
- Hayashi T, McMahon HT, Yamasaki S, Binz T, Hata Y, Südhof TC, Niemann H (1994) Synaptic vesicle membrane fusion complex: action of clostridial neurotoxins on assembly. EMBO J 13: 5051–5061 [DOI] [PMC free article] [PubMed] [Google Scholar]
- Hoekstra D, de Boer T, Klappe K, Winschut J (1984) Fluorescence method for measuring the kinetics of fusion between biological membranes. Biochemistry 23: 5675–5681 [DOI] [PubMed] [Google Scholar]
- Hong W (2005) SNAREs and traffic. Biochim Biophys Acta 1744: 120–144 [DOI] [PubMed] [Google Scholar]
- Jahn R, Scheller RH (2006) SNAREs—engines for membrane fusion. Nat Rev Mol Cell Biol 7: 631–643 [DOI] [PubMed] [Google Scholar]
- Laemmli UK (1970) Cleavage of structural proteins during the assembly of the head of bacteriophage T4. Nature 227: 680–685 [DOI] [PubMed] [Google Scholar]
- Magde D, Elson E, Webb WW (1972) Thermodynamic fluctuations in a reacting system–measurement by fluorescence correlation spectroscopy. Phys Rev Lett 29: 705–708 [Google Scholar]
- Maxfield FR, McGraw TE (2004) Endocytic recycling. Nat Rev Mol Cell Biol 5: 121–132 [DOI] [PubMed] [Google Scholar]
- McNew JA, Parlati F, Fukuda R, Johnston RJ, Paz K, Paumet F, Söllner TH, Rothman JE (2000) Compartmental specificity of cellular membrane fusion encoded in SNARE proteins. Nature 407: 153–159 [DOI] [PubMed] [Google Scholar]
- Otwinowski Z, Minor W (1996) Processing of X-ray diffraction data collected in oscillation mode. Methods Enzymol 276: 307–326 [DOI] [PubMed] [Google Scholar]
- Parlati F, McNew JA, Fukuda R, Miller R, Söllner TH, Rothman JE (2000) Topological restriction of SNARE-dependent membrane fusion. Nature 407: 194–198 [DOI] [PubMed] [Google Scholar]
- Parlati F, Varlamov O, Paz K, McNew JA, Hurtado D, Söllner TH, Rothman JE (2002) Distinct SNARE complexes mediating membrane fusion in Golgi transport based on combinatorial specificity. Proc Natl Acad Sci USA 99: 5424–5429 [DOI] [PMC free article] [PubMed] [Google Scholar]
- Paumet F, Brugger B, Parlati F, McNew JA, Söllner TH, Rothman JE (2001) A t-SNARE of the endocytic pathway must be activated for fusion. J Cell Biol 155: 961–968 [DOI] [PMC free article] [PubMed] [Google Scholar]
- Pobbati AV, Stein A, Fasshauer D (2006) N- to C-terminal SNARE complex assembly promotes rapid membrane fusion. Science 313: 673–676 [DOI] [PubMed] [Google Scholar]
- Pohl WH, Hellmuth H, Hilbert M, Seibel J, Walla PJ (2006) A two-photon fluorescence-correlation study of lectins interacting with carbohydrated 20 nm beads. Chembiochem 7: 268–274 [DOI] [PubMed] [Google Scholar]
- Schagger H, von Jagow G (1987) Tricine-sodium dodecyl sulfate–polyacrylamide gel electrophoresis for the separation of proteins in the range from 1 to 100 kDa. Anal Biochem 166: 368–379 [DOI] [PubMed] [Google Scholar]
- Schuette CG, Hatsuzawa K, Margittai M, Stein A, Riedel D, Küster P, König M, Seidel C, Jahn R (2004) Determinants of liposome fusion mediated by synaptic SNARE proteins. Proc Natl Acad Sci USA 101: 2858–2863 [DOI] [PMC free article] [PubMed] [Google Scholar]
- Schwille P (2001) Cross-correlation analysis in FCS. In: Rigler R, Elson EL (eds), Fluorescence Correlation Spectroscopy: Theory and Application, pp 360–378. Springer: Heidelberg [Google Scholar]
- Sutton B, Fasshauer D, Jahn R, Brünger AT (1998a) Crystal structure of a core synaptic fusion complex at 2.4 Å resolution. Nature 395: 347–353 [DOI] [PubMed] [Google Scholar]
- Sutton RB, Fasshauer D, Jahn R, Brunger AT (1998b) Crystal structure of a SNARE complex involved in synaptic exocytosis at 2.4 A resolution. Nature 395: 347–353 [DOI] [PubMed] [Google Scholar]
- Toonen RF, Verhage M (2003) Vesicle trafficking: pleasure and pain from SM genes. Trends Cell Biol 13: 177–186 [DOI] [PubMed] [Google Scholar]
- Vagin A, Teplyakov A (2000) An approach to multi-copy search in molecular replacement. Acta Crystallogr D 56: 1622–1624 [DOI] [PubMed] [Google Scholar]
- Weber T, Zemelman BV, McNew JA, Westermann B, Gmachl M, Parlati F, Söllner TH, Rothman JE (1998) SNAREpins: minimal machinery for membrane fusion. Cell 92: 759–772 [DOI] [PubMed] [Google Scholar]
- Weimbs T, Mostov KE, Low SH, Hofmann K (1998) A model for structural similarity between different SNARE complexes based on sequence relationships. Trends Cell Biol 8: 260–262 [DOI] [PubMed] [Google Scholar]
- Yang B, Gonzalez L Jr, Prekeris R, Steegmaier M, Advani RJ, Scheller RH (1999) SNARE interactions are not selective. Implications for membrane fusion specificity. J Biol Chem 274: 5649–5653 [DOI] [PubMed] [Google Scholar]
Associated Data
This section collects any data citations, data availability statements, or supplementary materials included in this article.
Supplementary Materials
Supplemental Data