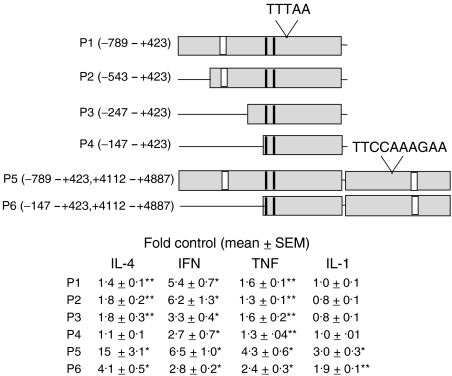
Figure 8.
Effect of cytokines on reporter gene expression using pIgR promoter sequences. The diagram represents pIgR promoter sequences that were linked to the reporter gene for SEAP. Included in the diagram are the TATA box (TTTAA), the STAT6 site (TTCCAAAGAA) in intron 1, identified κB sites (white boxes), and identified interferon-stimulated response elements (ISREs, black boxes). HT29 cells were transfected with the indicated plasmid (P1-P6) as described in Materials and Methods and then treated for 48 hr without and with cytokine: IL-4, TNF-α, and IL-1β, each 10 ng/ml; IFN-γ, 200 U/ml. SEAP activity was then measured in the medium and data are expressed as fold control where the controls were unstimulated cells. Values represent the mean ± SEM for combined data from multiple experiments with quadruplicate samples in each experiment (n ≥ 12). A significant increase was observed with some cytokine treatments relative to controls; *P < 0.001, **P < 0.05.

