Abstract
How the mucosal immune system promotes active immunity against harmful organisms but tolerance to commensal bacteria or dietary antigens is poorly understood. Thus, the antigen-presenting cell (APC), site of antigen presentation, and effector mechanisms responsible for oral priming and tolerance remain unclear. Characterizing differences between oral priming and tolerance may improve the exploitation of oral tolerance for therapeutic applications and aid the design of oral vaccines. To address these questions we compared the mucosal and systemic activation and localization of antigen-specific T cells during the induction of oral priming and tolerance. Activation marker expression and cell division by tg T cells was determined in conjunction with their anatomical location. These studies show that after feeding, T cells are activated in both peripheral and local lymphoid tissues within 6 hr, irrespective of the presence of adjuvant. Subsequently, T-cell accumulation can be detected simultaneously in peripheral and mesenteric lymph nodes and Peyer's patches within 24 hr of feeding, but only after 3 days post feeding in the lamina propria. Primed and tolerized T cells adopted similar phenotypes as assessed by activation marker expression. However, within the mesenteric lymph nodes (MLN) tolerized T cells underwent significantly fewer divisions than primed T cells. Thus, T-cell activation and expansion occurs throughout the animal after feeding a range of doses of antigen, irrespective of whether priming or tolerance is the eventual outcome. However, the presence of an adjuvant enhances clonal expansion in the MLN while tolerized T cells display defective cell division.
Introduction
Oral administration of antigen can result in local and systemic priming or tolerance1–7 and has therefore been proposed as both a desirable route of vaccination and a potential therapy for autoimmune diseases.8 The basis of the dichotomy in mucosal immune responsiveness remains elusive but may reflect differences in the interactions between antigen-presenting cells (APC) and T cells resulting from variation in the anatomical location, phenotype and activation state of the APC population. Several possibilities exist regarding the anatomical location of antigen presentation and T-cell activation after oral administration of antigen, including movement of antigen-laden APC or activated T cells from the gut to peripheral tissues, distribution of antigen throughout the periphery with subsequent presentation and T-cell activation or a combination of both. Furthermore, whether the sequence of events differs between mucosal priming and tolerance is not clear.
In an attempt to define any differences which may exist in the localization of APC–T-cell interaction and T-cell activation between oral priming and tolerance, we have employed the adoptive transfer system first described by Kearney et al.9 This and similar systems have recently been used by a number of groups to investigate oral tolerance but these studies have yielded conflicting results, with some suggesting that responses to orally administered antigens are initiated locally in the gut and then disseminate,10–13 while another proposed simultaneous activation of antigen-specific T cells throughout the animal after feeding.14 Furthermore, these studies did not compare mucosal tolerance and priming and therefore cannot distinguish whether the changes observed are unique to tolerance.
In order to clarify these important inconsistencies and to determine the location of antigen presentation in oral priming and tolerance we have compared the response to the same antigen (ovalbumin; OVA) fed in the presence or absence of the mucosal adjuvant cholera toxin (CT). We have examined clonal expansion, cell division, activation and memory markers and have also directly visualized the location of antigen-specific T-cell receptor (TCR) tg T cells using immunohistochemistry. These studies have demonstrated that after transfer of OVA-specific DO11.10 TCR tg T cells into a naïve recipient, oral administration of a range of doses of antigen results in activation and antigen-specific clonal expansion of T cells simultaneously in the mucosal and systemic lymphoid tissue and that the kinetics of the responses and the phenotype of the T cells produced are similar in the presence or absence of adjuvant. However, in the mesenteric lymph nodes (MLN) the presence of a mucosal adjuvant enhanced clonal expansion whereas tolerized T cells underwent fewer cell divisions than primed T cells.
Materials and Methods
Animals
C57BL/6 (H-2b/b) and BALB/c × C57BL/6 F1 (H-2d/b) mice were purchased from Harlan-Olac (Bicester, UK). Mice homozygous for the cOVA peptide323–339/I-Ad-specific DO11.10 TCR transgenes on the BALB/c background15 were crossed to C57BL/6 mice to produce animals on an F1 background which were used as donors. Six-week-old, male C57BL/6 × BALB/c F1 mice were used as recipients. All animals were specified pathogen free and were maintained under standard animal house conditions in accordance with Home Office regulations.
Preparation of cell suspensions for adoptive transfer
Peripheral lymph nodes (axillary, inguinal, cervical) (PLN), MLN and spleens from DO11.10 F1 mice were pooled and forced through Nitex mesh (Cadisch Precision Meshes, London, UK) using a syringe plunger. Suspensions were washed in RPMI-1640 (Gibco BRL, Paisley, UK). The CD4+ KJ1.26+ T-cell percentage was determined by flow cytometric analysis as described below. tg T cells (1–6 × 10⁶) were injected intravenously (i.v.) into age- and sex-matched BALB/c × C57BL/6 F1 recipients as described previously.16
Carboxyfluorescein diacetate, succinimidyl ester (CFSE) labelling of tg lymphocytes
Cell suspensions were prepared as described as above before being washed 2× in Hanks balanced salt solution (HBSS; Sigma, Poole, UK) and resuspended at a concentration of 5 × 10⁷ lymphocytes/ml. Cells were then incubated with 5 µm (5(6)-CFSE (Molecular Probes Inc., Eugene, OR) for 10 min at 37°. Cells were washed in HBSS then complete medium (RPMI-1640, 10% fetal calf serum (FCS), 2 mm l-glutamine, 100 U/ml penicillin, 100 mg/ml streptomycin, 1·25 mg/ml Fungizone (all Gibco BRL)) before resuspending at 2–5 × 10⁶ tg cells/adoptive transfer.
Antigen administration
Chicken OVA (fraction V) and CT were obtained from Sigma. After adoptive transfer, recipient mice were exposed to antigen by feeding phosphate-buffered saline (PBS), 10 mg, 25 mg, or 100 mg OVA, or 100 mg OVA with 20 µg CT (Sigma) (OVA/CT) or by subcutaneous (s.c.) injection with 100 µg OVA in 100 µl saline/50% complete Freund's adjuvant (OVA/CFA; Sigma). Heat-aggregated OVA (HAO) was prepared and administered as described previously.17
Assessment of antigen-specific delayed type hypersensitivity (DTH) responses in vivo
Mice were fed PBS, 100 mg OVA or 100 mg OVA plus 20 µg CT 24 hr post transfer. Nine to 10 days later mice were injected s.c. with 100 µg OVA in 50 µl saline/50% CFA in one rear footpad. 21 days later the thickness of the rear unimmunized footpad was determined before being injected with 100 µg HAO in 50 µl saline. Subsequent footpad measurements were taken 24 and 48 hr post injection as described previously.17
Flow cytometry
PLN, MLN and Peyer's patches (PP) were harvested between days 1 and 19 after antigen exposure. Cell suspensions were prepared as described above. Aliquots of cells were incubated with FcR blocking buffer (anti-CD16/32 hybridoma supernatant, 10% mouse serum (Diagnostic Scotland, Edinburgh, UK) and 0·1% sodium azide (Sigma)) for 10 min at 4° to prevent binding of antibody to cells via Fc regions.
For two-colour staining detection of CD4+ tg T cells, cells were incubated with phycoerythrin (PE) conjugated anti-CD4 (BD Pharmingen, Oxford, UK) and biotinylated clonotypic anti-TCR antibody, KJ1.26, for 40 min at 4°. Cells were washed in fluorescence-activated cell sorting (FACS) buffer (PBS, 2% FCS and 0·05% sodium azide) then incubated with fluorescein isothiocyanate (FITC) conjugated streptavidin (BD Pharmingen) for 40 min at 4°. For three-colour staining cells were incubated with Peridinin chlorophyll protein (PerCP) conjugated anti-CD4, biotinylated KJ1.26 and FITC-conjugated isotype control, anti-CD69 or anti-CD45RB (all BD Pharmingen) for 40 min at 4°. Cells were washed in FACS buffer, then incubated with PE-conjugated streptavidin (BD Pharmingen) for 40 min at 4°. After a wash in FACS buffer, cells were resuspended in FACS flow (Becton Dickinson) for analysis with a FACScan and CELLQuest software (BD Pharmingen). Two-colour analysis was performed on 20 000 events. The CD45RB, CD62L, CD69 and CFSE data was assessed using three-colour analysis on 1000–2000 KJ1.26+ CD4+ cells.
Enzyme-linked immunosorbent assays (ELISA)
To detect anti-OVA antibodies in serum, Immulon 2 plates (Costar, New York, NY) were coated with OVA then blocked with PBS–10% FCS for 1 hr at 37°. Serum samples were added for 3 hr at 37° before incubation with biotinylated anti-immunoglobulin G2a (IgG2a; BD Pharmingen) or biotinylated anti-IgG1 (Serotec, Oxford, UK), for 1 hr at 37°. Plates were then incubated with extravidin-peroxidase (1/1000; Sigma) for 1 hr at 37°. TMB Microwell Peroxidase Substrate (Kirkegaard and Perry Laboratories, Gaithersburg, MD) was added to detect enzymatic activity as described previously.20
Immunohistochemistry
PLN, MLN, PP and LP were frozen in liquid nitrogen in OCT embedding medium (Miles Inc. Diagnostic Division, Elkart, IN) and stored at −70°. 6–10 µm sections were cut then stored at −20°. For staining sections were incubated in acetone for 10 min, air dried and rehydrated with PBS before incubation in 0·1% azide/3% H2O2 for 45 min Avidin solution (Vector, Burlingame, CA) was added for 15 min then biotin solution (Vector) was added and finally Fc block for 30 min Sections were washed in PBS after each treatment.
Single staining for the DO11.10 TCR
To detect tg T cells, sections were stained with 1/1600 KJ1.26 in TNB (0·1 m Tris–HCl pH 7·5, 0·15 m NaCl, 0·5% blocking reagent (NEN Life Science, Boston, MA)) for 30 min, before being washed in 2× in TNT (0·1 m Tris–HCl pH 7·5, 0·15 m NaCl, 0·05% Tween). Subsequently, sections were incubated with streptavidin–horseradish peroxidase (SA–HRP; 1/100 in TNB block; NEN Life Science) for 30 min before washing as before. Biotinyl-tyramide (1/50 in TNB; NEN Life Science) was then added for 10 min, followed by two washes in TNT. SA–HRP was added again for 30 min before washing 2× in TNT. Enzymatic activity was detected with 3,3′-diaminobenzidine (DAB) substrate (Vector) before washing in H2O, followed by incubation with DAB enhancing solution (Vector) for approximately 10 s and a wash in H2O. Harris haematoxylin (Vector) was used to counterstain before rinsing in H2O and dipping in acid alcohol, tap water, bicarbonate then tap water. Sections were subsequently exposed to 70% ethanol, 95% ethanol 2×, then 100% ethanol for dehydration before clearing in Histoclear (BS & S Ltd, Edinburgh, UK) and immediate mounting in Histomount (BS & S Ltd).
Double staining tg T cells and B-cell areas
B-cell areas were detected on sections by incubation with biotinylated B220 (BD Pharmingen) for 30 min Sections were then washed 3× in PBS, before being incubated with ABC-alkaline phosphatase (Vector) for 30 min PBS was used to wash the sections 3× before incubation in the alkaline phosphatase substrate 5-bromo-4-chloro-3-indolyl phosphate (BCIP)/nitroblue tetrazolium (NBT)/Tris–HCl pH 9·5 (Vector) for 45 min. Tg T cells were detected on B220-stained sections as described above, however, no counterstain was used.
Statistics
Results are expressed as mean±SEM or mean+range. To test significance Student's unpaired t-tests were performed, a P-value of ≤ 0·05 was regarded as significant.
Results
A single feed of antigen results in oral priming or tolerance
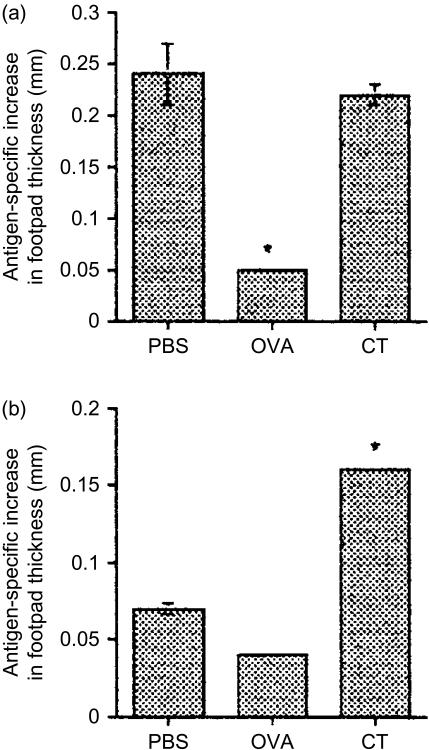
To assess priming and tolerance induction, adoptively transferred mice were fed PBS, OVA or OVA/CT. 14 days later mice were immunized with OVA/CFA s.c. before being challenged with HAO a further 21 days later. HAO induced footpad swelling was recorded 24 and 48 hr after HAO challenge. As can be seen in Fig. 1(a) and 24 hr after exposure to HAO, OVA fed animals were tolerant as they failed to mount a DTH response to challenge in comparison with PBS-fed animals which displayed a significant increase in footpad thickness. OVA/CT fed animals mounted a significantly higher DTH response than the OVA fed group. Furthermore, while the response of animals fed OVA/CT was not enhanced compared to PBS fed controls at 24 hr after challenge it remained significantly enhanced compared with the OVA fed group at 48 hr, whereas the PBS response was not (Fig. 1b), indicating that OVA/CT animals were primed.
Figure 1.
(a) Single feed of antigen can enhance or suppress systemic responses to subsequent challenge. KJ1.26+ CD4+ T cells (2·0–3·0 × 106) were transferred into naïve recipients 1 day before feeding with PBS, 100 mg OVA or 100 mg OVA + 20 µg CT (OVA/CT). 10 days later animals were injected s.c. with 100 µg OVA/CFA. 21 days after challenge footpads were measured before animals received HAO in the contralateral footpad. Subsequent footpad swelling was documented 24 hr (a) and 48 hr (b) later. Results represent four to five animals per group and are presented as the mean antigen-specific increase in footpad thickness ±SEM. Similar results were obtained in 1 further experiment (*P≤0·05).
Localization and persistence of antigen-specific CD4+ T cells after antigen exposure: clonal expansion
Antigen-specific T-cell responses were assessed using the clonotypic anti-TCR antibody KJ1.26 in adoptively transferred mice. All groups exposed to antigen displayed accumulation of antigen-specific T cells in PLN (Fig. 2a) and/or MLN (Fig. 2b). The proportion of antigen-specific T cells in each tissue showed regional differences for each experimental group. Mice fed OVA or OVA/CT showed a large increase in KJ1.26+ CD4+ T cells in the MLN and a small increase in PLN. Of the time points examined, the peak in clonal expansion occurred in both tissues 3 days after feeding and declined thereafter, suggesting that antigen-driven clonal expansion occurs simultaneously in the local and peripheral tissues after feeding and that CT does not affect the early kinetics of T cell accumulation in either location. Animals fed OVA/CT appeared to show greater antigen-specific T-cell accumulation in the MLN, though not in the PLN, on day 3 than those fed OVA alone. Thus, the use of an adjuvant appeared to enhance the accumulation of antigen-specific T cells in the local tissues. Exposure to OVA/CFA subcutaneously also resulted in accumulation of tg T cells in the PLN, peaking at day 3 (Fig. 2a), but not in gut tissues (Fig. 2b, c). Animals exposed to orally delivered antigen also exhibited a small, but reproducible, accumulation of tg T cells in the PP (Fig. 2c), again the peak of this response occurred 3 days after feeding. The kinetics of T-cell expansion in PP may also have been affected by the presence of CT. Although both groups of fed animals showed clonal expansion of tg T cells in the PP, the proportion of tg T cells in those fed OVA/CT remained higher at day 7. Thus, exposure to antigen via the oral route resulted in marked clonal expansion of tg T cells in the MLN and slight expansion in the PLN and PP. T-cell expansion in the gut tissues appeared to be increased if an orally delivered adjuvant was used and, at least in the PP, this regime may have resulted in increased persistence of tg T cells, though confirmation of this will require further examination of later time points.
Figure 2.
Clonal expansion of tg T cells following a single exposure to OVA. KJ1.26+ CD4+ T cells (2·0–3·0 × 106) were transferred into naïve recipients 1 day before feeding with 100 mg OVA (○) or 100 mg OVA + 20 µg CT (▴) or injection with 100 µg OVA/CFA (♦). Three, 5 and 7 days post antigen exposure mice were sacrificed and the percentages of KJ1.26+ CD4+ T cells in their PLN (a), MLN (b) and PP (c) were determined by FACS. Unimmunized controls from each time point were averaged and represented as day 0. Results represent two animals per group and are presented as the mean+range. Similar results were obtained in three further experiments.
Analysis of cell division following exposure to immunogenic or tolerogenic antigen
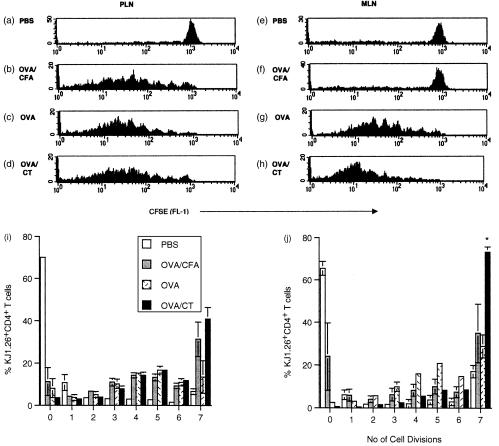
We observed tg T-cell accumulation in local and peripheral tissues after exposure to both tolerogenic and immunogenic antigen. However, these data did not discriminate between the relative contributions of recruitment and division of T cells. Furthermore, we were unable to assess whether the proliferative capacities of primed and tolerized T cells differed, as was suggested by a recent report that tolerizing by i.v. injection of peptide results in limited T-cell division compared to priming.18 In order to address these issues tg T cells were labelled with CFSE. This dye allows cell division to be tracked as after each division daughter cells halve their fluorescence.19 tg T cells in the PLN and MLN were analysed for their CFSE profiles independently. Twenty-four hours after antigen exposure there was no division apparent, as all CFSE profiles resembled those of PBS fed controls (data not shown). By 48 hr, division was observed in the local and systemic tissues of animals fed OVA or OVA/CT (data not shown). The number of cell divisions made by cells in the peripheral tissues does not differ in priming or tolerance (Fig. 3i), with cells undergoing as many as seven divisions in each case. However, significantly less tg T cells in the MLN of orally tolerized animals underwent seven or more divisions in comparison with those of primed animals by day 3 (Fig. 3j). This difference was still apparent 6 days after feeding (data not shown).
Figure 3.
Cell division following a single exposure to OVA. CFSE labelled KJ1.26+ CD4+ T cells (2·0–3·0 × 106) were transferred into naïve recipients 1 day before feeding with PBS, 100 mg OVA or 100 mg OVA + 20 µg CT or s.c. injection with 100 µg OVA CFA. Three days post antigen exposure mice were killed and the CFSE profiles of KJ1.26+ CD4+ cells in their PLN (a–d, i) and MLN (e–h, j) were determined by FACS. Results represent three animals per group and are presented as the mean±SEM. Similar results were obtained from a further three experiments (*P≤0·05).
Expression of memory markers
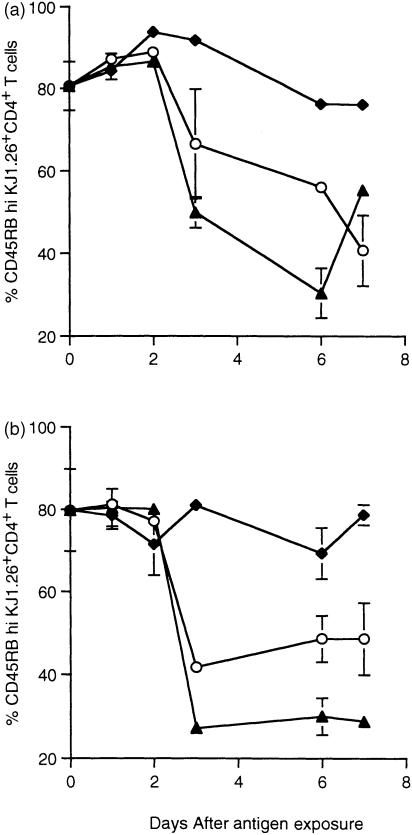
As T cells in the MLN divided less than primed cells, we examined whether the activation state induced differed in the two situations by analysing the expression of activation/memory markers. tg T cells in the PLN and MLN were examined for the activation/memory markers CD45RB and CD62L, the expression of which decreases after activation of T cells.20 Figure 4 shows the percentage of KJ1.26+ CD4+ T cells expressing CD45RB at high levels. Progression to a memory-like phenotype occurred during both priming and tolerance induction and occurred simultaneously in peripheral (Fig. 4a) and local (Fig. 4b) tissues. The majority of tg T cells had acquired a CD45RBlo phenotype by day 3 after feeding in animals exposed to antigen via the oral route. This decrease was more pronounced in OVA/CT fed animals compared with those fed OVA only. A similar result was obtained for CD62L expression where antigen-specific T cells in both the PLN and MLN had down-regulated CD62L expression 3 days after feeding either immunogenic or tolerogenic antigen (data not shown). tg T cells from animals which received OVA/CFA s.c. also progressed to a CD62Llo phenotype by day 3 (data not shown). Surprisingly, in these animals a similar CD45RB phenotype was not observed (Fig. 4a). As changes in CD45RB and CD62L expression were observed only at relatively late time points after antigen exposure (3 days) it was impossible to determine whether the responding cells were originally activated in these tissues or had migrated there after stimulation at a different site. Therefore, we decided to look at an early activation marker to localize where T cells first encountered antigen after feeding.
Figure 4.
CD45RB expression by tg T cells following exposure to OVA. KJ1.26+ CD4+ T cells from the mice described in Fig. 2 were assessed for CD45RBhi expression in PLN (a) and MLN (b). Results represent two animals per group and are represented by the mean+range. No change was observed in PBS controls which were averaged from each day and displayed as day 0. Similar results were obtained in two further experiments.
Expression of early activation markers
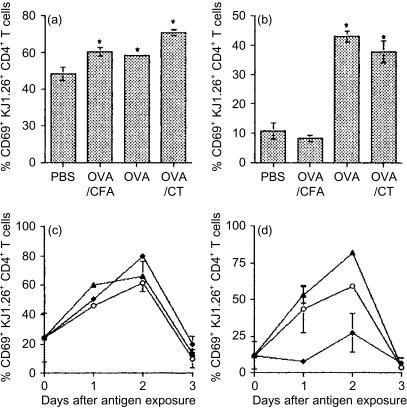
As CD69 is expressed rapidly after T-cell activation, we examined which T cells up-regulated this molecule in order to localize where tg T cells first encountered antigen. No up-regulation of CD69 was observed 2 hr after feeding (data not shown). However, CD69 levels had increased on tg T cells in all tissues within 6 hr in fed animals (Fig. 5a, b). Levels of expression peaked 2 days after antigen exposure and declined thereafter (Fig. 5c, d). CD69 was only up-regulated in the MLN if antigen was delivered orally. Up-regulation of CD69 in the PLN was observed after all antigen treatments. Animals that received OVA orally with or without adjuvant showed the same kinetics of CD69 up-regulation and similar levels of expression. However, the presence of CT appeared to somewhat increase the proportion of tg T cells expressing CD69 (Fig. 5c, d).
Figure 5.
CD69 expression by tg T cells following oral exposure to OVA. KJ1.26+ CD4+ T cells from the mice described in Fig. 2 were assessed for CD69 expression in PLN (a, c) and MLN (b, d) at 6 hr (a, b) and 1, 2 and 3 days (c, d) after exposure to antigen. Results represent two to three animals per group and are represented by the mean+SEM (a, b) or mean+range (c, d). Similar results were obtained from a further two experiments (*P≤0·05).
Localization of tg T cells by immunohistochemistry
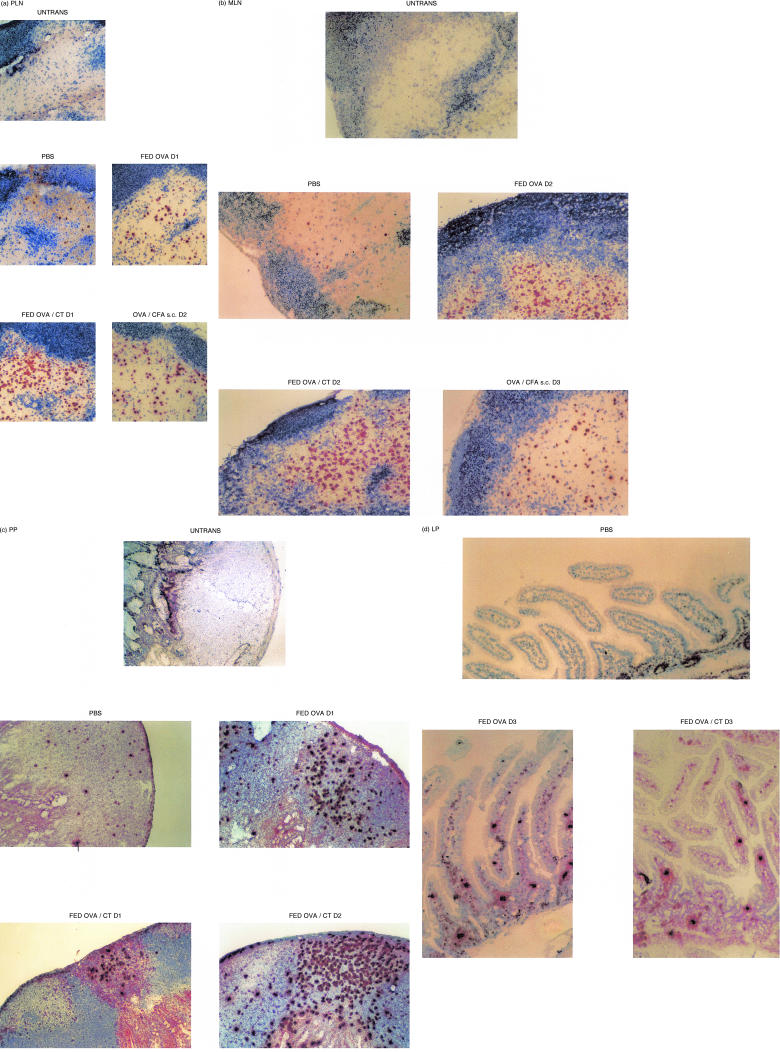
As the flow cytometric studies above demonstrated that antigen-specific T-cell activation occurred in the PLN, MLN and PP we decided to confirm these studies using immunohistochemistry (IHC) to directly examine these tissues, together with the lamina propria (LP), for the expansion of TCR tg T cells. Sections were prepared from DO11.10 recipients which had previously received either OVA/CFA s.c. or were fed PBS, OVA or OVA/CT. Immunohistochemical analysis of PLN (Fig. 7a), MLN (Fig. 6b) and PP (Fig. 6c) confirmed that the population of KJ1.26+ T cells had expanded above control levels in all of these tissues. This expansion was apparent by 24 hr after oral antigen exposure and the levels of tg T cells remained higher than control until at least day 3 in PLN, MLN and PP of OVA fed and OVA/CT fed mice. Antigen-specific T cell expansion was also observed in the MLN and PLN of mice immunized with OVA/CFA in the periphery. Tg T cells in these OVA/CFA immunized animals had expanded in the PLN by 24 hr (data not shown), 48 hr in the MLN (data not shown) and slightly in the PP by 72 hr. Again tg T-cell levels in the PLN and MLN remained high 3 days post antigen exposure. These results confirm that clonal expansion occurs throughout the animal after feeding. However the kinetics of this expansion appear faster if looking by IHC compared with flow cytometry, supporting the necessity of using more than one technique for analysis. TCR tg T cells were first found in the LP of the small intestine in animals fed OVA (in the presence or absence of CT) (Fig. 6d) by 3 days after antigen exposure and persisted thereafter (data not shown). However, they were not apparent within the first 2 days after antigen feeding (data not shown). These cells were generally absent in control mice (Fig. 6d) being observed on only two occasions and in close proximity to PP (out of the 20 animals examined).
Figure 7.
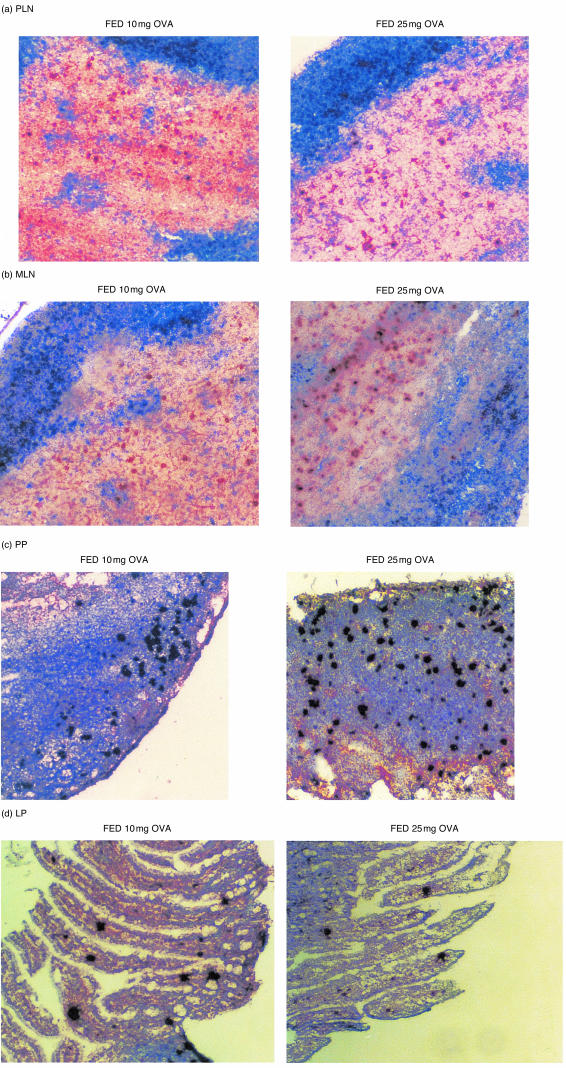
T-cell clonal expansion after feeding a range of doses of antigen. Mice described in Fig. 8 were used as a source of lymphoid tissues. PLN (a), MLN (b), PP (c) and LP (d) were frozen 3 days after antigen exposure, sectioned then stained using KJ126-DAB (brown). PLN and MLN are also stained with anti-B220-BCIP (blue). Where data are not shown the pattern of expansion is similar to that illustrated by the representative micrograph shown.
Figure 6.
In situ T-cell clonal expansion in response to immunogenic or toleogenic OVA. Mice described in Fig. 2 and one untransferred control (Untrans) were used as a source of lymphoid tissues. PLN (a), MLN (b), PP (c) and LP (d) were frozen on days 1, 2 and 3 (D1–3) after antigen exposure, sectioned then stained using KJ126-DAB (brown). PLN and MLN are also stained with anti-B220-BCIP (blue). Where data are not shown the pattern of expansion is similar to that illustrated by the representative micrograph shown.
OVA is presented simultaneously in the gut-asscoiated lymphoid tissues (GALT) and periphery after feeding a range of doses
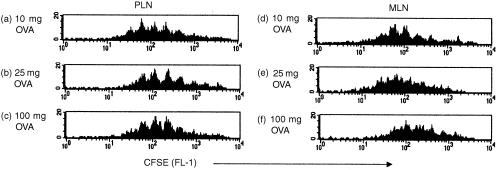
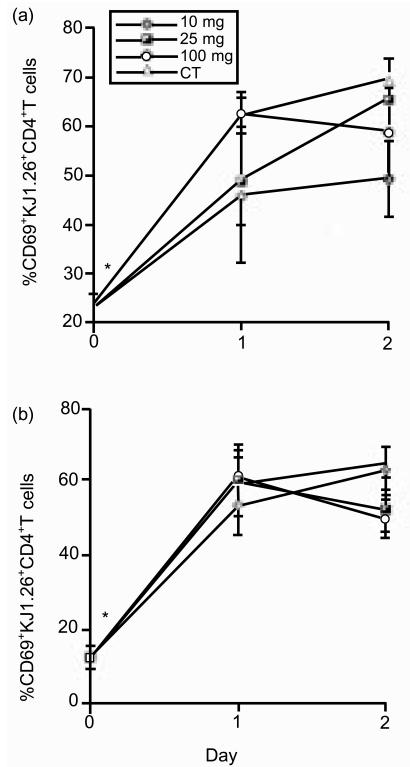
The effects of orally administered antigen on T cells in peripheral lymphoid tissues are controversial. One of the main differences between recent studies reporting contrasting findings has been the dose of antigen fed. Therefore, in order to assess whether presentation of fed OVA in the periphery was dose dependent we examined tg T cell responses in the GALT and systemic tissues after feeding a range of doses of OVA to adoptively transferred mice. Figure 7 shows that there is an accumulation of tg T cells in the PLN (Fig. 7a), MLN (Fig. 7b), PP (Fig. 7c) and LP (Fig. 7d) of adoptively transferred mice fed 10 mg or 25 mg OVA. However, this accumulation was not always apparent by flow cytometry. To confirm that this accumulation resulted from clonal expansion of tg T cells transferred cells were labelled with CFSE. Two days after feeding 10 mg or 25 mg OVA T-cell division was observed in both the PLN and MLN (data not shown). Furthermore, T cells from animals fed 10 mg or 25 mg OVA did not undergo fewer divisions than animals fed 100 mg OVA in either local (Fig. 8b) or peripheral tissues (Fig. 8a), thus even after feeding lower doses of OVA antigen is presented in both the local and peripheral tissues. However, in conformation of earlier results, tg T cells in the MLN of animals fed in the absence of adjuvant underwent fewer divisions than in those fed OVA/CT. Again, as it was still formally possible that the divided cells present in the periphery had migrated there following stimulation at a distant site and as CD69 seemed to be the most sensitive marker of T-cell activation, we used CD69 up-regulation as an indication of early antigen presentation to T cells. As can be seen in Fig. 9, T cells in both the gut and systemic tissues up-regulate CD69 24 hr after feeding, irrespective of the dose of antigen fed, confirming that feeding between 10 mg and 100 mg OVA results in antigen presentation both locally and systemically.
Figure 8.
Cell division after feeding a range of doses of antigen. CFSE labelled KJ1.26+ CD4+ T cells (2·0–3·0 × 106) were transferred into naïve recipients 1 day before feeding with PBS, 10 mg OVA, 25 mg OVA, 100 mg OVA or 100 mg OVA + 20 µg CT. Three days post antigen exposure mice were killed and the CFSE profiles of KJ1.26+ CD4+ cells in their PLN (a) and MLN (b) were determined by FACS. No division was observed in PBS fed controls. Results represent two to three animals per group and are presented as the mean+SEM (a) or mean+range (b) (*P≤0·05).
Figure 9.
Up-regulation of early activation markers after feeding a range of doses of antigen. KJ1.26+ CD4+ T cells (2·0–3·0 × 106) were transferred into naïve recipients 1 day before feeding with PBS, 10 mg OVA, 25 mg OVA, 100 mg OVA or 100 mg OVA + 20 µg CT. One and 2 days post antigen exposure mice were killed, KJ1.26+ CD4+ T cells were assessed for CD69 in their PLN (a) MLN (b). Unimmunized controls from each time point were averaged and represented as day 0. Results represent three animals per group and are presented as the mean+SEM (*P≤0·05).
Acquisition of a memory phenotype may be dose dependent
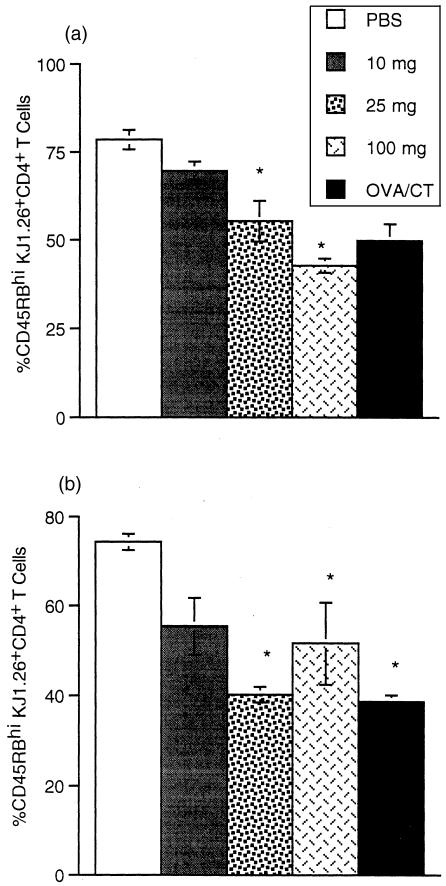
We examined the T-cell phenotype induced after feeding different doses of OVA. Figure 10 shows CD45RBhi expression by KJ1.26+ CD4+ T cells. Changes in CD45RB expression were observed 3 days after feeding all doses of OVA. It would appear that the concentration of antigen in the GALT is not limited as cells in the MLN acquire an effector/memory phenotype irrespective of the dose fed (Fig. 10b). However, in the PLN it appears that fewer tg T cells acquire a CD45RBlo phenotype as the dose of antigen is decreased (Fig. 10a).
Figure 10.
Acquisition of a memory/activated phenotype after feeding a range of doses of antigen. KJ1.26+ CD4+ T cells from the mice described in Fig. 9 were assessed for CD45RBhi expression in PLN (a) and MLN (b). Results represent two to three animals per group and are represented by the mean+range (*P≤0·05).
Discussion
We have shown that T-cell activation, division and accumulation occurs simultaneously both locally and systemically after feeding a range of doses of immunogenic or tolerogenic antigen, suggesting that fed antigen is presented throughout the animal during priming and tolerance induction. Furthermore, CT enhances the proportion of T cells activated and the degree of clonal expansion. Importantly, tolerized T cells underwent fewer divisions than primed T cells in the MLN.
The sites of oral priming and tolerance induction and the APC involved remain unclear but their identification will have important implications for the design of oral vaccines and if oral tolerance is to be used therapeutically. It has been proposed that fed antigen stimulates T cells in the GALT which subsequently disseminate to the periphery.10,11,13 However, as T cells activated in the GALT preferentially home back to mucosal sites21–23 how this leads to systemic priming or tolerance is difficult to envisage. Alternatively, fed antigen may reach the periphery directly, indeed OVA can be detected in the blood 5 min after feeding.24 It is also possible that antigen-laden APC migrate from the GALT to the periphery as dendritic cells (DC) carrying OVA have been detected in lymph after feeding.25 To address some of these issues we employed the adoptive transfer of TCR tg T cells.
Feeding OVA alone induces systemic tolerance in adoptively transferred mice, as demonstrated by a reduction in DTH, whereas, feeding OVA with CT resulted in systemic priming. We examined the phenotypic and functional consequences of these contrasting immunological states at the individual T cell level. FACS analysis revealed that feeding immunogenic or tolerogenic antigen resulted in antigen-specific T-cell expansion in the PLN and MLN which peaked 3 days after antigen exposure. Previous studies have shown that oral tolerance is preceded by tg T-cell proliferation in the MLN of fed animals.10,11,13 However, in contrast to the data presented here, others failed to detect an increase in tg T cells in the PLN of fed mice.10,12 In this case, investigators fed 25 mg OVA, a dose at which we observed expansion of tg T cells only by IHC, possibly explaining the disparate findings. In accordance with our results, T-cell division in the PLN of fed mice has been reported;11,13 however, in contrast to our findings these studies suggested that tg T cells are stimulated in the GALT and subsequently migrate to the periphery. In support of our data, one report observed T-cell activation simultaneously throughout the animal after feeding.14 Our results also demonstrated T-cell expansion in the PP of fed animals, confirming previous studies.10 Furthermore, feeding immunogenic antigen appeared to result in increased persistence of T cells when compared with feeding OVA alone. However, this will require further confirmation at later time points.
Thus, we observed increased numbers of primed and tolerized T cells both locally and systemically after feeding antigen. However, we could not assess the contribution of recruitment versus division at these sites or whether primed and tolerized T cells have different proliferative capacities. To investigate these issues we used CFSE. Cells labelled with CFSE apportion fluorescence between daughter cells during mitosis, making it possible to track the number of divisions undergone by labelled cells in response to antigenic stimulation.19 It has been hypothesized that tolerized T cells have a reduced ability to proliferate and arrest in the G1 phase of the cell cycle.12,26,27 Although it is now clear that in vivo oral tolerance is preceded by clonal expansion,10,11,13 whether these cells exhibit a reduced capacity to divide when compared with primed cells is unknown. A recent report investigating priming or tolerance induction after i.v. injection of peptide has shown that low tolerizing doses of peptide (5 mg) induced regulatory T cells which underwent fewer divisions than anergic cells induced by high tolerizing doses of peptide (100 mg) and T cells primed by 5 mg peptide administered with lipopolysaccharide.18 Thus, some types of tolerized T cells may undergo fewer divisions than primed cells but, it is not merely division history that determines the functional phenotype of a T cell as those tolerized by high doses of peptide are capable of as much division as primed cells.18,28
In our studies, tg T cells divided locally and systemically as early as 2 days after feeding, with or without adjuvant. As no lag in division was seen between local and systemic tissues we suggest that T cells recognize antigen and are induced to divide in both sites simultaneously. However, it is formally possible that the divided cells present in the periphery are stimulated in the GALT and subsequently migrate to the PLN. This was suggested by others who observed more division in the GALT than the periphery at 2 days, though some division was seen in the periphery.13 Throughout our studies, cells in the PLN underwent the same number of divisions during both priming and tolerance. However, in the MLN tolerized T cells divided significantly less than primed cells possibly explaining the enhanced clonal expansion of antigen-specific T cells we had noted in the MLN of OVA/CT fed animals. Whether this difference was due to a decrease in the absolute number of divisions or in the rate of division of tolerized T cells remains to be determined. These results confirm other studies which suggest that tolerized T cells undergo limited divisions.18 However, this study suggested that this effect was only apparent in the periphery, where we observed no differences in division between priming and tolerance. These discrepancies may have arisen as we have examined different time points. Regulatory cells may be induced in the MLN at early time points but disseminate to be detected at other sites at later time points as described by Thorstenson et al.18 Alternatively, the cells which undergo limited divisions in the MLN in our studies may be anergic rather than regulatory T cells, as anergic cells have a reduced ability to proliferate and they arrest in G1.12,26,27 Why there was a difference in division in the MLN but not the PLN during priming and tolerance induction is unclear. A difference in the concentration of antigen present in the MLN versus PLN or different local environments in the two sites may be responsible. Detailed kinetic studies using a range of tolerizing and priming doses will be required to clarify these issues. Other studies have suggested that orally tolerized T cells display defective division in response to challenge in the periphery.12 However, these studies of secondary responses are not directly comparable with our examination of the primary response to fed antigen.
As T cells in the MLN of tolerized animals divided less than primed T cells, we hypothesized that priming and tolerance may differ in the memory/effector cells they induce. By examining expression of CD45RB and CD62L by T cells, which acquire a low phenotype as they become activated,20 we found that tg T cells in the PLN and MLN made this conversion 3 days after feeding OVA or OVA/CT. This confirms and extends earlier studies,10,11 although it is at odds with one, which failed to detect CD45RBlo tg T cells in the PLN of tolerized mice.10 As we also observed CD45RBlo tg T cells in the PLN after feeding the lower dose (25 mg) of antigen employed in this study we cannot explain the conflicting results. Thus, in our hands, activated T cells are generated during both oral priming and tolerance induction, and they accumulate in mucosal and peripheral sites under both circumstances.
To characterize where a T cell first encounters fed antigen, we analysed the expression of the early activation marker CD69 on tg T cells. T cells were activated, both systemically and locally, within 6 hr of feeding OVA or OVA/CT. The presence of CT made no difference to the timing of this activation, but enhanced the proportion of activated cells. CD69 has previously been shown to be up-regulated on T cells 3–6 hr after feeding OVA.11 Given that the time required for T cells to express CD69 is 2–3 hr29 the possibility that T cells and/or APC migrate from the gut to peripheral sites is unlikely. Therefore, it would seem most probable that fed antigen is distributed throughout the animal and results in T-cell activation locally and systemically.
We also used IHC to visualize tg T cells directly. IHC suggested that tg T cells expand earlier than detected by FACS, as accumulation in the PLN, MLN and PP was apparent within 24 hr of feeding OVA or OVA/CT. This difference between IHC and FACS may result from TCR down-regulation after antigen stimulation, as FACS would only detect external TCR, whereas IHC would detect internal TCR also. Alternatively, activated T cells may be more susceptible to death and may be lost during isolation for FACS analysis, or they may be more difficult to release from tissue. This is currently under investigation, but these findings stress the importance of using more than one technique to analyze experimental systems as done here.
Previous studies10,30 were unable to detect tg T cells in the LP before or after feeding, raising concerns that the adoptive transfer system is unphysiological as T cells derived from the donor may not localize in the LP if they lack the appropriate mucosal addressins. However, as few T cells with a naïve phenotype are present in the LP31 and tg T cells and were not usually detected in the LP of naïve DO11.10 recipients, it is unlikely that T cells first encounter fed antigen in the LP. It has been suggested that T cells primed in the PP and MLN relocate to the LP.21,22 However, antigen could be presented in the LP soon after feeding, T cells may then migrate to the MLN and PP, clonally expand further then migrate back to the LP. Careful kinetic and transfer studies are required to distinguish these possibilities. We have shown that after feeding, tg T cells expand both locally and systemically, and are then recruited to the LP. Furthermore, T cells maintain the ability to localize to the LP in tolerized, as well as primed, animals. However, the function of these T cells remains to be determined.
In order to determine whether the controversies in the literature regarding the location of T-cell activation after feeding were related to the different doses employed we studied T-cell responses after feeding a range of doses of antigen. We observed tg T-cell accumulation and cell division both locally and systemically at all doses examined. Furthermore, 24 hr after feeding, CD69 up-regulation was apparent on tg T cells in the MLN and PLN. Taken together, these data suggest that, at all doses examined, fed antigen is presented to T cells in local and peripheral tissues simultaneously. Interestingly, acquisition of a CD45RBlo phenotype appeared to be dose dependent, with less tg cells in the PLN down-regulating CD45RB as the dose of antigen fed was decreased. This suggests that after feeding higher doses more antigen is presented in the PLN which causes T cells to acquire different phenotypic characteristics. Whether the tolerizing antigen dose affects the functional characteristics of T cells in the periphery is unclear and we are currently investigating the induction of regulatory T cells versus anergic T cells in these circumstances.
Here, we have shown that after oral exposure to immunogenic or tolerogenic antigen T-cell activation, division and expansion occurs simultaneously locally and systemically, though later in the LP, suggesting that fed antigen is presented throughout the animal during priming and tolerance induction. Furthermore, CT enhances the proportion of T cells activated and the degree of clonal expansion. Importantly, and in contrast to all previous studies, we have shown that there is little difference in the kinetics of clonal expansion or phenotype of cells generated during the induction of oral priming versus tolerance but that the former enhances accumulation of tg T cells in the MLN of tolerized animals while the latter produces T cells with a defect in cell division in this tissue during a primary response.
Acknowledgments
This study was supported by a grant from The Wellcome Trust awarded to P. Garside.
References
- 1.Gautam SC, Battisto JR. Orally induced tolerance generates an efferently acting suppressor T cell and an acceptor T cell that together down-regulate contact sensitivity. J Immunol. 1985;135:2975. [PubMed] [Google Scholar]
- 2.Kay RA, Ferguson A. The immunological consequences of feeding cholera toxin. I. Feeding cholera toxin suppresses the induction of systemic delayed-type hypersensitivity but not humoral immunity. Immunology. 1989;66:410. [PMC free article] [PubMed] [Google Scholar]
- 3.Higgins PJ, Weiner HL. Suppression of experimental autoimmune encephalomyelitis by oral administration of myelin basic protein and its fragments. J Immunol. 1988;140:440. [PubMed] [Google Scholar]
- 4.Miller SD, Hanson DG. Inhibition of specific immune responses by feeding protein antigens. IV. Evidence for tolerance and specific active suppression of cell-mediated immune responses to ovalbumin. J Immunol. 1979;123:2344. [PubMed] [Google Scholar]
- 5.Mowat AM, Strobel S, Drummond HE, Ferguson A. Immunological responses to fed protein antigens in mice. I. Reversal of oral tolerance to ovalbumin by cyclophosphamide. Immunology. 1982;45:105. [PMC free article] [PubMed] [Google Scholar]
- 6.Gallichan WS, Rosenthal KL. Long-lived cytotoxic T lymphocyte memory in mucosal tissues after mucosal but not systemic immunization. J Exp Med. 1996;184:1879. doi: 10.1084/jem.184.5.1879. [DOI] [PMC free article] [PubMed] [Google Scholar]
- 7.Lycke N. The mechanism of cholera toxin adjuvanticity. Res Immunol. 1997;148:504. doi: 10.1016/s0923-2494(98)80144-2. [DOI] [PubMed] [Google Scholar]
- 8.Garside P, Mowat AM, Khoruts A. Oral tolerance in disease. Gut. 1999;44:137. doi: 10.1136/gut.44.1.137. [DOI] [PMC free article] [PubMed] [Google Scholar]
- 9.Kearney ER, Pape KA, Loh DY, Jenkins MK. Visualization of peptide-specific T cell immunity and peripheral tolerance induction in vivo. Immunity. 1994;1:327. doi: 10.1016/1074-7613(94)90084-1. [DOI] [PubMed] [Google Scholar]
- 10.Williamson E, O'Malley JM, Viney JL. Visualizing the T-cell response elicited by oral administration of soluble protein antigen. Immunology. 1999;97:565. doi: 10.1046/j.1365-2567.1999.00824.x. [DOI] [PMC free article] [PubMed] [Google Scholar]
- 11.Sun J, Dirden-Kramer B, Ito K, Ernst PB, Van Houten N. Antigen-specific T cell activation and proliferation during oral tolerance induction. J Immunol. 1999;162:5868. [PubMed] [Google Scholar]
- 12.Shi HN, Liu HY, Nagler-Anderson C. Enteric infection acts as an adjuvant for the response to a model food antigen. J Immunol. 2000;165:6174. doi: 10.4049/jimmunol.165.11.6174. [DOI] [PubMed] [Google Scholar]
- 13.Blanas E, Davey GM, Carbone FR, Heath WR. A bone marrow-derived APC in the gut-associated lymphoid tissue captures oral antigens and presents them to both CD4+ and CD8+ T cells. J Immunol. 2000;164:2890. doi: 10.4049/jimmunol.164.6.2890. [DOI] [PubMed] [Google Scholar]
- 14.Gutgemann I, Fahrer AM, Altman JD, Davis MM, Chien YH. Induction of rapid T cell activation and tolerance by systemic presentation of an orally administered antigen. Immunity. 1998;8:667. doi: 10.1016/s1074-7613(00)80571-3. [DOI] [PubMed] [Google Scholar]
- 15.Murphy KM, Heimberger AB, Loh DY. Induction by antigen of intrathymic apoptosis of CD4+ CD8+ TCRlo thymocytes in vivo. Science. 1990;250:1720. doi: 10.1126/science.2125367. [DOI] [PubMed] [Google Scholar]
- 16.Smith KM, Pottage L, Thomas ER, Leishman AJ, Doig TN, Xu D, Liew FY, Garside P. Th1 and Th2 CD4+ T cells provide help for B cell clonal expansion and antibody synthesis in a similar manner in vivo. J Immunol. 2000;165:3136. doi: 10.4049/jimmunol.165.6.3136. [DOI] [PubMed] [Google Scholar]
- 17.Leishman AJ, Garside P, Mowat AM. Induction of oral tolerance in the primed immune system: influence of antigen persistence and adjuvant form. Cell Immunol. 2000;202:71. doi: 10.1006/cimm.2000.1665. [DOI] [PubMed] [Google Scholar]
- 18.Thorstenson KM, Khoruts A. generation of anergic and potentially immunoregulatory CD25 (+) CD4 T cells in vivo after induction of peripheral tolerance with intravenous or oral antigen. J Immunol. 2001;167:188. doi: 10.4049/jimmunol.167.1.188. [DOI] [PubMed] [Google Scholar]
- 19.Lyons AB, Parish CR. Determination of lymphocyte division by flow cytometry. J Immunol Methods. 1994;171:131. doi: 10.1016/0022-1759(94)90236-4. [DOI] [PubMed] [Google Scholar]
- 20.Bell EB, Sparshott SM, Bunce C. CD4+ T-cell memory, CD45R subsets and the persistence of antigen – a unifying concept. Immunol Today. 1998;19:60. doi: 10.1016/s0167-5699(97)01211-5. [DOI] [PubMed] [Google Scholar]
- 21.Parrott DM, Ferguson A. Selective migration of lymphocytes within the mouse small intestine. Immunology. 1974;26:571. [PMC free article] [PubMed] [Google Scholar]
- 22.Parrott DM, De Sousa M. Thymus-dependent and thymus-independent populations. origin, migratory patterns and lifespan. Clin Exp Immunol. 1971;8:663. [PMC free article] [PubMed] [Google Scholar]
- 23.Salmi M, Jalkanen S. Molecules controlling lymphocyte migration to the gut. Gut. 1999;45:148. doi: 10.1136/gut.45.1.148. [DOI] [PMC free article] [PubMed] [Google Scholar]
- 24.Peng HJ, Turner MW, Strobel S. The generation of a ‘tolerogen’ after the ingestion of ovalbumin is time-dependent and unrelated to serum levels of immunoreactive antigen. Clin Exp Immunol. 1990;81:510. doi: 10.1111/j.1365-2249.1990.tb05365.x. [DOI] [PMC free article] [PubMed] [Google Scholar]
- 25.Liu LM, MacPherson GG. Antigen acquisition by dendritic cells: intestinal dendritic cells acquire antigen administered orally and can prime naive T cells in vivo. J Exp Med. 1993;177:1299. doi: 10.1084/jem.177.5.1299. [DOI] [PMC free article] [PubMed] [Google Scholar]
- 26.Greenwald RJ, Boussiotis VA, Lorsbach RB, Abbas AK, Sharpe AH. CTLA-4 regulates induction of anergy in vivo. Immunity. 2001;14:145. doi: 10.1016/s1074-7613(01)00097-8. [DOI] [PubMed] [Google Scholar]
- 27.DeSilva DR, Urdahl KB, Jenkins MK. Clonal anergy is induced in vitro by T cell receptor occupancy in the absence of proliferation. J Immunol. 1991;147:3261. [PubMed] [Google Scholar]
- 28.Adler AJ, Huang CT, Yochum GS, Marsh DW, Pardoll DM. In vivo CD4+ T cell tolerance induction versus priming is independent of the rate and number of cell divisions. J Immunol. 2000;164:649. doi: 10.4049/jimmunol.164.2.649. [DOI] [PubMed] [Google Scholar]
- 29.Testi R, D'Ambrosio D, De Maria R, Santoni A. The CD69 receptor: a multipurpose cell-surface trigger for hematopoietic cells. Immunol Today. 1994;15:479. doi: 10.1016/0167-5699(94)90193-7. [DOI] [PubMed] [Google Scholar]
- 30.Van Houten N, Blake SF. Direct measurement of anergy of antigen-specific T cells following oral tolerance induction. J Immunol. 1996;157:1337. [PubMed] [Google Scholar]
- 31.Mowat AM, Viney JL. The anatomical basis of intestinal immunity. Immunol Rev. 1997;156:145. doi: 10.1111/j.1600-065x.1997.tb00966.x. [DOI] [PubMed] [Google Scholar]


