Abstract
The regulation of signal transducer and activator of transcription-1 (STAT-1) by cytokines and all-trans-retinoic acid (RA) was investigated in THP-1 monocytic cells cultured with RA and stimulated with lipopolysaccharide (LPS), tumour necrosis factor-α (TNF-α), interferon-β (IFN-β), and IFN-γ, individually or in combinations. While RA (10−8 m) alone did not alter STAT-1 activation or expression in THP-1 cells, RA enhanced or prolonged STAT-1 activation (tyrosine 701 phosphorylation) and gene expression (mRNA and protein) induced by either IFN-β or IFN-γ. However, in contrast, RA reduced STAT-1 activation and gene expression induced by LPS and/or TNF-α by about 50–70%, and lowered in vitro DNA binding activity to both a STAT-1 consensus element and a nuclear factor kappa B (NFκB) binding element. These results imply that RA can significantly rebalance STAT-1-dependent responses, and that one of the mechanisms may be through the inhibition of the NFκB pathway.
Introduction
Signal transducer and activator of transcription-1 (STAT-1), a member of a family of latent cytoplasmic proteins,1 plays an essential role in the intracellular signalling pathways induced by certain cytokines and growth factors that regulate cell proliferation, differentiation, immune responses and homeostasis.1–3 As its name indicates, STAT-1 functions not only as a transducer of signals from cell-surface receptors but, after activation and translocation to the nucleus, as a transcription factor capable of regulating numerous genes involved in antiviral, antibacterial and antiproliferative responses.3 The activation of STAT-1 involves phosphorylation on a specific tyrosine residue (Y701) that renders STAT-1 competent to form homo- or heterodimers, and another phosphorylation on serine (S727) which is necessary for full transcription factor activity.4,5 While rapid protein phosphorylation is critical for the STAT-1's transactivation function, the level of STAT-1 gene expression may also determine its signalling potential.6,7 STAT-1 transduces signals for inflammatory and immune stimuli such as interferons (IFN-α/β and IFN-γ, two distinct families of IFNs) and many interleukins,8,9 and is important to IFN-mediated antiviral responses10–12 and to cellular responses to bacterial products and mediators of inflammation, including lipopolysaccharide (LPS) and tumour necrosis factor-α (TNF-α).
Vitamin A is a dietary factor required for uncompromised immunity.13,14 All-trans-retinoic acid, a natural oxidative metabolite of vitamin A,15 is well known to exert its hormonal influence on diverse processes including cell proliferation, differentiation and apoptosis.16,17 Most biological actions of retinoids are mediated by their association with one or more members of two subfamilies of ligand-activated nuclear receptors, RARs and RXRs, which bind to retinoid response elements (RAREs) in target genes to induce, or sometimes inhibit, gene transcription.16
Interactions between retinoic acid (RA) and various pro-inflammatory factors have been demonstrated previously in several contexts. For example, RA was shown to inhibit the production of TNF-α and interleukin-1 (IL-1) in cultured macrophages, and to inhibit the induction of nitric oxide production and nitric oxide synthase 2 (iNOS) gene expression by LPS or IFN-γ in macrophages18 and mesangial cells.19 These effects may account for the reported anti-inflammatory effect of RA. However, RA may also sensitize cells to the effects of cytokines, as we have recently shown for RAW264.7 macrophages exposed to LPS and IFN-γ, in which nitric oxide production induced by low concentrations of LPS or IFN-γ was increased in cells exposed to RA.20 Moreover, RA is well recognized as a potent inducer of cell differentiation and an immune modulator.14 RA is capable of enhancing IFN-induced cell differentiation in vitro and in vivo, and is receiving attention for cancer therapy.21,22 With respect to its interactions with IFNs, RA improves the clinical efficacy of IFN-β in the treatment of multiple sclerosis, a disease related to unbalanced T helper type 1 cell activity.23 These various observations indicate the existence of cross-talk, perhaps at several levels, between the RA receptor-mediated signalling pathways and cytokine-initiated signalling pathways.
For the present studies on retinoid-regulated STAT-1 responses to immune stimuli, we investigated the ability of RA to induce STAT-1 activation and gene expression independently, as well as to modulate the induction of STAT-1 signalling by several immune stimuli including LPS and TNF-α, IFN-β and IFN-γ in THP-1 cells. THP-1 cells were chosen as a model system because they are known to differentiate into macrophage-like cells in response to RA, as well as activated vitamin D and phorbol esters.24–26 We observed that RA is capable of modulating the ability of cytokines to induce STAT-1 expression and activation in THP-1 cells. This modulation is differential, as all-trans-RA enhanced the potential of IFNs to induce STAT-1 activation in THP-1 cells, which is consistent with previous reports in other cell types,7,27 but it strongly inhibited the activation and expression of STAT-1 induced by TNF-α and LPS. These results thus indicate that LPS, TNF-α and IFNs may regulate STAT-1 gene expression and activation through different pathways, and that RA can differentially control the signalling pathways activated by these cytokines at different points. Because we observed that RA could inhibit LPS- and TNF-α-induced activity of nuclear factor kappa B (NFκB), which is an important molecule in TNF-α and LPS signalling pathways, we propose that the inhibitory effect of RA may be mediated at least partially through the inhibition of NFκB activation.
Materials and methods
Cells and reagents
THP-1, a human monocytic leukaemia cell line, was purchased from the American Type Culture Collection (Rockville, MD). All-trans-RA was obtained from Sigma Chemicals (St Louis, MO), Escherichia coli LPS (055:B5) was from List Biological Laboratory, Inc. (Campbell, CA), recombinant human TNF-α was from R & D Systems (Minneapolis, MN), and recombinant human IFN-β and IFN-γ were from Biosource International (Camarillo, CA) and PreproTech Inc. (Rocky Hill, NJ), respectively. Antibodies specific for STAT-1 protein and phosphotyrosine residues (PY20) were purchased from Transduction Laboratory (Lexington, KY), and anti-STAT-1701 was obtained from Cell Signaling Technology (Beverly, MA). Protein G agarose, used in immunoprecipitation, and double-stranded DNA oligonucleotide binding elements, used in electrophoresis mobility shift assay (EMSA), were purchased from Santa Cruz Biotechnology (Santa Cruz, CA). Electrophoresis reagents were from BioRad (Cambridge, MA) and nitrocellulose membranes were from Amersham (Piscataway, NJ). The enhanced chemiluminescence (ECL) detection system was from Pierce (Rockford, IL).
Cell culture and treatment
Stock cultures of cells were maintained in RPMI-1640 medium (Life Technologies, Rockville, MD) supplemented with 10% heat-inactivated fetal bovine serum (FBS, Life Technologies) and 10−5 mβ-mercaptoethanol. For experiments, cells were plated in plastic Petri dishes and incubated at 37° in a 5% CO2–air incubator at a density of 2·5 × 105/ml in medium with reduced FBS concentration (3% unless otherwise indicated) for 6 hr, then incubated for another 16 hr in the presence and absence of all-trans-RA (10−8 m, unless otherwise indicated). Immune stimuli (LPS, TNF-α, IFN-β, or IFN-γ), either individually or in the combinations indicated in the text or the figure legends, were added to cultures for varying times.
Cells were plated at 2·5 × 105/ml in six-well tissue culture plates. After treatment with stimuli, cells were harvested and washed once with cold phosphate-buffered saline (PBS). Following procedures described previously,28 cell pellets were lysed using RIPA buffer (1% Nonidet P-40, 0.5% sodium deoxycholate, 0.1% SDS in PBS) (Santa Cruz Inc. Santa Cruz, CA) containing a protease inhibitor cocktail (Roche, Nutley, NJ) and 1 mm sodium orthorvanidate (Sigma) as phosphatase inhibitor. Whole cell lysates were obtained by centrifugation at 15 000 g for 15 min at 4°. The protein concentration in the supernatants was measured using the bio-rad protein (BSA) assay (BioRad). Fifty microgrammes of total cellular protein was dissolved in 1× sodium dodecyl sulphate (SDS) sample buffer with 100 mm dithiothreitol (DTT) as reducing agent, then boiled for 10 min and loaded onto an 8% polyacrylamide gel for separation by SDS–polyacrylamide gel electrophoresis (SDS–PAGE). After separation, proteins were transferred to nitrocellulose membranes. Each blot was incubated with an appropriately diluted primary antibody, followed by washing three times with TBST (10 mm Tris–HCl, pH 8·0, 150 mm NaCl, and 0·05% Tween-20). It was then incubated with horseradish peroxidase-labelled secondary antibody and visualized using an ECL detection system. Afterwards, the membrane was stained with Ponceau S which was used to demonstrate equal loading of samples.29
Immunoprecipitation
THP-1 cell lysate (500 μg of protein in 500 μl of RIPA buffer) was incubated first with anti-STAT-1 antibody at 4° for 1 hr before protein G agarose (20 μl) was added and incubated with the lysate at 4° overnight. The mixture was washed twice with RIPA buffer with proteinase and phosphatase inhibitors, as stated above, and twice with cold PBS, 1× SDS sample buffer was then added to the agarose beads, and the beads were boiled for 10 min to release and denature the protein. The precipitates were subjected to SDS–PAGE and Western blot analysis.28
Reverse transcription–polymerase chain reaction (RT-PCR)
THP-1 cells, 5 × 10⁵ cells/ml, were plated in 100-mm plastic Petri dishes and, after stimulation, total cellular RNA was isolated using a RNeasy Kit (Qiagen, Valencia, CA) according to the manufacturer's instructions. One microgramme of total RNA was subjected to RT (Promega, Madison, WI). One-tenth of the reaction mixture was used for PCR analysis. To detect the differential expression of human Stat-1α and Stat-1β mRNAs, a set of primers was designed which share a common forward primer for both Stat-1 isoforms with specific reverse primers for Stat-1α and Stat-1β, respectively. The forward primer sequence for both Stat-1 isofomrs is 5′-AAGGAAGCACCAGAGCCAATGG; the sequence of the reverse primer for Stat-1α is 5′-CACTTGCTATCAACAGGTTGCAGC; and that of the reverse primer for Stat-1β is 5′-AATGCTGATAGGCAGTAACACGG. These primers, located in different exons of the Stat-1 gene, are expected to generate amplicons of Stat-1α and Stat-1β of 345 base pairs (bp) and 242 bp, respectively. The cytochrome P450 Cyp26 gene, known to be RA-inducible, was also amplified as a positive control.30 Glyceraldehyde-3-phosphate dehydrogenase (GAPDH) was employed as a housekeeping gene and internal control for RNA integrity and RT-PCR amplification. The primer sequence for the GAPDH forward primer is 5′-TGAAGGTCGGAGTCAACGGATTTGGT; and that for the reverse primer is 5′-CATGTGGGCCATGAGGTCCACCAC; the size of the amplicon is 982 bp. During PCR amplification, 0·5 μCi of [α-33P]dATP was added to the PCR reaction to label the PCR product. PCR conditions were optimized as denaturing at 94°, 1 min, annealing at 60° for 1 min and extension at 72° for 1 min. Stat-1, Cyp26 and GAPDH genes were amplified by 22 cycles, 30 cycles and 17 cycles, respectively. After amplification, the PCR products were separated on a 5% non-denaturing acrylamide gel for 2 hr.31 The gel was dried and exposed to Kodak MS X-ray film with markers to determine exactly the product position. Individual bands were cut from the dried gel and counted in 3 ml ScintiVerse scintillation fluid (Fisher Scientific, Houston, TX) by liquid scintillation counting to quantify the relative gene expression level.
EMSA
Nuclear protein was extracted from THP-1 cells following a procedure we have described previously.31 Briefly, cell pellets were homogenized in a hypotonic buffer [10 mm HEPES, pH 7·9, 1·5 mm MgCl2, 10 mm KCl, 0·2 mm phenylmethylsulphonyl fluoride (PMSF), 0·5 mm DTT, 1 mm sodium orthovanadate, 0·5% nonidet P-40] using a Dounce tissue homogenizer. Nuclei were recovered by centrifugation at 2500 g at 4° for 10 min. Then a hypertonic buffer (20 mm HEPES, pH 7·9, 10% glycerol, 1·5 mm MgCl2, 400 mm KCl, 0·2 mm ethylenediaminetetraacetic acid, 0·2 mm PMSF, 0·5 mm DTT, 1 mm sodium orthovanadate) was added to extract nuclear protein. After 30 min incubation on ice, the mixture was centrifuged at 15 000 g for 30 min. The supernatant was divided into aliquotes and stored at −80°. For each EMSA reaction, 2 μg of nuclear protein was incubated with 10 000 c.p.m. of an appropriate [γ-32P]ATP end-labelled probe for 30 min on ice. For competition or super shift assay, unlabelled oligonucleotides, such as IFN-stimulated response element/γ-IFN activated site (ISRE/GAS), mutant ISRE/GAS (MuISRE/GAS), NFκB, and mutant NFκB (MuNFκB) binding sites, or specific or irrelevant antibodies were first incubated with nuclear protein for 30 min on ice, the probe was then added to the reaction and the mixture was incubated further for 30 min on ice. The reaction mixtures were then loaded onto a 5% native polyacrylamide gel. After electrophoresis, the gel was dried and subjected to autoradiography.
Statistical analysis
The data were presented as mean ±SD. One-way analysis of variance (anova) followed by Tukey's multiple comparison test was used to analyse the data. P < 0·05 was considered significant.
Results
RA inhibits STAT-1 protein accumulation and phosphorylation induced by LPS and TNF-α
In preliminary experiments, STAT-1 gene expression and protein phosphorylation were determined in THP-1 cells incubated in the absence or presence of all-trans-RA over the range of concentrations from 10−9 to 10−5 m. STAT-1 protein was detected by Western blot analysis with an antibody specific for STAT-1 protein, and STAT-1 protein phosphorylation was determined using an antibody against STAT-1 protein phosphorylated at Y701, the critical site for STAT-1 protein activation.5 Over this wide range of RA doses, we did not detect any significant alteration of STAT-1 protein and phosphorylation levels (data not shown). When cells were treated with LPS (100 ng/ml) or TNF-α (5 ng/ml), alone or in combination, there was a strong up-regulation of STAT-1 protein (Fig. 1a). The induction of STAT-1 protein was detectable by 6 hr of stimulation and continued to increase with time, reaching a maximum at ∼72 hr. Since the pattern was the same at each time-point, the 24-hr image was selected for illustration in Fig. 1(a) to represent the regulatory effects of LPS and TNF-α. Protein staining with Ponceau S is illustrated in the figure to demonstrate the equal loading and proper transfer of the protein.
Figure 1.
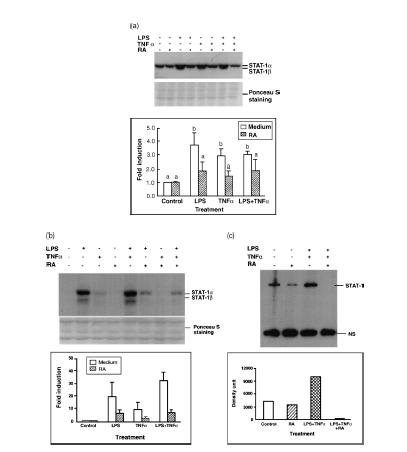
Retinoic acid (RA) inhibits lipopolysaccharide (LPS)- and tumour necrosis factor-α (TNF-α)-induced STAT-1 protein expression and phosphorylation. THP-1 cells were pretreated with RA (10−8 m) or vehicle (control) for 16 hr, then with LPS (100 ng/ml) or TNF-α (5 ng/ml) and fresh RA for 24 hr. Fifty microgrammes of protein was subjected to Western blot analysis to determine STAT-1 protein and phosphorylated STAT-1 (PY701) levels. (a) Western blot analysis. The top image shows the STAT-1 protein detected by monoclonal anti-human STAT-1, and the Ponceau S staining of the membrane is shown underneath. The bar graph shows the results of densitometric analysis (fold induction, mean ±SD) from three independent experiments. Control value for each group set to 1·0. Stimulated groups were significantly different from the non-stimulated control group (P < 0·01), and from the stimuli plus RA groups (P < 0·01). (b) Western blot analysis using antibody recognizing the phosphorylated tyrosine, PY701. Bar graph shows results from two independent experiments. (c) Immunoprecipitation and Western blot assay of THP-1 cells pretreated with RA overnight and then with LPS, TNF-α and fresh RA for 24 hr. Protein lysates were first subjected to immunoprecipitation with anti-STAT-1 antibody, and then to Western blot analysis with anti-phosphotyrosine antibody (PY20). A non-specific band (NS), which might be the immunoglobulin heavy chain cross-reacting with the secondary antibody used in Western blot procedure, is included to indicate the even loading of the gel. Similar results (not shown) were observed when anti-STAT-1 was used for immunoprecipitation followed by detection with anti-STAT-1 antibody.
The tyrosine phosphorylation status (PY701) of STAT-1 protein was detected under the same culture conditions. Treatment of cells with LPS and/or TNF-α induced STAT-1 protein phosphorylation, which was detectable at 4–6 hr and maximum at 48 hr of stimulation. The 24-hr image is illustrated in Fig. 1(b) as a representative example. Interestingly, pretreatment of cells overnight (16 hr) with 10−8 m RA, a concentration considered physiological, reduced the inducibility of STAT-1 protein expression and phosphorylation by LPS and TNF-α (Fig. 1a,b). STAT-1 expression and activation were reduced by about 50–70%. To confirm the specificity of the signal, we performed immunoprecipitation analysis with THP-1 cell lysate collected after 24 hr of treatment. The lysate was first precipitated with anti-STAT-1 antibody and then subjected to Western blot analysis using an anti-phosphotyrosine (PY20) (Fig. 1c), and anti-STAT-1 antibody (not shown). This experiment, by a second approach, also demonstrated that LPS and TNF-α induced STAT-1 protein and tyrosine phosphorylation, and that pretreatment with RA strongly inhibited the induction of STAT-1 and its activation in THP-1 cells.
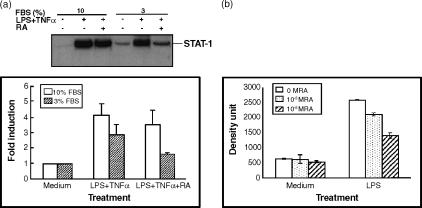
The experiments above were performed with THP-1 cells cultured in RPMI-1640 medium supplemented with 3% FBS, which is the minimum FBS concentration needed to maintain good growth and morphology of THP-1 cells. To determine if serum concentration has a significant effect on the responsiveness of THP-1 cells to cytokines and RA, we determined STAT-1 protein levels in the presence of different concentrations of serum. As shown in Fig. 2(a), cytokine stimulation in the presence of 10% serum resulted in stronger induction of STAT-1 protein in the presence of LPS/TNF-α, while 3% serum resulted in similar but lower induction. However, the inhibition as a result of RA was clear whether 3%, 5% (not shown), or 10% serum was used, and was dose dependent (Fig. 2b). The rest of our experiments were performed with medium supplemented with 3% FBS and 10−8 m RA, considered a physiological concentration.
Figure 2.
Effect of medium fetal bovine serum concentration on the regulation of STAT-1 protein in the presence of LPS/TNF-α and RA. THP-1 cells were plated in RPMI-1640 medium with different concentrations of FBS. Cells were pretreated with RA (10−8 or 10−6 m as indicated) for 16 hr and then LPS and TNF-α were added to cells with fresh RA for anther 48 hr of incubation. (a) Western blot analysis showing the induction of STAT-1 protein with 10 and 3% FBS in the presence or absence of 10−8 m RA. Bar graph shows results from two experiments (control value for each group set to 1·0). (b) Analysis of Western blot data showing the regulation of STAT-1 protein by LPS/TNF-α and RA (10−8 and 10−6 m) in the presence of 10% FBS. Means ±SD from two experiments.
RA inhibits LPS- and TNF-α-induced Stat-1 mRNA expression
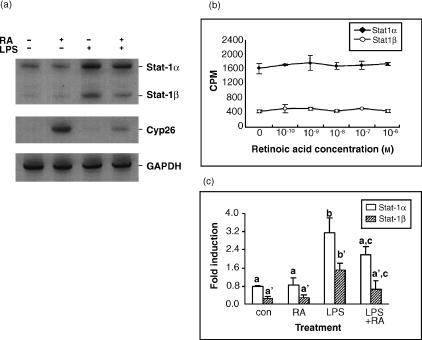
To determine whether the inhibitory effect of RA on STAT-1 protein also occurs at the mRNA level, total cellular RNA was isolated from cultured THP-1 cells and RT-PCR was performed to quantify Stat-1α and Stat-1β mRNAs, two isoforms derived by differential RNA processing.32 Quantitative isoform-specific RT-PCR was performed (see the Materials and methods section). A housekeeping gene, GAPDH was included as an internal control, and Cyp26, a gene of the cytochrome P450 family that is known as an enzyme for RA metabolism and to be inducible in the presence of RA,30 was included as a positive control to show the functionality of RA. The PCR products for these genes are shown in Fig. 3(a). Consistent with the results of the STAT-1 protein assays, RA had no apparent effect on Stat-1 gene expression at RA concentrations from 10−10 to 10−6 m (Fig. 3b). Stat-1 mRNA expression was up-regulated by LPS (Fig. 3a,c). Similar results were observed in cells treated with TNF-α and in those given the combination of LPS and TNF-α (data not shown). In THP-1 cells pretreated with RA, the induction of Stat-1 mRNA expression was reduced by about 50–70% (P < 0·02).
Figure 3.
Retinoic acid (RA) inhibits lipopolysaccharide (LPS)-induced Stat-1 gene expression at the mRNA level. THP-1 cells were pretreated with RA for 16 hr and then stimulated with LPS in the presence and absence of RA for 24 hr. Total RNA was isolated and 1 μg of total RNA was subjected to RT-PCR. (a) A representative RT-PCR analysis showing the 33P-labelled amplicons of Stat-1, Cyp26 and GAPDH genes in THP-1 cells treated with RA (10−8 m) and/or LPS. (b) Graph showing Stat1 gene expression (c.p.m. mRNA) in the presence of various concentrations of RA. THP-1 cells were treated with RA for 48 hr. Total RNA were isolated and subjected to RT-PCR to detect Stat-1 gene expression. The values represent mean ±SD of two experiments. (c) Regulation of Stat-1 gene expression by RA and LPS. The values indicate mean ±SD of four replicates. Stimulated groups were significantly different with non-stimulated control group (P < 0·02), and with stimuli plus RA groups (P < 0·02). Con, control.
RA enhances IFN-regulated STAT-1 protein expression and phosphorylation
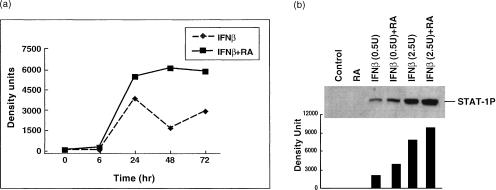
Next we tested the interaction of RA and IFNs in regulating STAT-1 protein level and phosphorylation status in THP-1 cells because IFNs are cytokines that are well documented to activate STAT-1 protein. As shown in Fig. 4, submaximal concentrations of IFN-β induced STAT-1 protein accumulation and phosphorylation significantly. Although RA alone did not significantly alter the amount of STAT-1 protein in THP-1 cells, RA had a synergistic regulatory effect on IFN-β-induced STAT-1 protein accumulation (Fig. 4a), and also increased the magnitude of IFN-β-evoked STAT-1 protein phosphorylation (Fig. 4b).
Figure 4.
Retinoic acid (RA) enhances the interferon-β (IFN-β)-induced STAT-1 expression and phosphorylation. THP-1 cells were pretreated with RA (10−8 m) for 16 hr, and then IFN-β (2·5 U/ml) was added to cells for the times indicated. (a) Time–course of total STAT-1 protein accumulation induced by IFN-β and RA (a Western blot analysis using anti-STAT-1 antibody and then assessed by densitometry). (b) Cells were treated with IFN-β (0·5 or 2·5 U/ml) for 2 hr after 16 hr RA pretreatment. Phosphorylated STAT-1 protein was detected by Western blot analysis (anti-PY701 antibody and densitometric analysis).
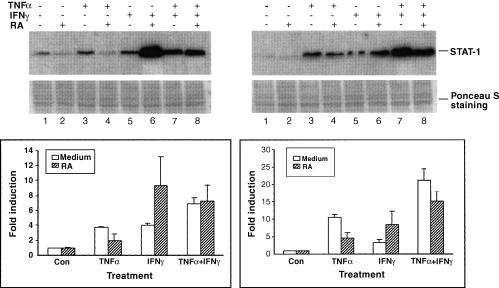
To explore further the opposing effects of RA on TNF-α-and IFN-induced STAT-1 activation and protein expression, it was of interest to determine whether these effects are likely to occur through independent mechanisms, which might be expected to be additive, and whether RA potentiates STAT-1 expression in THP-1 cells stimulated with IFN-γ, as for IFN-β. Thus, in this experiment THP-1 cells were stimulated with both TNF-α and IFN-γ, with and without RA pretreatment. As in the previous experiment using IFN-β, STAT-1 expression was induced by IFN-γ and treatment with RA augmented this induction (lanes 5 and 6 in Fig. 5). When TNF-α and IFN-γ were combined in stimulating THP-1 cells (lane 7), they produced a stronger induction of STAT-1 gene expression than did either cytokine alone (lane 3 and lane 5 compared with lane 7). In THP-1 cells treated with RA and the combination of TNF-α and IFN-γ (lane 8), the level of STAT-1 induction was intermediate to the levels in cells treated with RA plus TNF-α (lane 4) and in cells treated with IFNs and RA (lane 6). Similar phenomena were observed in cells treated with TNF-α, IFN-β and RA (data not shown). These results further imply that RA interacts with TNF-α and IFN signalling pathways in THP-1 cells through different, additive mechanisms.
Figure 5.
Opposing effects of retinoic acid (RA) on tumour necrosis factor-α (TNF-α) and interferon (IFN) -induced STAT-1 protein expression. THP-1 cells were pretreated with or without RA (10−8 m) for 16 hr and then treated with TNF-α (5 ng/ml) and/or IFN-γ (2·5 U/ml) for 24 and 48 hr in the presence and absence of fresh RA. Cells were harvested and Western blotting was performed to detect STAT-1 protein. The upper panels are Western blot analyses showing STAT-1 protein accumulation 24 and 48 hr after cytokine stimulation and Ponceau S staining of the membranes. The lower panels are the corresponding graphs showing the relative induction of STAT-1 protein (mean ±SD of two independent experiments).
RA inhibits STAT-1 DNA binding activity induced by cytokines
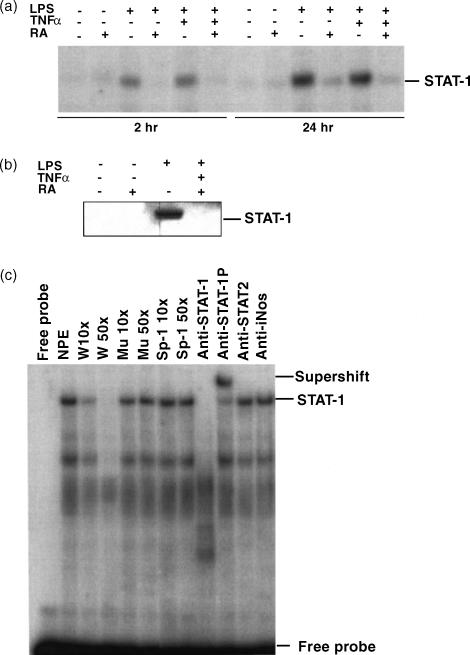
Since we have observed the inhibitory effect of RA on STAT-1 gene expression and activation, we asked if RA also inhibits STAT-1's DNA binding activity. THP-1 cells were pretreated with RA for 16 hr and then TNF-α and/or LPS were added to cells along with fresh RA. Nuclear protein extracts were prepared after 2 and 24 hr of incubation, and EMSA was performed. As shown in Fig. 6, STAT-1 binding activity to a STAT-1 consensus element (ISRE/GAS) was induced after stimulation of cells with TNF-α and/or LPS. Complex formation was detectable at 2 hr of treatment with LPS and LPS plus TNF-α, while induction by TNF-α was apparent after 24 hr of stimulation. Pretreatment of cells with RA strongly inhibited the induction of STAT-1 binding activity (Fig. 6a). Western blot analysis of nuclear protein extracts under these conditions confirmed the induction of STAT-1 PY701 and its reduction by RA (Fig. 6b). To confirm the specificity of the STAT-1 binding complex, competition assays were performed using an excess of unlabelled wild type and a mutant form of STAT-1 oligonucleotide (see the Materials and methods section), as well as a non-related fragment such as an Sp-1 binding site. A supershift assay was also performed using anti-STAT-1 antibodies and a non-related antibody (anti-iNOS antibody) as a control (Fig. 6c). The binding complex fully competed with the wild-type STAT-1 binding site, and the complex formation was specifically blocked by an anti-STAT-1 antibody specific for the protein's N terminus, the region required for dimer formation. The binding complex was supershifted by the antibody against STAT-1 PY701, indicating the specificity of the binding interaction between STAT-1 and the consensus STAT-1 binding site.
Figure 6.
Regulation of STAT-1 DNA binding activity by lipopolysaccharide (LPS), tumour necrosis factor-α (TNF-α) and retinoic acid (RA). Cells were pretreated with RA for 16 hr and then treated with LPS or/and TNF-α for 2 or 24 hr in the presence and absence of fresh RA. Nuclear protein was isolated and tested for binding activity with an ISRE/GAS DNA element. (a) EMSA showing the protein–DNA binding complex formation after cell stimulation. (b) Western blot of STAT-1 PY701 from nuclear proteins extracted from 24-hr-treated samples. (c) Competition assay and supershift assay showing the specificity of the binding complex. Nuclear protein extract used was from the 24 hr LPS plus TNF-α treated sample. Abbreviations used in figure: NPE, nuclear protein extract; W, wild-type; Mu, mutant type; NS, non-specific complex. Sp-1 was used as a non-related DNA competitor, and anti-iNOS (inducible nitric oxide synthase) antibody was used as a non-related antibody for supershift assay.
The inhibitory effect of RA on TNF-α/LPS-regulated STAT-1 activity may be mediated through the NFκB pathway
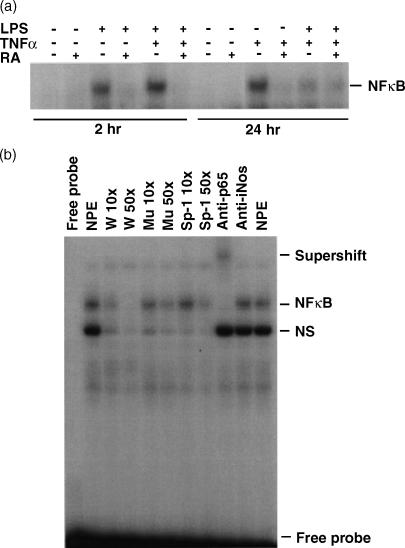
It is known that the bioactivities of LPS and TNF-α are evoked through the activation of the NFκB pathway.33,34 To determine whether RA impedes LPS/TNF-α signalling by blocking NFκB activation, we tested the nuclear NFκB binding activity of THP-1 cells by EMSA using the nuclear protein extracts described above. As shown in Fig. 7(a), LPS and TNF-α both induced NFκB binding activity. Similar to the STAT-1 binding activity to the STAT-1 DNA binding element described above, the NFκB DNA binding activity was rapidly induced in cells treated with LPS or LPS plus TNF-α, while TNF-α alone induced binding activity at 24 hr of stimulation. In cells pretreated with RA, the induction of NFκB DNA binding activity was significantly reduced to the control level. In competition and supershift experiments carried out to confirm the specificity of the complex, we observed a complete competition with the wild-type NFκB DNA binding site and a supershift of the binding complex when anti-p65 antibody was added (Fig. 7b).
Figure 7.
Retinoic acid (RA) inhibits nuclear factor κB (NFκB) binding activity induced by lipopolysaccharide (LPS) and tumour necrosis factor-α (TNF-α). THP-1 cell nuclear protein extracts, as described in Fig. 5, were also tested for NFκB activity. (a) EMSA showing binding to a NFκB binding element in cells treated with RA, LPS, TNF-α and their combinations. (b) Competition and supershift assays showing the specificity of the binding complex. The nuclear protein extract was from the 2 hr LPS plus TNF-α treated sample.
Discussion
The present study has demonstrated the differential regulatory effect of RA, a principal active metabolite of vitamin A, on cytokine-induced STAT-1 gene expression and protein activation. As we have observed in THP-1 cells, multiple diverse stimuli such as LPS, TNF-α and IFNs can significantly activate STAT-1 protein and increase its gene expression. While the activation response of STAT-1 to IFNs has been studied fairly extensively in several cell types,1,35 the STAT-1 response to LPS and TNF-α has received little attention. Because STAT-1 is considered a latent protein that is activated by phosphorylation, less attention has been paid to its regulation at the level of gene expression. Thus it was important in our studies to determine the response of THP-1 cells to RA alone, as well as to these various immune stimuli alone and in combination. RA alone has been reported to induce STAT-1 protein phosphorylation as well as gene expression in several promyelocytic leukaemia cell lines, such as human HL-60 and U937 cells and murine RAW264.7 cells, and primary acute promyelocytic leukaemia cells.7,27,36 Yang et al. also reported that in RA at 10−6 m could induce Stat-1 expression in THP-1 cells, even more potently than IFN-γ.37 However, in multiple experiments we did not detect any apparent alteration of STAT-1 expression and activation in THP-1 cells treated with RA alone, which was added in various doses and for various times. We also tested the inducible expression of STAT-1 in rat peritoneal macrophages and observed a similar response to that of THP-1 cells (Q. Chen, unpublished observations), indicating that the result we obtained in the present studies is not particular to THP-1 cells. LPS, TNF-α and IFNs were all strong activators of STAT-1 gene expression, protein level, and phosphorylation status in THP-1 cells, although the kinetics of response were different for each of these stimuli. With IFNs, STAT-1 protein was activated within seconds of stimulation, while LPS required hours to achieve its effect, and TNF-α induced activation more slowly. Despite RA alone having little, if any, effect on STAT-1, treatment with RA strongly (50–70%) inhibited the STAT-1 response induced by LPS, TNF-α or their combination, both in terms of STAT-1 expression (mRNA and protein) and activity (phosphorylation and STAT-1 DNA binding). Thus, under several experimental conditions, the effect of RA on STAT-1 regulation was stimulus-specific. While RA inhibited STAT-1 activation and gene expression induced by LPS and TNF-α, it enhanced the same processes induced by IFN. The nature of these differences requires further study. A similar phenomenon was observed in the regulation of IL-11 production in human alveolar and bronchial epithelial cells, in which RA regulated the expression of IL-11 in a stimulus-specific fashion, inhibiting IL-1-stimulated IL-11 production while augmenting transforming growth factor-β-stimulated IL-11 production.38 Since the concentrations of RA producing these effects are well within the physiological range, the results suggest that RA at levels obtainable physiologically could potentially be useful as a means to enhance antiviral/IFN-mediated responses, while limiting the often detrimental pro-inflammatory activity of LPS and TNF-α.39
To our knowledge, this work provides the first evidence for the negative regulatory activity of RA on TNF-α/LPS-induced STAT-1 gene expression and activation. However, several reports have demonstrated that RA could inhibit TNF-α/LPS-induced gene expression for other genes in other cell types. For instance, RA inhibited LPS-induced IL-12 production and tissue factor expression by monocyte/macrophage cells,40,41 and RA inhibited TNF-α-induced vascular cell adhesion molecule-1 expression in endothelial cells.42 Mechanistic studies have indicated that the negative regulation of RA on the regulation of other genes may be at least partially mediated through inhibition of the transcription potential of NFκB or activator protein 1 (AP-1).40,42,43 RA could inhibit NFκB or AP-1 activity by the direct interaction of RXR with NFκB or AP-1 proteins, by reducing or preventing their DNA binding ability, or by the competitive recruitment or sequestration of nuclear co-activators.40,43 In our experiments, treatment of THP-1 cells with RA inhibited the NFκB binding activity induced by either LPS or TNF-α. The ability of RA to regulate negatively the LPS- and TNF-α-induced cell activation may help to explain the anti-inflammatory effect that is often, but not consistently, observed for RA and related retinoids. Further studies are required to understand fully the cross-talk between the RA and NFκB signalling pathways, which may provide insight concerning the regulatory mechanisms of RA related to inflammation. The regulation of STAT-1 may also differ significantly among cell types, or with the particular cytokine combination to which cells are exposed. It is interesting that, in a macrophage cell line, Bac1.2F5, stimulation with LPS alone did not induce significant STAT-1 activation and expression, in contrast to our results with THP-1 cells. However, pretreatment of Bac1.2F5 cells with LPS for 1–3 hr prior to stimulation with IFN-γ potentiated STAT-1 activity induced by IFN-γ, while longer-term treatments with LPS were inhibitory.44 These results serve to emphasize that the same stimuli (e.g. LPS and IFN-γ) may act co-operatively or opposingly, depending on timing or other factors. In our studies with THP-1 cells, both LPS/TNF-α (alone and combined) and IFNs strongly elicited STAT-1 expression and activation, but a single hormonal regulator, RA, conversely regulated the STAT-1 responses initiated by these different stimuli. It would appear that, within the pathway leading to STAT-1 activation, there are multiple points of regulation, or points of divergence/convergence, that are regulated differently depending on the presence of retinoid hormone and the initial cytokine/receptor interaction.
In conclusion, our research has demonstrated the differential regulatory function of RA on STAT-1 gene expression and activity induced by two groups of activating factors, LPS/TNF-α and IFNs. Further studies of the mechanisms involved in the regulation by RA of cell signalling should help to understand the molecular targets and signalling events leading to the control of cell growth and differentiation, and in finding optimal therapeutic modalities for the treatment of immune diseases and cancer.
Acknowledgments
This work was supported by NIH DK-41479, and funds from the Howard Heinz Endowment.
References
- 1.Darnell JE., Jr. STATs and gene regulation. Science. 1997;277:1630–5. doi: 10.1126/science.277.5332.1630. [DOI] [PubMed] [Google Scholar]
- 2.Coffer PJ, Koenderman L, de Groot RP. The role of STATs in myeloid differentiation and leukemia. Oncogene. 2000;19:2511–22. doi: 10.1038/sj.onc.1203479. [DOI] [PubMed] [Google Scholar]
- 3.Ramana CV, Chatterjee-Kishore M, Nguyen H, Stark GR. Complex roles of Stat1 in regulating gene expression. Oncogene. 2000;19:2619–27. doi: 10.1038/sj.onc.1203525. [DOI] [PubMed] [Google Scholar]
- 4.Decker T, Kovarik P. Serine phosphorylation of STATs. Oncogene. 2000;19:2628–37. doi: 10.1038/sj.onc.1203481. [DOI] [PubMed] [Google Scholar]
- 5.Wen Z, Zhong Z, Darnell JE. Maximal activation of transcription by Stat1 and Stat3 requires both tyrosine and serine phosphorylation. Cell. 1995;82:241–50. doi: 10.1016/0092-8674(95)90311-9. [DOI] [PubMed] [Google Scholar]
- 6.Kolla V, Weihua X, Kalvakolanu DV. Modulation of interferon action by retinoids. Induction of murine STAT1 gene expression by retinoic acid. J Biol Chem. 1997;272:9742–8. doi: 10.1074/jbc.272.15.9742. [DOI] [PubMed] [Google Scholar]
- 7.Gianni M, Terao M, Fortino I, LiCalzi M, Viggiano V, Barbui T, Rambaldi A, Garattini E. Stat1 is induced and activated by all-trans retinoic acid in acute promyelocytic leukemia cells. Blood. 1997;89:1001–12. [PubMed] [Google Scholar]
- 8.Sadowski HB, Shuai K, Darnell JE, Gilman MZ. A common nuclear signal transduction pathway activated by growth factor and cytokine receptors. Science. 1993;261:1739–44. doi: 10.1126/science.8397445. [DOI] [PubMed] [Google Scholar]
- 9.Schindler C, Darnell JE. Transcriptional responses to polypeptide ligands: the JAK-STAT pathway. Annu Rev Biochem. 1995;64:621–51. doi: 10.1146/annurev.bi.64.070195.003201. [DOI] [PubMed] [Google Scholar]
- 10.Goh KC, Haque SJ, Williams BR. p38 MAP kinase is required for STAT1 serine phosphorylation and transcriptional activation induced by interferons. EMBO J. 1999;18:5601–8. doi: 10.1093/emboj/18.20.5601. [DOI] [PMC free article] [PubMed] [Google Scholar]
- 11.Corssmit EP, de Metz J, Sauerwein HP, Romijn JA. Biologic responses to IFN-alpha administration in humans. J Interferon Cytokine Res. 2000;20:1039–47. doi: 10.1089/107999000750053690. [DOI] [PubMed] [Google Scholar]
- 12.Edwards L. The interferons. Dermatol Clin. 2001;19:139–46. doi: 10.1016/s0733-8635(05)70235-7. ix. [DOI] [PubMed] [Google Scholar]
- 13.Aukrust P, Muller F, Ueland T, Svardal AM, Berge RK, Froland SS. Decreased vitamin A levels in common variable immunodeficiency: vitamin A supplementation in vivo enhances immunoglobulin production and downregulates inflammatory responses. Eur J Clin Invest. 2000;30:252–9. doi: 10.1046/j.1365-2362.2000.00619.x. [DOI] [PubMed] [Google Scholar]
- 14.Ross AC. Vitamin A, retinoids and immune responses. In: Livrea MA, editor. Vitamin A and Retinoids: an Update of Biological Aspects and Clinical Applications. Basel: Birkhauser Verlag; 2000. pp. 83–95. [Google Scholar]
- 15.Ross AC, Zolfaghari R, Weisz J. Vitamin A. recent advances in the biotransformation, transport, and metabolism of retinoids. Curr Opin Gastroenterol. 2001;17:184–92. doi: 10.1097/00001574-200103000-00015. [DOI] [PubMed] [Google Scholar]
- 16.Evans TR, Kaye SB. Retinoids: present role and future potential. Br J Cancer. 1999;80:1–8. doi: 10.1038/sj.bjc.6690312. [DOI] [PMC free article] [PubMed] [Google Scholar]
- 17.Nagy L, Thomazy VA, Heyman RA, Davies PJ. Retinoid-induced apoptosis in normal and neoplastic tissues. Cell Death Differ. 1998;5:11–19. doi: 10.1038/sj.cdd.4400337. [DOI] [PubMed] [Google Scholar]
- 18.Mathew JS, Sharma RP. Effect of all-trans-retinoic acid on cytokine production in a murine macrophage cell line. Int J Immunopharmacol. 2000;22:693–706. doi: 10.1016/s0192-0561(00)00032-1. [DOI] [PubMed] [Google Scholar]
- 19.Datta PK, Lianos EA. Retinoic acids inhibit inducible nitric oxide synthase expression in mesangial cells. Kidney Int. 1999;56:486–93. doi: 10.1046/j.1523-1755.1999.00576.x. [DOI] [PubMed] [Google Scholar]
- 20.Austenaa LMI, Ross AC. Potentiation of interferon-γ-stimulated nitric oxide production by retinoic acid in the murine macrophage-like cell line RAW 264.7. J Leuk Biol. 2001;70:121–9. [PubMed] [Google Scholar]
- 21.Lippman SM, Lotan R, Schleuniger U. Retinoid-interferon therapy of solid tumors. Int J Cancer. 1997;70:481–3. doi: 10.1002/(sici)1097-0215(19970207)70:4<481::aid-ijc20>3.0.co;2-h. [DOI] [PubMed] [Google Scholar]
- 22.Dmitrovsky E, Bosl GJ. Active cancer therapy combining 13-cis-retinoic acid with interferon-alpha. J Natl Cancer Inst. 1992;84:218–19. doi: 10.1093/jnci/84.4.218. [DOI] [PubMed] [Google Scholar]
- 23.Chofflon M. Recombinant human interferon beta in relapsing-remitting multiple sclerosis: a review of the major clinical trials. Eur J Neurol. 2000;7:369–80. doi: 10.1046/j.1468-1331.2000.00057.x. [DOI] [PubMed] [Google Scholar]
- 24.Takizawa F, Tsuji S, Nagasawa S. Enhancement of macrophage phagocytosis upon iC3b deposition on apoptotic cells. FEBS Lett. 1996;397:269–72. doi: 10.1016/s0014-5793(96)01197-0. [DOI] [PubMed] [Google Scholar]
- 25.Defacque H, Dornand J, Commes T, Cabane S, Sevilla C, Marti J. Different combinations of retinoids and vitamin D3 analogs efficiently promote growth inhibition and differentiation of myelomonocytic leukemia cell lines. J Pharmacol Exp Ther. 1994;271:193–9. [PubMed] [Google Scholar]
- 26.Matikainen S, Hurme M. Comparison of retinoic acid and phorbol myristate acetate as inducers of monocytic differentiation. Int J Cancer. 1994;57:98–103. doi: 10.1002/ijc.2910570118. [DOI] [PubMed] [Google Scholar]
- 27.Matikainen S, Ronni T, Lehtonen A, Sareneva T, Melen K, Nordling S, Levy DE, Julkunen I. Retinoic acid induces signal transducer and activator of transcription (STAT) 1, STAT2, and p48 expression in myeloid leukemia cells and enhances their responsiveness to interferons. Cell Growth Differ. 1997;8:687–98. [PubMed] [Google Scholar]
- 28.Chen Q, DeFrances MC, Zarnegar R. Induction of met proto-oncogene (hepatocyte growth factor receptor) expression during human monocyte-macrophage differentiation. Cell Growth Differ. 1996;7:821–32. [PubMed] [Google Scholar]
- 29.Sambrook J, Fritsch EF, Maniatis T. Molecular Cloning a Laboratory Manual. 2. Cold Spring Harbor: Cold Spring Harbor Laboratory Press; 1989. [Google Scholar]
- 30.Yamamoto Y, Zolfaghari R, Ross AC. Regulation of CYP26 (cytochrome P450RAI) mRNA expression and retinoic acid metabolism by retinoids and dietary vitamin A in liver of mice and rats. Faseb J. 2000;14:2119–27. doi: 10.1096/fj.00-0061com. [DOI] [PubMed] [Google Scholar]
- 31.Seol DW, Chen Q, Smith ML, Zarnegar R. Regulation of the c-met proto-oncogene promoter by p53. J Biol Chem. 1999;274:3565–72. doi: 10.1074/jbc.274.6.3565. [DOI] [PubMed] [Google Scholar]
- 32.Schindler C, Fu XY, Improta T, Aebersold R, Darnell JE. Proteins of transcription factor ISGF-3: one gene encodes the 91-and 84-kDa ISGF-3 proteins that are activated by interferon alpha. Proc Natl Acad Sci USA. 1992;89:7836–9. doi: 10.1073/pnas.89.16.7836. [DOI] [PMC free article] [PubMed] [Google Scholar]
- 33.Karin M. How NF-kappaB is activated: the role of the IkappaB kinase (IKK) complex. Oncogene. 1999;18:6867–74. doi: 10.1038/sj.onc.1203219. [DOI] [PubMed] [Google Scholar]
- 34.Ferlito M, Romanenko OG, Ashton S, Squadrito F, Halushka PV, Cook JA. Effect of cross-tolerance between endotoxin and TNF-alpha or IL-1beta on cellular signaling and mediator production. J Leukoc Biol. 2001;70:821–9. [PubMed] [Google Scholar]
- 35.Bromberg J, Darnell JE., Jr. The role of STATs in transcriptional control and their impact on cellular function. Oncogene. 2000;19:2468–73. doi: 10.1038/sj.onc.1203476. [DOI] [PubMed] [Google Scholar]
- 36.Kumar R, Korutla L. Growth inhibition of human acute promyelocytic leukemia NB-4 cells by interferons and all-trans retinoic acid: trans-modulation of inducible gene expression pathways. Anticancer Res. 1995;15:353–60. [PubMed] [Google Scholar]
- 37.Yang JB, Duan ZJ, Yao W, et al. Synergistic transcriptional activation of human Acyl-coenzyme A: cholesterol acyltransferase-1 gene by interferon-gamma and all-trans-retinoic acid THP-1 cells. J Biol Chem. 2001;276:20989–98. doi: 10.1074/jbc.M011488200. [DOI] [PubMed] [Google Scholar]
- 38.Elias JA, Zheng T, Einarsson O, Landry M, Trow T, Rebert N, Panuska J. Epithelial interleukin-11. Regulation by cytokines, respiratory syncytial virus, and retinoic acid. J Biol Chem. 1994;269:22261–8. [PubMed] [Google Scholar]
- 39.Paludan SR. Synergistic action of pro-inflammatory agents: cellular and molecular aspects. J Leukoc Biol. 2000;67:18–25. doi: 10.1002/jlb.67.1.18. [DOI] [PubMed] [Google Scholar]
- 40.Na SY, Kang BY, Chung SW, et al. Retinoids inhibit interleukin-12 production in macrophages through physical associations of retinoid X receptor and NFkappaB. J Biol Chem. 1999;274:7674–80. doi: 10.1074/jbc.274.12.7674. [DOI] [PubMed] [Google Scholar]
- 41.Oeth P, Yao J, Fan ST, Mackman N. Retinoic acid selectively inhibits lipopolysaccharide induction of tissue factor gene expression in human monocytes. Blood. 1998;91:2857–65. [PubMed] [Google Scholar]
- 42.Gille J, Paxton LL, Lawley TJ, Caughman SW, Swerlick RA. Retinoic acid inhibits the regulated expression of vascular cell adhesion molecule-1 by cultured dermal microvascular endothelial cells. J Clin Invest. 1997;99:492–500. doi: 10.1172/JCI119184. [DOI] [PMC free article] [PubMed] [Google Scholar]
- 43.Diaz BV, Lenoir MC, Ladoux A, Frelin C, Demarchez M, Michel S. Regulation of vascular endothelial growth factor expression in human keratinocytes by retinoids. J Biol Chem. 2000;275:642–50. doi: 10.1074/jbc.275.1.642. [DOI] [PubMed] [Google Scholar]
- 44.Stoiber D, Kovarik P, Cohney S, Johnston JA, Steinlein P, Decker T. Lipopolysaccharide induces in macrophages the synthesis of the suppressor of cytokine signaling 3 and suppresses signal transduction in response to the activating factor IFN-gamma. J Immunol. 1999;163:2640–7. [PubMed] [Google Scholar]


