Abstract
The transgenic T-cell receptor in mouse TEa CD4+ lymphocytes recognizes an endogenous peptide, Eα52-68, presented in the context of the major histocompatibility complex class II molecule I-Ab. In response to an optimal peptide concentration TEa cells enter the cell cycle and proliferate. However, a single exposure to high doses of the specific peptide diminished cell expansion upon subsequent restimulation. This hyporesponsive, or anergic, phenotype can still be detected after multiple restimulations indicating that the hyporesponsiveness persists despite cell division and it was inherited by daughter cells. Furthermore, we demonstrated that this hypoproliferative response is associated with high p27Kip1 and cyclin E protein levels, and reduced intracellular interleukin-2 (IL-2) expression. Addition of exogenous IL-2 was required to reset p27Kip1 levels in the progeny derived from hyporesponsive TEa cells. Thus, we have established antigen dose-dependent induction of a reversible, inheritable (i.e. epigenetic) phenotype and we have identified at least three components of the network of interactions: p27Kip1 cyclin E, and IL-2 expression.
Introduction
Mature CD4+ T cells are first activated via engagement of their T-cell receptor (TCR) with an antigen presented in the context of major histocompatibility complex (MHC) class II molecules on antigen-presenting cells (APC).1 Stimulation through the TCR triggers a series of events that culminate in the expression of the interleukin-2 receptor (IL-2R) and competence to respond to interleukin-2 (IL-2). Binding of IL-2 to its receptor promotes the activated T cells to enter the cell cycle and, eventually, to proliferate. When T cells become stimulated in the absence of IL-2 production, a state of T-cell anergy ensues, which is defined as the inability of a viable T cell to display certain functional responses, such as proliferation or IL-2 production, under otherwise stimulatory conditions.
The series of events involved in T lymphocyte cell cycle entry and progression through the G1 phase are correlated with the status of two families of proteins known as cyclins and cyclin-dependent kinases (Cdks).2–4 Activation of Cdks is initiated through binding with distinct cyclin proteins (i.e. cyclin E, a G1 cyclin) and each phase of the cell cycle displays a particular set of activated Cdks (i.e. cyclin E/Cdk2 near the G1/S transition). Regulation of activated cyclin E/Cdk2 complexes is mediated by a member of the p21 family of cyclin-dependent kinase inhibitors (or CdkIs), namely p27Kip1.5,6 In quiescent T cells, p27Kip1 protein levels are in excess of cyclin/Cdk complexes and the transition from G1 to S phase is inhibited. When cells are exposed to exogenous IL-2, p27Kip1 levels decrease substantially allowing cyclin/Cdk activation and cell-cycle progression.7–10 In this study, we present evidence that supports a similar role for the cyclin-dependent kinase inhibitor p27Kip1 in the blockade of clonal expansion in anergic T cells. Indeed, we were able to observe a correlation between steady state levels of p27Kip1 and endogenous expression of IL-2 in the progeny of T cells exposed to relatively high doses of antigen. These results suggest that downstream events after IL-2 expression, decisive to reduce p27Kip1 protein levels during normal T-cell activation, might also be operating to control cell proliferation in high dose antigen suppression of CD4+ cells.
Materials and Methods
Mice
A male TCR transgenic (tg) TEa (A.Y.R) mouse in C57BL/6J(B6) (I-Ab, I-E−) background were bred with wild type B6 female mice (Charles River Laboratory, Wilmington, MA) in a specific pathogen-free (SPF) facility at the University of Washington. The tg TCR in TEa mouse lymphocytes recognizes a peptide representing residues 52–68 of the I-Eα chain (Eα peptide), bound to class II I-Ab molecules. The progenies were genotyped to identify the transgene positive mice using polymerase chain reaction (PCR) as previously described.11 The transgene-bearing T cells were visualized using antibodies specific for the transgene-encoded Vα2 element.11
Source of antigenic peptide
The peptide Eα52–66 (ASFEAQGALANIAVD), spEa, was synthesized and purified as previously indicated.11 Alternatively, the peptide was commercially ordered (W.M. Keck Facility, Yale University, New Haven, CT), purified to greater than 95% purity by high pressure liquid chromatography and the homogeneity of the composition confirmed by mass spectrometry. Each peptide preparation was tested for optimal biological activity before being used for experiments.
Antibodies and reagents
Mouse CD4+ T-cell subset enrichment columns and recombinant murine IL-2 were purchased from R & D Systems (Minneapolis, MN). Anti-mouse Vα-2-fluorescein isothiocyanate (Vα-2-FITC) Clone B20·1, anti-bromodeoxyuridine-FITC (BrdU-FITC) clone 3D4, anti-mouse CD4-phycoerythrin (PE), CD3ε-PE, biotinylated anti-mouse IL-2 clone JES6-544, biotinylated anti-mouse immunoglobulin G2b (IgG2b), purified anti-mouse CD16/CD32 (FcγIII/II receptor), and anti-mouse p27Kip1 monoclonal antibodies (mAbs), monensin, streptavidin–PE, streptavidin–Cy–chrome (CY-5) conjugates, and annexin V–FITC were all purchased from Pharmingen (San Diego, CA). Affinity purified polyclonal antibodies against anticyclin E were generated as previously described.12 Other reagents used and their sources were as follows: Ficoll-Na Diatrizoate (LSM Lymphocyte Separation Medium, ICN Biomedicals Inc., Aurora, OH); propidium iodide (PI; Sigma Chemical, St. Louis, MO); KHCO3, NH4Cl, and disodium ethylenediaminetetraacetic acid (Na2-EDTA; Fisher Scientific, Pittsburg, PA); enhanced chemoluminescence detection system and X-ray films (Amersham, Piscataway, NJ). The YAe monoclonal antibody was purified from supernatants of YAe hybridoma13 using the ImmunoPure (A/G) IgG purification kit (Pierce, Rockford, IL).
Establishment of TCR tg CD4+ T lymphocytes (TEa cells)
TEa cells were prepared from a pool of peripheral lymph nodes (axillary, brachial, cervical, mesenteric, and inguinal) and spleens of 6–8 week old TEa mice. Single cell suspensions were obtained by pressing of lymph nodes and spleens between two frosted sterile microslides, and filtrating through 100 µm cell strainers (Becton Dickinson, Franklin Lakes, NJ). After the depletion of red blood cells, CD4+ T cells were isolated by passing the single-cell suspension through mouse T-cell CD4 subset columns (negative selection) following manufacturer's specifications (R & D Systems). By flow cytometric analysis, more than 95% of the passing cells were expressing the Vα + Vβ transgenic receptor (data not shown).
Freshly isolated TEa cells were cultured at a cell density of 0·5 × 106 cells/ml in complete culture medium (RPMI-1640 supplemented by 5% fetal bovine serum (FBS), 2 mm l-glutamine, 1 mm sodium pyruvate, 10 mm HEPES buffer,100 U/ml penicillin, 100 U/ml streptomycin, and 50 µm 2-mercaptoethanol; all from BioWhittaker, Walkersville, MD). In addition to the medium, the cell culture contained irradiated (3400 rad) B6 splenocytes (5 : 1 ratio wild type splenocytes to tg cells) and 1 µg/ml of spEa. The antigenic dose of 1 µg/ml maintained cells in a state of responsiveness to the same antigen concentration after repeated series of stimulation. We used this dose of spEa as the optimal stimulatory concentration for the activation and continuous propagation of TEa cells ex vivo. TEa cells cultured in 1 µg/ml sPEa are referred to as ‘controls’.
Cells were cultured in 75 cm2 tissue culture flasks (Costar Corporation, Cambridge, MA) in a final volume of 40 ml per flask. After 7 days of culture, viable cells were harvested by Ficoll density gradient centrifugation (passage 1). Similar 7 day cycles were repeated 2 more times (passages 2 and 3, with at least two to more cell doublings). On day 7 of the third passage (P3), the viable TEa cells were aliquoted and stored in liquid N2.
At different intervals, frozen aliquots of P3 TEa cells were thawed, washed, and cultured in the conditions already described. After 7 days in culture, viable cells (P4) were recovered by Ficoll centrifugation and 10 × 106 tg TEa cells were used to seed a new passage (P5) as mentioned. The remaining viable P4 TEa cells were used in experiments described in this study. The same procedure was applied at the end of 7 day cycles of passages P5 to P6. Absence of residual wild type splenocytes was confirmed by flow cytometric analysis before setting a new passage (data not shown).
Induction of the anergic phenotype
In the primary challenge, TEa cells were resuspended at 0·3 × 106/ml in complete medium containing the indicated amounts of spEa (see legend in Fig. 1a) with a 5 : 1 ratio of irradiated wild type splenocytes to tg cells. Cell suspensions were incubated in 24-well plates (Costar Corporation, Cambridge, MA) at 37° in 5% CO2. Preliminary assays were performed to avoid over-population of the culture wells and accumulation of toxic metabolites during the in vitro experiments (R. Kong and E. J. Firpo, unpublished observations).
Figure 1.
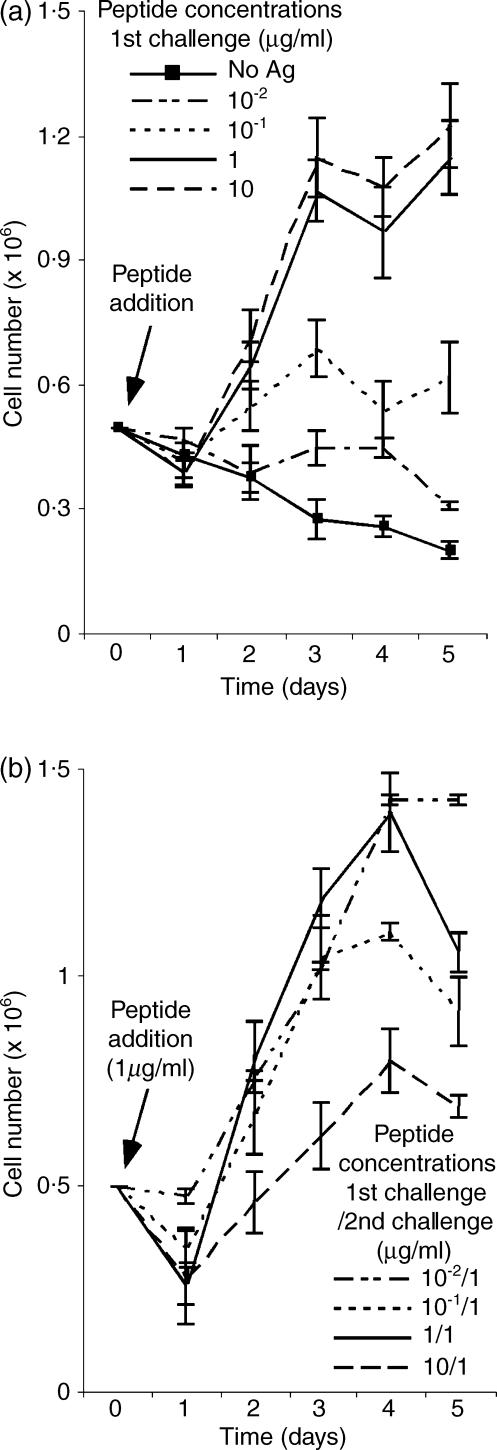
Dose-dependent induction of TEa cell hyporesponsiveness. (a) Primary challenge. Viable TEa cells obtained from early frozen stocks of in vitro cultures, were stimulated with the indicated concentrations of spEa in the presence of a 5 : 1 ratio of splenocytes to transgenic cells. After a variety of empirical observations, we chose these conditions because they adequately display both the effect of antigen dose and ratio of TEa cells to APC on the phenotype described in this report. At daily intervals after stimulation, viable cell counts were determined and the data plotted as the mean values of five or more experiment ± SD. (b) secondary challenge. Viable TEa cells, recovered from day 7 after the primary challenge step, were restimulated with 1 µg/ml of spEa in the presence of a 5 : 1 ratio of splenocytes to transgenic cells. At each 24-hr interval after stimulation, the total number of viable cells were determined and represented as the mean values of five or more experiments ± SD.
At the end of the primary challenge (7 days), viable cells were harvested by Ficoll centrifugation, resuspended at equal densities and restimulated using 1 µg/ml spEa and a 5 : 1 ratio of irradiated splenocytes to tg cells in the culture conditions already described.
Staining and flow cytometry analysis
All antibodies in this work were used at a final concentration of 1 µg/106 cells and all antibody stains were performed at 4°. Stained cells were analysed on a FACScan flow cytometer using CellQuest software (Becton Dickinson, Mountain View, CA). For single or multicolour analysis, suspension of viable TEa cells harvested after Ficoll centrifugation were incubated for 20 min in 2% HBSS staining buffer (1× red phenol Hank's balanced salt solution, 2% FBS, 25 mm HEPES) containing the indicated fluorochrome-conjugated mAbs. Labelled cells were then washed once and the cell pellets resuspended with staining buffer for fluorescence-activated cell sorting (FACS) analysis. YAe purified mAb was appropriately diluted in staining buffer before added to cells previously incubated for 15 min with anti-mouse CD16/CD32. The cell suspension was then incubated for an additional 20 min, washed once and resuspended in 2% HBSS staining buffer containing biotinylated anti-mouse IgG2b mAb. After 15 min on ice, biotinylated-YAe cells were labelled with streptavidin–PE for 10 min, washed once, and resuspended in stained buffer for FACS analysis.
For fluorescence-conjugated emission analysis, a polygonal gating was drawn selecting only live cells based on their level of auto-fluorescence in forward scatter (x-axis, arbitrary units) versus side scatter (y-axis, arbitrary units).14 For the quantitation of apoptosis, viable TEa cells were incubated with FITC-labelled annexin V protein, following protocols supplied by the manufacturer. Analysis of nuclear DNA content by PI staining was performed as described.7 For detection of intracellular IL-2 at days 2 and 3 of a secondary challenge, TEa cells (106) were incubated for 7 hr in the presence of 3 µm concentrations of the protein transport inhibitor monensin. After this incubation time, viable cells were collected after Ficoll centrifugation, washed once with ice-cold 2% HBSS and resuspended in Cytofix/Cytoperm solution (Pharmingen). Fixed cells were then centrifugated, resuspended in 1× Perm/Wash buffer solution (Pharmingen) containing Vα-2–FITC and biotinylated IL-2 mAbs, and incubated for 20 min. After washing once, cell pellets were resuspended in 1× Perm/Wash buffer solution containing 1 µg/ml streptavidin-CY-5 and incubated for 20 min in ice before FACS analysis. To determine the background level of intracellular IL-2 accumulation in non-activated cells, control cells from the primary challenge were incubated in parallel without the addition of antigenic peptide for similar intervals. For BrdU incorporation cultures of activated TEa cells (1·5 × 106)) were incubated in the presence of 0·1 mm BrdU for 4 hr after 42 hr of the start of a secondary challenge. Incorporation of BrdU was detected by FACS analysis following the manufacturer's instructions. Statistics were calculated from the polygonal gates marked in the figures.
Western blot analysis
For each sample to be immunoblotted, 1–2 × 10⁶ viable cells were collected and the resulting cell pellets were lysed in 0·1 ml of NP-40 buffer (50 mm Tris–HCl (pH 7·4), 100 mm NaCl, 0·5% NP-40, 5 mm EDTA, 10% glycerol, 1 mm phenylmethylsulphonyl fluoride, 10 µg of aprotinin per ml, 25 µg each of leupeptin, antipepsin, and soybean trypsin inhibitor STI per ml, 50 mm NaF, 0·5 mm sodium orthovanadate, 80 mmβ-glycerophosphate, and 5 µm mycrocistin) at 4°. Cell lysates were sonicated for 30 s, centrifuged at 21 000 g for 10 min at 4°, and supernatants stored at −70° until they were ready to be loaded on gels. Protein concentrations were determined by using the Bio-Rad protein assay. Immunoblotting and immunoprecipitations were performed as described.7 Optical densities of immunoblotted bands were determined with Kodak 1D Image Analyzer software (version 3.0).
Results
Dose-dependent induction of an inheritable hypoproliferative response in TEa cells
After spEa peptide exposure, TEa cells displayed a dose–response curve, in which higher amounts of peptide were accompanied by an increase in cell proliferation (Fig. 1a). In the absence of peptide, the number of viable TEa cells declined steadily over the duration of the experiment and few live cells were detected after 7 days in culture. Although peptide doses as low as 10−1 µg/ml of spEa promoted proliferation, only concentrations of 1 µg/ml or higher supported sustained expansion of T cells. We next investigated whether a hypoproliferative response could be observed in TEa cells after peptide treatment. Viable cells recovered from each peptide concentration of the primary challenge were restimulated (secondary challenge) with 1 µg/ml of spEa (Fig. 1b). Under these conditions, a diminished cell count in viable cells was observed in TEa cells previously treated with 10 µg/ml of spEa (compared 10/1 in Fig. 1b). In contrast, cells exposed to low amount of peptide during the primary challenge (i.e. 10−1/1 and 10−2/1) were able to mount a strong response comparable to that of the control.
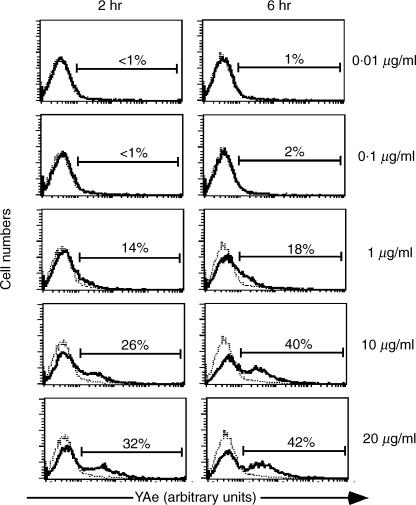
Since the exogenous loading of antigenic peptides on live APCs is known to be an inefficient process,15 we decided to investigate the relative abundance of spEa bound to class II MHC molecules on APC under identical conditions (Fig. 2). The YAe mAb used for these experiments detects the MHC class II bound form of Eα peptide.15,16 B6 splenocytes, cultured in the presence of peptide concentrations as indicated in the legend of Fig. 1(a), were harvested after 2 and 6 hr of incubation. Cells cultured in the absence of antigenic peptide were used as background controls.
Figure 2.
Saturation of peptide bound to class II MHC molecules. Irradiated B6 splenocytes were incubated with the indicated concentrations of spEa using the same culture conditions mentioned in the legend to Fig. 1(a) but without the addition of TEa cells. Splenocytes cultured in the absence of peptide were used as background controls. At the time points cells were harvested by Ficoll centrifugation and labelled with YAe mAb. The histograms show the expression of bound spEa peptide to MHC II complexes on the surface of APCs measured by the relative YAe-PE fluorescence (x-axis, arbitrary units) versus relative cell numbers. Percentages are expressed as the amount of YAe cells above the background. Dot plot histograms are one representative experiment from three separate experiments. (- - - no peptide; — plus peptide).
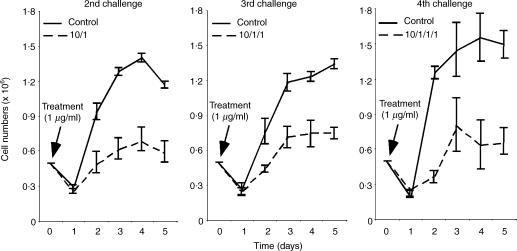
Peptide levels below 1 µg/ml resulting in low numbers of APCs carrying detectable peptide–MHC at both time points. These results correlated with the diminished TEa cell counts observed at these peptide concentrations (see 10−2 and 10−1 in Fig. 1a). In contrast, concentrations of 10 µg/ml and above of spEa resulted in a higher proportion of YAe positive APCs compare to 1 µg/ml at these two time points. This result is in agreement with the elevated level of proliferation induced by 10 µg/ml compared to the control [compare 1 versus 10 in Fig. 1(a)]. Moreover, the differences in YAe positive cells between 10 and 20 µg/ml, were minimal, suggesting a saturation state of the available APC that could express bound peptide–MHC complexes. Since the hypoproliferative response was observed with 10-fold more (10 µg/ml) than the optimal concentration (1 µg/ml), this dose was used to exemplify the suppressive effects of high dose antigen exposure in TEa cells. Specifically, we examined the persistence of hyporesponsiveness in high-dose antigen pretreated cells by restimulated them for three consecutive times after the initial primary challenge (Fig. 3). The diminished cell proliferation was still observed even during the last challenge (see 4th challenge in Fig. 3). These results indicated that the events promoting hyporesponsiveness in TEa cells were not short-lived and inherited by the progeny.
Figure 3.
Inherited hyporesponsiveness by the progeny of high dose peptide-activated TEa cells. TEa cells pretreated with 10 µg/ml of spEa were subsequently exposed to 1 µg/ml of spEa (2nd challenge). After 7 days in culture, viable cells were harvested and exposed to the same amount of antigenic stimulation (3rd challenge). After 7 days in culture, viable cells were stimulated again (4th challenge) with the same concentration of peptide as in the previous challenges. Control cells were cultured simultaneously under the same activating conditions to indicate normal levels of proliferation in each of the challenges. Data are plotted as the average mean values of three or more separate experiments ± SD.
Peptide-induced TEa hyporesponsiveness resembles anergy
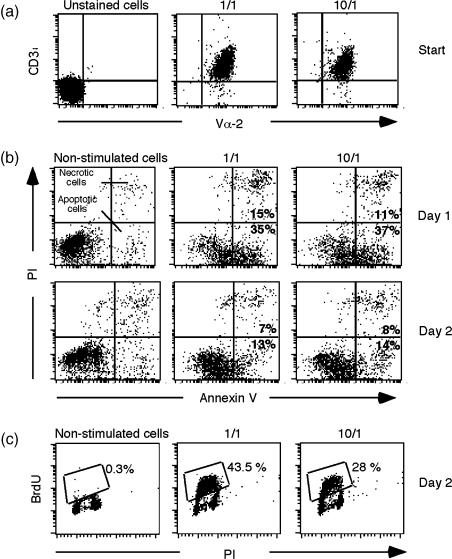
A mechanism that could account for a weak response of 10 µg/ml of spEa pretreated cells would be a reduction in the cell-surface expression of the tg TCR.17,18 To investigate changes in the surface expression of tg TCRs we measured the cell-surface expression of Vα-2 in CD3ε positive cells during a secondary challenge (Fig. 4a). Our results indicated no significant differences in fluorescence intensity of Vα-2/CD3ε positive cells between the control and high dose pretreated cells prior to the start of a secondary challenge. Thus, the data are in agreement with other studies indicating that alteration in steady state levels of surface TCR is not necessary for the in vitro or in vivo induction of anergy.19–21
Figure 4.
TEa hypoproliferation resembles anergy. (a) Ttransgenic Vα-2 TCR expression. Dot-plots of transgenic TCRs (anti-Vα-2–FITC) fluorescence (x-axis, arbitrary units) versus CD3ε–PE (y-axis, arbitrary units) of control (1/1) and high dose pretreated cells (10/1) at the start of a secondary challenge (start = before peptide addition). The panels show one representative experiment from four independent experiments. (b) poptotic rates. Viable cells, harvested from days 1 and 2 of a secondary challenge, were collected from nonstimulated cells (no peptide), control (1/1) and 10 µg/ml spEa and stained with FITC-conjugated annexin V protein. Dot-plots of annexin V-FITC (x-axis, arbitrary units) fluorescence versus DNA content (PI incorporation, y-axis, arbitrary units) are shown. Percentages of necrotic (FITC-positive, PI-positive) and apoptotic (FITC-positive, PI-negative) cells were counted and the results indicated in the respective quadrants (see figure). Data shown are one representative experiment from three independent experiments. (c) TEa proliferation. TEa cells involved in active DNA synthesis were visualized by BrdU incorporation and the corresponding percentages of BrdU cells indicated in the figure. Control cells were cultured simultaneously in the absence of antigenic peptide to determine the level of endogenous activity in non-proliferating cells. Red fluorescence emission (DNA content) is indicated by PI (x-axis, arbitrary units) fluorescence and the green fluorescence emission (cells in active proliferation) by BrdU (y-axis) incorporation (BrdU cells). The bivariate parameter histograms are the representative of three separate experiments. Non-stimulated cells = no peptide; 1/1 = control; 10/1 = high dose pretreated cells.
Since T-cell depletion via apoptosis is considered a normal process that contributes to the establishment of peripheral immune tolerance,22–25 we investigated apoptosis during the challenge step of TEa cells by flow cytometric analysis. The cell surface expression of an early apoptosis marker, phospholipid phosphatidylserine (PS), was evaluated using phospholipid binding protein, annexin V, which binds to PS. A vital stain, PI, was added to the samples to help differentiate apoptotic (FITC-positive, PI-negative) from necrotic (FITC-positive, PI-positive) cells. The analysis performed on 1 and 10 µg/ml spEa pretreated cells, at days 1 and 2 during the secondary challenge, revealed comparable levels of apoptotic cells for these concentrations (Fig. 4b).
With the apoptotic mechanism not supporting the diminished cell count, a second possible explanation was a reduced number of cells in active proliferation during the challenge of high-dose treated cells. To investigate this possibility, the level of cells in active proliferation was measured by BrdU incorporation during the secondary challenge (Fig. 4c). Incorporation of BrdU at day 2 of challenge showed a diminished number of high-dose pretreated cells involved in active DNA synthesis compared to control cells.
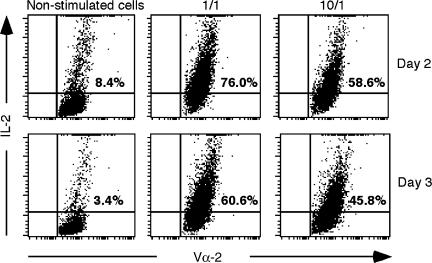
Previous studies have associated T-cell anergy with an impaired expression of IL-2.26 To investigate the intracellular accumulation of IL-2 in our cell system we used flow cytometric analysis.27,28 Protein secretion was inhibited by the addition of a protein transport inhibitor, monensin, in the cell cultures.39 We selected a 7-hr incubation with monensin after 2 and 3 days of antigen stimulation for optimal detection of IL-2 (Fig. 5). To establish a basal level of intracellular IL-2, samples of TEa cells were cultured in the absence of antigen (labelled as ‘non-stimulated cells’). Our results indicated that control cells showed sustained levels of intracellular IL-2 at both 2 and 3 days after the start of a secondary challenge. However, cells pretreated with a high dose of spEa showed reduced levels of IL-2 accumulating in the TEa cells during the same interval. These results correlate the anergic response of TEa cells with an inhibition in IL-2 production, and agree with previous observations that anergy of T-cell clones is characterized by the loss of IL-2 production together with an inhibition in cell proliferation.30
Figure 5.
Reduced levels of intracellular IL-2 in high dose peptide stimulated TEa cells. At days 2 and 3 of a secondary challenge, after 7-hr incubation with the inhibitor monensin, viable cells were collected by Ficoll centrifugation and the accumulated intracellular expression of IL-2 was measured by FACS analysis. To establish the background level of intracellular IL-2 accumulation in nonproliferating cells, an equivalent amount of control cells were incubated in the absence of antigenic peptide (non-stimulated cells). Dot-plots show TEa cells (Vα-2-FITC fluorescence, x-axis, arbitrary units) versus IL-2 producing cells (IL-2-PE-Cy5 fluorescence, y-axis, arbitrary units). Panels are a representative experiment from two separate experiments.
Exogenous IL-2 reverses high-dose TEa responsiveness
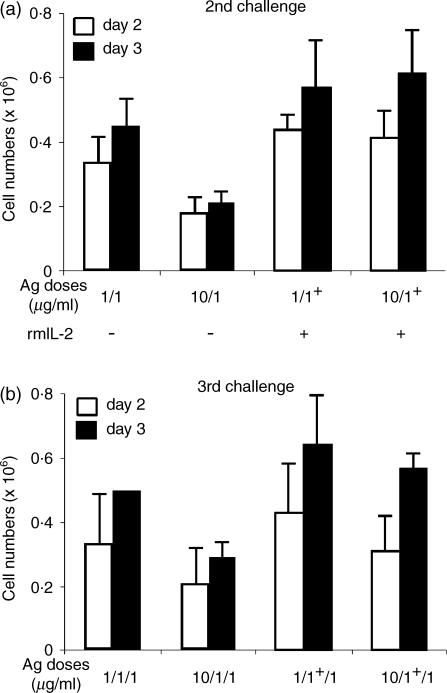
Partial and complete reversion of T-cell anergy in vitro has been documented in human and mouse T cells by propagating the cells in the presence of exogenous IL-2.31,32 To investigate whether IL-2 could overcome the hyporesponsiveness and induce a reversible phenotype in TEa cells, a secondary challenge was conducted in the absence (–) or presence (+) of IL-2 (Fig. 6a). Cell counts taken at days 2 and 3 indicated that, in the presence of IL-2, high dose pretreated cells were able to proliferate at similar levels as control cells (compare 1/1+ versus 10/1+ in Fig. 6a). However, an identical group of cells challenged in the absence of IL-2 showed the reduction in cell proliferation as previously described (compare 1/1 versus 10/1 in Fig. 6a). These data indicated that the hypoproliferative response of TEa cells induced with high dose peptide exposure was reversed in the presence of IL-2.
Figure 6.
IL-2 reverses TEa hyporesponsiveness. (a) At the start of a secondary challenge, control and high dose pretreated TEa cells were incubated in the absence (–) or presence (+) of 20 ng/ml rmIL-2. The number of viable cells was estimated in the cultures after days 2 and 3 of antigen exposure. 1/1 = control; 10/1 = 10 µg/ml spEa; 1/1+ = control plus rmIL-2; 10/1+ 10 µg/ml spEa plus rmIL-2. (b) Viable cells collected from 7 days cultures of the previous challenge were restimulated (3rd challenge) under the same conditions but in the absence of rmIL2. Cell numbers were measured 2 and 3 days after stimulation. 1/1/1 = control; 10/1/1 = 10/1; 1/1+/1 = 1/1+ 10/1+/1 = 10/1+. The results plotted as the mean values of three different experiments ± SD.
These results suggested a pathway for anergy reversion in our cell system. To test IL-2-mediated reversal of anergy, equal numbers of viable TEa cells collected from the previous experiment, were now challenged (3rd challenge) with 1 µg/ml of spEa in the absence of rmIL-2 (Fig. 6b). As expected, in the absence of exogenous IL-2, cells treated with high antigen dose displayed an anergic phenotype (compare 1/1/1 versus 10/1/1 in Fig. 6b). On the contrary, high dose pretreated cells previously challenged in the presence of IL-2, were now able to proliferate at levels comparable with the control ones in the absence of IL-2 (compare 1/1+/1 versus 10/1+/1 in Fig. 6b). These results indicated that: (a) the hyporesponsive phenotype could be reversed by a single exposure to IL-2; and (b) the epigenetic nature of the hyporesponsiveness induced in high-dose pretreated TEa cells.
Association of TEa hyporesponsiveness with cell cycle protein levels
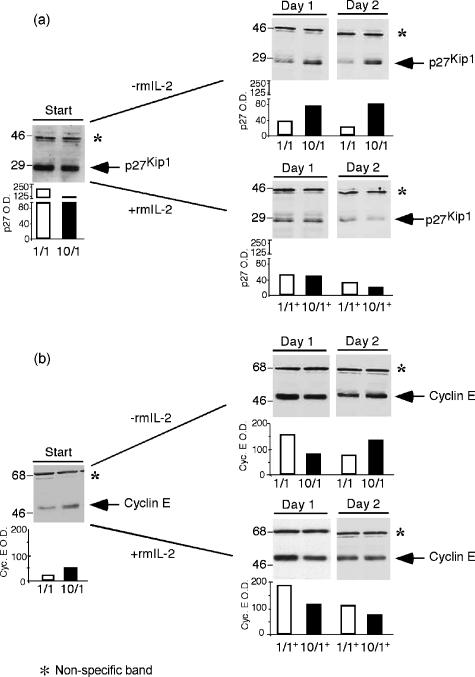
Reduction in steady state levels of p27Kip1 is essential for G1 progression in eukaryotic cells.5,6,32–35 Therefore, we studied the protein levels of this CdkI during the secondary challenge of TEa cells (Fig. 7a). Viable cells were collected at the times indicated in the figure and cell lysates were analyzed for the presence of the cyclin-dependent kinase inhibitor by immunoblotting. At the start of a secondary challenge, protein levels of p27Kip1 were elevated in control cells compared to those observed in high-dose pretreated cells (see 1/1 and 10/1, start, Fig. 7a). After stimulation, control samples followed a similar pattern in the presence or absence of IL-2 with a sharp reduction in p27Kip1 levels. An identical response was observed for the high-dose pretreated cells challenged in the presence of IL-2 (see 10/1+ in Fig. 7a). Such changes in p27Kip1 protein levels were previously described during normal activation of T cells.7–10 Although p27Kip1 in high-dose pretreated cells, cultured in the absence of exogenous addition of IL-2, decreased somewhat after stimulation, still remained elevated when compared to that of the control (compare 1/1 and 10/1 at days 1 and 2 in Fig. 7a). In addition, TEa cells treated with 10 µg/ml of spEa switched from less p27Kip1 at the start of the challenge to higher levels of the CdkI after stimulation in comparison with control cells. This behaviour suggests that an elevated presence of p27Kip1 could be related to the diminished cell counts by controlling the G1 transition and allowing fewer cells to enter the S phase. This notion was supported by the Brdu-incorporation data (see Fig. 4c).
Figure 7.
Cell cycle protein levels in TEa cells. (a) p27Kip1. Total cell lysates were prepared from viable cells collected from secondary challenged cultures in the presence (+) or absence (–) of rmIL-2. Protein concentrations were determined using the Bio-Rad protein assay. For sodium dodecyl sulphate–polyacrylamide gel electrophoresis (SDS–PAGE) 25 µg of cell extracts were loaded per lane. (b) Cyclin E. Total cell lysates were prepared and 25 µg of cell extracts were loaded per lane in 10% SDS–PAGE gels. Western blots were performed as indicated. The slow migrating band in the immunoblots (*) was considered as nonrelated to the cell cycle proteins and used for equal loading. Sizes are indicated in MW × 103. Histogram bars represent the band optical densities. Data are the representative of four different experiments ± SD.
We investigated cyclin E protein levels in the cell extracts of challenged TEa cells (Fig. 7b). At the start of the secondary challenge, protein levels of cyclin E were higher in high dose treated cells than in the control (see 1/1 and 10/1+, start, Fig. 7b). These results could be explained by assuming a hyperactivated state of the 10 µg/ml treated cells supporting the idea that these cells were at a different metabolic status than control cells at the start of the secondary challenge. After stimulation, levels of cyclin E were greatly elevated in control cells both in the absence or presence of IL-2 compared to the ones detected at the start of the challenge (see 1/1 and 1/1+ in Fig. 7b). This behaviour followed the pattern already described during the normal activation of T cells.2,7 The progeny of high-dose antigen stimulated TEa cells displayed similar changes to those observed in control cells with an increment of cyclin E after stimulation compared to the levels detected at the start of the secondary challenge. Interestingly, we were able to detect an increment in cylin E at day 2 in the absence of IL-2 that was not seen when this cytokine was present (compare 10/1 and 10/1+ at day 2 in Fig. 7b). This result suggests that more cyclin E was produced to overcome the high threshold set by the elevated levels of p27Kip1 in the high-dose pretreated cells.
Discussion
We develop an in vitro cell system in which we demonstrate an inheritable and reversible phenotype of antigen dose-dependent modulation of proliferation in mouse CD4+ T cells. In this model, TEa cell hypoproliferation was preceded by an initial burst in cell expansion. While proliferation may not be required for the induction of anergy,19,36 it has been associated with a variety of antigens in vivo37,38 and in vitro.39 Several criteria were used to confirm TEa cell anergy. First, cell surface densities of the transgenic TCR were indistinguishable between anergic and control cells. Second, the hypoproliferative response was associated with a decrease in the levels of cells engaged in active DNA synthesis. Third, increase programmed cell death was not associated with the anergic state. Fourth, a reduced number of cells were shown to express IL-2 in the anergic population. and finally, the reduced cell proliferation could be prevented by the exogenous addition of mouse IL-2, one of the characteristic features of in vitro anergy.26,31 Although the observed phenotype was associated with the state called anergy, the induction of anergy is not under the classical definition described for this phenomenon, that is, hyporesponsiveness following defective, non-productive primary stimulation.
Under our experimental conditions, a physiological response was observed with only 10 times the amount of peptide needed for a sustainable level of proliferation. SpEa concentrations above this amount – i.e. 20 µg/ml – were unable to substantially increase the number of peptide-bound MHC class II complexes above the levels already observed for 10 µg/ml. In consequence, this high dose would represent the lowest amount of antigenic peptide reaching saturation of the class II MHC complex-bearing cells in the splenocyte population.
Persistence of the hypoproliferative phenotype was evident in cells pretreated with 10 µg/ml of spEa as evidenced by the response of progeny to subsequent antigen exposure. Our data are consistent with low responsiveness being an epigenetic property of the progeny of high-dose antigen-treated cells given the observation that exposure to IL-2 was sufficient to reverse the anergic phenotype in the TEa system. Our data are strengthened by the fact that the observations reported herein have been observed in primary T cells challenged immediately post-isolation from TEa animals and in clones derived from TEa animals (data not shown). These independent isolates and experiments have been conducted over a 3-year interval so it is unlikely that culture conditions, peptide preparations and any other routine variables contributes to the reproducible phenotype we report.
It was noticed that, at the start of a secondary challenge, protein levels of p27Kip1 and cyclin E in high-dose pretreated cells were different than in control cells. Although the differences were small, they were reproducible. A closer look indicated that the two cell groups might be in separated metabolic states, i.e. control cells close to a resting stage while the 10 µg/ml treated cells in a hyperactivated state. By flow cytometry analysis, high-dose treated cells showed an increase in granularity (larger side scatter fluorescence), larger nuclear size (measured by forward scatter fluorescence), and an increase in the expression of high affinity IL-2R than control cells (data not shown). Together with lower amounts of the CdkI p27Kip1 and higher levels of cyclin E, these observations supported the notion of a hyperactivated state for the high-dose mitogen-activated cells. T-cell hyperactivation associated with induction of anergy has been reported for the establishment of in vivo anergy in TCR transgenic mice.37 Our results suggest that a similar state could be associated with the anergic phenotype.
Cell cycle entry of TEa cells was accompanied by a reduction in the levels of p27Kip1 and a sustained number of cells expressing IL-2 and in active DNA synthesis. In contrast, high-dose pretreated cells displayed elevated levels of p27Kip1 an increase in intracellular IL-2, non-producing cells, a reduced number of proliferating cells, and an increase in the levels of cyclin E expression. Although the precise mechanisms of anergy induction remain to be elucidated, our data are consistent with a model in which control of progression through G1 is an essential component of the hyporesponsiveness demonstrated by progeny derived from high-dose antigen exposed cells. Steady state levels of p27Kip1 may contribute to the relative delay in progression through the G1/S transition observed in our system. Our results are in agreement with other studies suggesting a role for p27Kip1 for the blockade of clonal expansion of T cells in vivo and in vitro following primary activation.40,41
In summary, our data demonstrate a correlation between the impaired expression of IL-2, measured by the reduced number of IL-2 producing cells and the elevated levels of p27Kip1 detected in anergic cells. We now intend to expand our studies of this transferable, epigenetic and reversible system to explore the network of interactions among IL-2, p27Kip1 cyclin E and the likely considerable number of other molecular interactions that underlie the observed inducible and reversible phenotype.
Acknowledgments
We acknowledge the Washington Research Foundation, Immunex (Amgen) Corporation, Mathers Charitable Foundation, and the NSF STC for Molecular Biotechnology (University of Washington) for support of the work. We acknowledge Neil Fanger, Michel Pettigrew, Charles Maliszewski, Eric Butz and David Fitzpatrick for critical review of the manuscript. A.Y.R and J.M.R. are investigators of the Howard Hughes Medical Institute.
References
- 1.Bretscher P, et al. The two-signal model of lymphocyte activation twenty-one years later. Immunol Today. 1992;13:74–6. doi: 10.1016/0167-5699(92)90138-W. [DOI] [PubMed] [Google Scholar]
- 2.Roberts JM, et al. Evolving ideas about cyclins. Cell. 1999;98:129–32. doi: 10.1016/s0092-8674(00)81007-7. [DOI] [PubMed] [Google Scholar]
- 3.Sherr CJ, Roberts JM, et al. CDK inhibitors. positive and negative regulators of G1-phase progression. Genes Dev. 1999;13:1501–12. doi: 10.1101/gad.13.12.1501. [DOI] [PubMed] [Google Scholar]
- 4.Winey M, et al. Cell cycle: driving the centrosome cycle. Curr Biol. 1999;9:R449–52. doi: 10.1016/s0960-9822(99)80279-6. [DOI] [PubMed] [Google Scholar]
- 5.Toyoshima H, Hunter T, et al. p27, a novel inhibitor of G1-cyclin-CDK protein kinase activity, is related to p21. Cell. 1994;78:67–74. doi: 10.1016/0092-8674(94)90573-8. [DOI] [PubMed] [Google Scholar]
- 6.Sherr C, Roberts JM, et al. Inhibition of mammalian G1 cyclin-dependent kinases. Genes Dev. 1995;9:1149–63. doi: 10.1101/gad.9.10.1149. [DOI] [PubMed] [Google Scholar]
- 7.Firpo EJ, Koff A, Solomon MJ, Roberts JM, et al. Inactivation of a Cdk2 inhibitor during IL-2 induced proliferation of human T lymphocytes. Mol Cell Biol. 1994;14:4889–901. doi: 10.1128/mcb.14.7.4889. [DOI] [PMC free article] [PubMed] [Google Scholar]
- 8.Nourse J, Firpo E, Flanagan WM, et al. Interleukin-2-mediated elimination of the p27Kip1 cyclin-dependent kinase inhibitor prevented by rapamycin. Nature. 1994;372:570–3. doi: 10.1038/372570a0. [DOI] [PubMed] [Google Scholar]
- 9.Roberts JM, Koff A, Polyak K, Firpo E, Collins S, Ohtsubo M, Massague J, et al. Cyclins, Cdks, and cyclin kinase inhibitors. Cold Spring Harbor Symp Quant Biol. 1994;LIX:31–8. doi: 10.1101/sqb.1994.059.01.006. [DOI] [PubMed] [Google Scholar]
- 10.Erickson S, Sangfelt O, Castro J, Heyman M, Einhorn S, Grander D, et al. Interferon-α inhibits proliferation in human T lymphocytes by abrogation of interleukin 2-induced changes in cell cycle-regulatory proteins. Cell Growth Dif. 1999;10:575–82. [PubMed] [Google Scholar]
- 11.Grubin CE, Kovats S, deRoos P, Rudensky AY, et al. Deficient positive selection of CD4 T cells in mice displaying altered repertoires of MHC Class II-bound self-peptides. Immunity. 1997;7:197–208. doi: 10.1016/s1074-7613(00)80523-3. [DOI] [PubMed] [Google Scholar]
- 12.Porter LP, Malone KE, Heagerty PJ, Alexander GM, Gatti LA, Firpo EJ, Daling JR, Roberts JM, et al. Expression of cell cycle regulators p27Kip1 and cyclin E, alone and in combination, correlate with survival in young breast cancer patients. Nature Med. 1997;3:222–5. doi: 10.1038/nm0297-222. [DOI] [PubMed] [Google Scholar]
- 13.Murphy DB, Lo D, Rath S, Brinster RL, Flavell RA, Slanetz A, Janeway Ca, Jr, et al. A novel MHC class II epitope expressed in thymic medulla but not cortex. Nature. 1989;338:765–8. doi: 10.1038/338765a0. [DOI] [PubMed] [Google Scholar]
- 14.Chrest FJ, Buchholz MA, Kim YH, Kwon T-K, Nordin AA, et al. Identification and quantitation of apoptotic cells following anti-CD3 activation of murine G0 T cells. Cytometry. 1993;14:883–90. doi: 10.1002/cyto.990140806. [DOI] [PubMed] [Google Scholar]
- 15.Rudensky AY, Rath S, Preston-Huburt P, Murphy DB, Janeway Ca, Jr, et al. On the complexity of self. Nature. 1991;353:660–2. doi: 10.1038/353660a0. [DOI] [PubMed] [Google Scholar]
- 16.Velazquez C, DiPaolo R, Unanue ER, et al. Quantitation of lysozyme peptides bound to class II MHC molecules indicates very large differences in levels of presentation. J Immunol. 2001;166:5488–94. doi: 10.4049/jimmunol.166.9.5488. [DOI] [PubMed] [Google Scholar]
- 17.Schonrich G, Kalinke U, Momburg F, Malissen M, Schmidt-Verhulst AM, Malissen B, Hammerling GJ, Arnold B, et al. Down-regulation of T cell receptors on self-reactive T cells as a novel mechanism for extrathymic tolerance induction. Cell. 1991;65:293–304. doi: 10.1016/0092-8674(91)90163-s. [DOI] [PubMed] [Google Scholar]
- 18.Heath WR, Karamalis F, Donoghue J, Miller JFAP, et al. Autoimmunity caused by ignorant CD8+ T cells is transient and depends on avidity. J Immunol. 1995;155:2339–49. [PubMed] [Google Scholar]
- 19.Ryan KR, Evavol BD, et al. Persistence of peptide-induced CD4+ T cell anergy in vitro. J Exp Med. 1997;187:89–96. doi: 10.1084/jem.187.1.89. [DOI] [PMC free article] [PubMed] [Google Scholar]
- 20.Matsushita S, Nishimura Y, et al. Partial activation of human T cells by peptide analogs on live APC. induction of clonal anergy associated with protein tyrosine dephosphorylation. Hum Immunol. 1997;53:73–80. doi: 10.1016/S0198-8859(96)00273-X. [DOI] [PubMed] [Google Scholar]
- 21.Dubois PM, Philgren M, Tomkowiak M, van Mechelen M, Marvel J, et al. Tolerant CD8 T cells induced by multiple injections of peptide antigen show impaired TCR signaling and altered proliferative responses in vitro and in vivo. J Immunol. 1998;161:5260–7. [PubMed] [Google Scholar]
- 22.Lanoue A, Bona C, von Boehmer H, Sarukhan A, et al. Conditions that induce tolerance in mature CD4+ T cells. J Exp Med. 1997;185:405–14. doi: 10.1084/jem.185.3.405. [DOI] [PMC free article] [PubMed] [Google Scholar]
- 23.Falk K, Rôtzschke O, Strominger JL, et al. Antigen-specific elimination of T cells induced by oligomerized hemagglutinin (HA) 306–318. Eur J Immunol. 2000;30:3012–20. doi: 10.1002/1521-4141(200010)30:10<3012::AID-IMMU3012>3.0.CO;2-Q. [DOI] [PubMed] [Google Scholar]
- 24.Lenardo M, Chan FK-M, Hornung F, McFarland M, Siegel R, Wang J, Zheng L, et al. Mature T lymphocyte apoptosis-Immune regulation in a dynamic and unpredictable antigenic environment. Ann Rev Immunol. 1999;17:221–53. doi: 10.1146/annurev.immunol.17.1.221. [DOI] [PubMed] [Google Scholar]
- 25.Critchfield JM, Zuñiga-Pflucker JC, Lenardo MJ, et al. Parameters controlling the programmed death of mature mouse T lymphocytes in high-dose suppression. Immunol. 1995;160:71–8. doi: 10.1016/0008-8749(95)80011-7. [DOI] [PubMed] [Google Scholar]
- 26.Schwartz RH, et al. T cell clonal anergy. Curr Opin Immunol. 1997;9:351–7. doi: 10.1016/s0952-7915(97)80081-7. [DOI] [PubMed] [Google Scholar]
- 27.Prussin C, et al. Cytokine flow cytometry: understanding cytokine biology at the single-cell level. J Clin Immunol. 1997;17:195–204. doi: 10.1023/a:1027350226435. [DOI] [PubMed] [Google Scholar]
- 28.Nylander S, Kalies I, et al. Brefeldin A, but no monensin, completely blocks CD69 expression on mouse lymphocytes: efficacy of inhibitors of protein secretion in protocols for intracellular cytokine staining by flow cytometry. J Immunol Methods. 1999;224:69–76. doi: 10.1016/s0022-1759(99)00010-1. [DOI] [PubMed] [Google Scholar]
- 29.Dinter A, Berger EG, et al. Golgi-disturbing agents. Histochem Cell Biol. 1998;109:571–90. doi: 10.1007/s004180050256. [DOI] [PubMed] [Google Scholar]
- 30.Mueller DL, Jenkins MJ, et al. Molecular mechanisms underlying functional T-cell unresponsiveness. Curr Opin Immunol. 1995;7:375–81. doi: 10.1016/0952-7915(95)80113-8. [DOI] [PubMed] [Google Scholar]
- 31.Beverly B, Kang SM, Lenardo MJ, Schwartz RH, et al. Reversal of in vitro T cell clonal anergy by IL-2 stimulation. Int Immunol. 1992;4:661–71. doi: 10.1093/intimm/4.6.661. [DOI] [PubMed] [Google Scholar]
- 32.Boussiotis VA, Barber DL, Nakarai T, et al. Prevention of T cell anergy by signaling through the gamma c chain of the IL-2 receptor. Science. 1994;266:1039–42. doi: 10.1126/science.7973657. [DOI] [PubMed] [Google Scholar]
- 33.Sherr C, et al. G1 phase progression: cycling on clue. Cell. 1994;79:551–5. doi: 10.1016/0092-8674(94)90540-1. [DOI] [PubMed] [Google Scholar]
- 34.Kaplan MH, Daniel C, Schindler U, Grusby MJ, et al. Stat proteins control lymphocyte proliferation by regulating p27 expression. Mol Cell Biol. 1996;18:1996–2003. doi: 10.1128/mcb.18.4.1996. [DOI] [PMC free article] [PubMed] [Google Scholar]
- 35.Kawamatta S, Sakaida H, Hori T, Maeda M, Uchiyama T, et al. The upregulation of p27Kip1 by rapamycin results in G1 arrest in exponentially growing T-cell lines. Blood. 1998;91:561–9. [PubMed] [Google Scholar]
- 36.Grunow R, Frutig K, Pichler WJ, et al. Anergy induction in human CD4+ T-cell clones by stimulation with soluble peptides does not require cell proliferation and is accompanied by elevated IL4 production. Cell Immunol. 1996;173:79–86. doi: 10.1006/cimm.1996.0253. [DOI] [PubMed] [Google Scholar]
- 37.Switzer SK, Wallner BP, Briner TJ, Sunshine GH, Bourque CR, Luqman M, et al. Bolus injection of aqueous antigen leads to a high density of T-cell-receptor ligand in the spleen, transient T-cell activation and anergy induction. Immunology. 1998;94:513–22. doi: 10.1046/j.1365-2567.1998.00554.x. [DOI] [PMC free article] [PubMed] [Google Scholar]
- 38.Webb S, Morris C, Sprent J, et al. Extrathymic tolerance of mature T cells: clonal elimination as a consequence of immunity. Cell. 1990;63:249–1256. doi: 10.1016/0092-8674(90)90420-j. [DOI] [PubMed] [Google Scholar]
- 39.Kawabe Y, Ochi A, et al. Programmed cell death and extrathymic reduction of Bβ8+ CD4+ T cells in mice tolerant to Staphylococcus aureus enterotoxin B. Nature. 1991;349:245–8. doi: 10.1038/349245a0. [DOI] [PubMed] [Google Scholar]
- 40.Boussiotis VA, Freeman GJ, Taylor PA, Berezovskaya A, Grass I, Blazar BR, Nadler LM, et al. p27Kip1 functions as an anergy factor inhibiting interleukin 2 transcription and clonal expansion of allorreactive human and mouse helper T lymphocytes. Nature Med. 2000;6:290–7. doi: 10.1038/73144. [DOI] [PubMed] [Google Scholar]
- 41.Wells AD, Walsh MC, Sankaran D, Turka LA, et al. T cell effector function and anergy avoidance are quantitatively linked to cell division. J Immunol. 2000;165:2432–43. doi: 10.4049/jimmunol.165.5.2432. [DOI] [PubMed] [Google Scholar]


