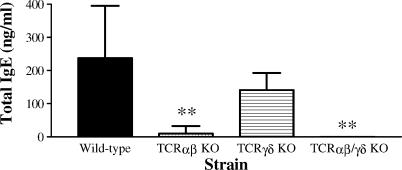
Figure 3.
Analysis of total IgE in serum of sensitized and aerosol challenged T cell deficient or wild-type control mice. Amount total IgE in serum samples was calculated from a standard curve with a mouse IgE isotype standard. Mean values and standard deviations are depicted. Seven animals in the wild-type control group and four to five animals in the T-cell deficient strains. **P < 0·01 versus the wild-type control group.

