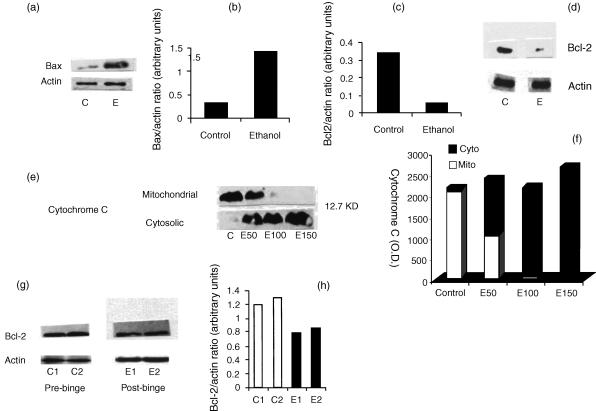
Figure 3.
(a) Effect of ethanol on Jurkat cell Bax expression. Equal numbers of Jurkat cells were incubated in media containing either buffer (control, C) or ethanol (E, 100 mm) for 1 hr. At the end of the incubation period cells were prepared for Western blots and probed with anti-Bax antibody. Two sets of experiments were carried out. Representative Western blots of ethanol-treated Jurkat cells show expression of Bax. (b) Densitometric analysis showing Bax/actin ratio in control (C) and ethanol (E)-treated Jurkat cells. Ethanol increased Jurkat cell expression of Bax twofold. (c) Densitometric analysis showing Bcl-2/actin ratio in control (C) and ethanol (E)-treated Jurkat cells. (d) Effect of ethanol on Jurkat cell expression of Bcl-2. Equal numbers of Jurkat cells were incubated in media containing either buffer (control, C) or ethanol (E100 mm) for 16 hr. Subsequently, cells were lysed, protein extracted, Western blots generated and probed with anti-Bcl-2. Two sets of experiments were carried out. Representative Western blots of ethanol-treated Jurkat cells show expression of Bcl-2. (e) Effect of ethanol on mitochondrial translocation of cytochrome C. Equal numbers of Jurkat cells were incubated in media containing either buffer (control, C) or ethanol (E50, 100 or 150 mm) for 1 hr. At the end of the incubation period, mitochondrial and cyotosolic fractions were isolated, Western blots generated and probed with anticytochrome C antibody. Two sets of experiments were carried out. Representative Western blots of ethanol-treated Jurkat cells show translocation of cytochrome C. (f) Densitometric analysis showing mean cytochrome C location in cytosolic (Cyto) or mitochondrial (Mito) compartments of control and ethanol treated (E50, 100 and 150 mm) Jurkat cells. (g) Effect of binge drinking on T cell expression of Bcl-2. Equal numbers of cells isolated before (C1 and C2) and after (E1 and E2) binge drinking, were lysed, protein extracted, Western blots generated and probed with anti-Bcl-2 antibody. Representative Western blots of T cells show expression of Bcl-2. (h) Densitometric analysis showing Bcl-2/actin ratio before (C1 and C2) and after (E1 and E2) binge drinking.

