Abstract
DNA, depending on base sequence, can induce a wide range of immune responses. While bacterial DNA is stimulatory, mammalian DNA is inactive alone and can, moreover, inhibit the response to bacterial DNA. To determine whether the mode of cell entry affects the immune properties of mammalian DNA, we have investigated the effects of the cytofectin agents Fugene 6 (Roche Diagnostics Corp., Indianapolis, IN), Lipofectin and Lipofectamine (Life Technologies, Grand Island, NY) on the responses of murine macrophages to DNA from calf thymus and human placenta. Whereas calf thymus and human placenta DNA alone failed to stimulate J774 or RAW264·7 cell lines or bone marrow-derived macrophages, these DNAs in complexes with cytofectin agents stimulated macrophages to produce nitric oxide but not interleukin 12. Both single-stranded and double-stranded DNAs were active in the presence of cytofectins. Macrophage activation by the DNA–cytofectin complexes was reduced by chloroquine, suggesting a role of endosomal acidification in activation. As shown by flow cytometry and confocal microscopy, the cytofectins caused an increase in the uptake of DNA into cells. Our findings indicate that macrophages vary in their response to DNA depending on uptake pathway, suggesting that activation by DNA reflects not only sequence but also context or intracellular location.
Introduction
DNA is a complex macromolecule whose immunological properties vary with base sequence and encompass both stimulation and inhibition.1–5 As shown using natural DNA as well as synthetic oligodeoxynucleotides (ODN), DNA displaying certain sequence motifs can stimulate a wide range of immune responses that include B-cell proliferation and cytokine production. In the murine system, these motifs have the general structure of two 5′ purines, an unmethylated CpG motif and two 3′ pyrimidines; in humans, other sequence motifs cause activation, although these sequences may differ depending on the response and target cell.3,6 DNA containing immunostimulatory sequences (ISS) or CpG motifs is termed CpG DNA and can activate cells via the Toll-like receptor 9 (TLR9) following internalization.7 As such, DNA can activate the innate immune system and play a physiological as well as pharmacological role, with CpG DNA being tested as vaccine adjuvants in humans.8,9
In contrast to CpG DNA, some DNA can inhibit immune responses in a manner that also depends on sequence motifs. Thus, mammalian DNA as well as certain viral DNA and synthetic ODN can block immune responses induced by CpG DNA.4,5 The sequences for inhibition are diverse and depend in part on the DNA backbone, with phosphorothioate ODN showing greater inhibitory activity and different structure–function relationships compared with their phosphodiester counterparts.5 Sequences with inhibitory activity include a CpG motif preceded by a 5′ C or followed by a 3′ G, extended runs of dG and all four single base (dA, dC, dT and dG) ODN when presented with a phosphorothioate backbone.4,5 Although DNA can inhibit the response to CpG DNA, in part by blocking DNA internalization, the inhibition of lipopolysaccharide (LPS) responses by certain ODN suggests a more generalized effect on signalling pathways.10
To address the mechanism of action of inhibitory DNA, we began studies to determine whether increasing the cellular uptake of mammalian DNA would augment its inhibitory activity. For that purpose, we used murine macrophages to test the effects of cytofectin agents on the production of nitric oxide (NO), an important pro-inflammatory mediator.11 Cytofectins are lipid-based agents that increase transfection efficiency and have been widely used in vitro and in vivo to promote plasmid or ODN uptake.12 Cytofectins facilitate the entry of DNA into cells via non-receptor-mediated endocytosis and, through their destabilizing effects on endosomes, promote DNA release into the cytoplasm.13
In preliminary studies, we noted that the presentation of mammalian DNA in cytofectins, rather than increasing inhibition, paradoxically caused stimulation. Thus, we observed dramatically increased NO production with DNA complexed to cytofectins under conditions in which free DNA was inactive. These findings were similar to those of previous studies, indicating that the introduction of double-stranded (ds), but not single-stranded (ss), DNA into cells by cytofectin agents caused immune activity assessed by surface expression of MHC molecules CD40 and CD54.14,15
In the current experiments, we have investigated further the ability of cytofectins to affect the immunomodulatory properties of DNA using as models the J774 and RAW264·7 cell lines as well as cultured murine macrophages or dendritic cells. These cells were stimulated by ss and ds DNA from various species with or without cytofectin agents, and responsiveness was assessed by the production of two inflammatory mediators, NO and interleukin (IL)-12. In results presented herein, we show that the immunomodulatory activity of mammalian DNA varies depending on the manner in which it is presented to cells and that cytofectins can convert an inactive or inhibitory DNA into a stimulator. We further show that NO and IL-12 differ in their inducibility by mammalian DNA in cytofectins. Coupled with those of other studies, these results suggest that immune activation by DNA may reflect its mode of entry and intracellular context and that the range of immune activities of DNA is not solely a consequence of sequence motifs.
Materials and methods
DNA preparation
DNA from calf thymus (CT), human placenta (HP), salmon testes (ST), and Escherichia coli (EC) were purchased from the Sigma Chemical Co. (St. Louis, MO). The DNA products were purified by repeated phenol extractions followed by chloroform/isoamyl alcohol extraction with a final ethanol precipitation step. The air-dried DNA preparations were dissolved in distilled water at concentrations of 1–2 mg/ml and were kept at − 20° before use in each experiment. Native DNA was used as ds DNA, while ss DNA was prepared by boiling DNA for 10 min and cooling on ice for 5 min. Synthetic polydeoxynucleotides, including poly(dA)·poly(dT), poly(dI)·poly(dG), poly(dG)·poly(dC), poly(dA), poly(dT), and poly(dC), were purchased from Amersham Pharmacia (Piscataway, NJ), dissolved in distilled water at a concentration of 1 mg/ml and kept at −20° before use.
Fluorescently labelled CT DNA and EC DNA were prepared with either ethidium monoazide (EMA) or YOYO-1, both of which were purchased from Molecular Probes, Inc. (Eugene, OR). EMA-labelled DNA was prepared by incubation of 200 µg of ds CT DNA or EC DNA with 5 µg of EMA in 2 ml H2O in the dark for 10 min at RT, followed by exposure to UV light for 2 min. YOYO-1-labelled DNA was prepared following the manufacturer's instructions. Briefly, 100 µg of ds CT DNA or ds EC DNA was added to 4 ml of Dulbecco's phosphate-buffered saline (PBS) (Sigma Chemical, Co.) containing 0·2 µm YOYO-1, 0·1% fetal calf serum (FCS), 1 mm CaCl2 and 1 mm MgCl2, and incubated at RT for 1 hr. Unreacted EMA or YOYO-1 was removed by gel filtration of the DNA–dye mixtures through a Sephadex G-25 column (NAP10 column, Amersham Phamarcia). EMA-DNA and YOYO-DNA in the elutes were precipitated with ethanol, air-dried, and dissolved in H2O at a concentration of 100 µg/ml.
Preparation of DNA–cytofectin complexes
Three commercially available cytofectins were used in this study: Fugene 6 (Roche Diagnostics Corp., Indianapolis, IN), Lipofectin and Lipofectamine (Life Technologies, Grand Island, NY). DNA–cytofectin complexes were prepared according to the manufacturers' instructions. Briefly, cytofectin solutions were prepared by diluting stock cytofectin agents into serum-free RPMI-1640 medium (Life Technologies) in a dose range between 0·8 and 20 µg/ml. DNA solutions were prepared by diluting DNA in serum-free RPMI-1640 medium in the same dose range as the cytofectin agents. Cytofectin solutions were immediately added to the DNA solutions, with the exception of the Lipofectamine solution which was incubated at RT for 30 min prior to being added to DNA solution. The final DNA concentrations were between 0.4 and 10 µg/ml, with a ratio of DNA to cytofectins of 1 : 1 (w/w). These concentrations were based on our previous study16 and preliminary experiments. A DNA to cytofectin ratio of 1 : 1 was used throughout this study for different combinations of cytofectin agents and DNA either in the ds or ss forms. The DNA–cytofectin mixtures were incubated at RT for 30 min and then added to murine macrophages or dendritic cells (DCs) at 200 µl/well in 96-well cell culture plates for in vitro experiments (see below).
Macrophage and DC culture
Murine J774 and RAW264·7 macrophage cell lines were maintained in culture medium consisting of RPMI-1640 medium supplemented with 10% FCS and 20 µg/ml gentamicin (Life Technologies). Murine bone marrow-derived macrophages (BMMC) were cultured from BALB/c mice (Jackson Laboratory, Bar Harbor, ME) as previously described.10 Bone marrow-derived DCs were generated from BALB/c mice by a previously reported method with modification.17 Briefly, bone marrow cells were collected from femurs and tibias by repeated flushing of the bone shaft with RPMI-1640 medium (Life Technologies), and cultured in 75-cm2 cell culture flasks (Costar Incorporated, Corning, NY) at a concentration of 1 × 10⁶ cells/ml in DC medium. The DC medium consisted of RPMI-1640 medium supplemented with 20 ng/ml of recombinant murine GM-CSF (Peprotec, Inc., Rocky Hill, NJ), 10% FCS and 20 µg/ml gentamicin. At day 3, bone marrow cells were fed with fresh DC medium containing 20 ng/ml of GM-CSF, and, at days 6 and 8, the cells were fed with fresh DC medium containing 10 ng/ml of GM-CSF. At days 10–12, the non-adherent cells were harvested and used in experiments as DCs. At harvest, the purity of DCs was evaluated by flow cytometry for murine DC surface markers CD11c and NLDC145 (see below) and was 80–90%, consistent with that reported by other investigators.17
Treatment of murine macrophages and DC with mammalian DNA
Murine macrophages (J774, RAW264·7 and BMMC) and DCs were plated in 96-well cell culture plates (Costar Incorporated, Corning, NY) at 5 × 10⁴ cells/well in the culture medium. Prior to experiments, macrophages and DCs were washed twice with serum-free RPMI-1640 medium, followed by incubation with different doses (0.4–10 µg/ml) of ds or ss natural or synthetic DNA alone or in the form of DNA–cytofectin complexes at 37°. FCS was added to the culture to obtain a 10% FCS concentration for the culture medium at 4 hr, followed by further incubation at 37° for a total time of 48 hr. Supernatants were collected at 24 hr to assess IL-12 levels and at 48 hr to measure NO concentrations. In some experiments, cells were preincubated with 1–4 µg/ml chloroquine (Sigma Chemical Co.) for 1 hr prior to exposure to DNA–cytofectin complexes, to assess the role of endosomal acidification in cell activation.
To assess the possible toxicity of the DNA–cytofectin complexes, the viability of macrophages and DCs was assessed by AlamarBlue™ solution following manufacturer's instructions (BioSource International, Inc., Camarillo, CA). All the DNA–cytofectin complexes showed minimal effects on the viability of these cells, even at the highest dose (10 µg/ml).
IL-12 ELISA and nitrite assay
IL-12 levels were measured by enzyme-linked immunosorbent assay (ELISA) as previously described.5 NO production in the culture supernatants was quantified by measuring nitrite (), a stable breakdown product of NO, using a modified Griess method.10,18
Flow cytometric analysis of DC surface molecule expression
DCs were blocked with 10 µg/ml of anti-mouse FcγIII/IIR antibody (clone 2·4G2) on ice for 30 min. For direct labelling, cells were incubated with phycoerythrin (PE)-labelled anti-mouse CD11c (clone HL3) or anti-I-Ad (clone AMS-32·1) or appropriately labelled isotype controls on ice for 30 min. For indirect labelling, DCs were incubated on ice for 30 min with 10% supernatant of hybridoma cell line NLDC-145 (ATCC HB-290) producing antibody to murine DC marker DEC-205,19 followed by incubation with FITC-labelled goat anti-rat immunoglobulin (Ig) G (TAGO, Inc., Burlingame, CA) on ice for 30 min. After washing DCs three times with cold 0·5% bovine serum albumin (BSA)/0·1% NaN3/PBS, the expression of the surface molecules was examined by FACScan flow cytometer (Becton Dickinson, Mansfield, MA). The acquisition was performed with 10 000 events per sample, and the list mode data were analysed using LYSYS™ II software (Becton Dickinson). All the antibodies used in assessment of DC surface markers were purchased from PharMingen (San Diego, CA).
Flow cytometric analysis of DNA uptake
Assay for cellular uptake of fluorescently labelled DNA was performed as previously described.10 Briefly, 2 × 10⁶ J774 cells in 1 ml of culture medium were incubated with 0·4–10 µg/ml of EMA-labelled ds CT DNA alone or with the labelled DNA–Fugene 6 complexes at the ratio of 1 : 1 (w/w) at 37° for 48 hr. Cells were collected at 0, 6, 24, and 48 hr, washed twice with cold 0·5% BSA/0·1% NaN3/PBS, fixed in 1% paraformaldehyde/PBS, and examined by FACScan flow cytometer.
Confocal microscopy of DNA localization in cells
To examine the intracellular distribution of DNA, J774 cells or BMMC seeded in an eight-well Lab-Tek Chambered Coverglass System (Nalge Nunc Intl Corp., Naperville, IL) were incubated with 1 µg/ml of EMA- or YOYO 1- labelled ds CT DNA or EC DNA in the presence or absence of 1 µg/ml of Fugene 6 or Lipofectin at 37° for 12 hr. After incubation, the cells were washed three times with cold 0·5% BSA/0·1% NaN3/PBS and examined for internalized DNA under a confocal laser scanning microscope (Zeiss LSM 510, Carl Zeiss, Oberkochen, Germany).
Statistical analysis
All results are presented as mean ± SD. Data were analysed by one-way anova, and the difference between experimental treatment groups was assessed by an unpaired Student's t-test. P values < 0·05 were considered statistically significant.
Results
Effect of mammalian DNA–cytofectin complexes on murine macrophages
To determine how cell entry influences the immune response to DNA, we used the murine macrophage cell lines J774, RAW264·7 and BMMC to measure the in vitro response to CT DNA or HP DNA in complexes with the cytofectin agents Fugene 6, Lipofectin or Lipofectamine. These cells, when activated, produce significant amounts of IL-12 and NO, two important inflammatory mediators.11,20 Thus, IL-12 and NO assays were performed throughout the current study to assess cell activation by different combinations of DNA and cytofectins.
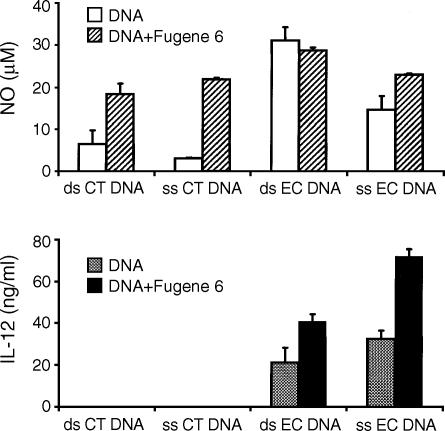
We first tested the activity of ds and ss CT DNA and EC DNA in the presence or absence of Fugene 6. Previous studies have shown that EC DNA is immunostimulatory, in contrast to CT DNA, which is inactive alone.2,3 In these experiments, J774 cells were treated with 10 µg/ml of ds and ss CT DNA or EC DNA alone or in complexes with Fugene 6 for up to 48 hr; supernatants were then examined for IL-12 and NO production. As shown in Fig. 1, EC DNA alone, but not CT DNA alone, induced IL-12 and NO production from the macrophages, consistent with previous studies.10 In the presence of Fugene 6, however, CT DNA induced NO production to a level comparable to that of EC DNA–cytofectin complexes (Fig. 1, upper panel); under these conditions, however, CT DNA–cytofectin complexes failed to induce IL-12 production (Fig. 1, lower panel). Cells treated with Fugene 6 alone produced low levels of NO and IL-12 (3·1 ± 0·5 µm and 0·3 ± 0·08 ng/ml, mean ± SD, respectively), which were comparable to the NO and IL-12 levels (0·7 ± 0·02 µm and 0·4 ± 0·03 ng/ml, respectively) produced by cells treated with medium alone.
Figure 1.
Induction of NO in macrophages by CT DNA–cytofectin complexes. J774 cells were treated for up to 48 hr with 10 µg/ml of ds and ss CT DNA in the presence or absence of Fugene 6. While CT DNA alone did not induce NO, both ds and ss CT DNA–cytofectin complexes induced NO from the cells (upper panel). These DNA–cytofectin complexes, however, had no effects on IL-12 production (lower panel). EC DNA, regardless of the presence of Fugene 6, stimulated J774 cells to produce IL-12 and NO. The NO levels in cells cultured with medium alone and Fugene 6 alone were 0·7 ± 0·02 and 3·1 ± 0·5 µm (mean ± SD), respectively, and IL-12 levels in these controls were less than 0·5 ng/ml. Each value represents a mean of triplicates. Error bars depict the standard deviations. The data are representative of at least three separate experiments.
To confirm the results with Fugene 6, similar experiments were repeated with either Lipofectin or Lipofectamine. Lipofectin and Lipofectamine are cationic liposomal transfection agents, while Fugene 6 is a multicomponent lipid-based transfection agent in a non-liposomal formulation according to the manufacturer. Similar to the experiments with CT DNA and Fugene 6, in the presence of Lipofectin or Lipofectamine, CT DNA induced NO, but not IL-12, from J774 cells, while EC DNA induced both IL-12 and NO in these cells (data not shown).
To test whether other non-stimulatory DNAs can change their activity after complexation with cytofectins, J774 cells were incubated for 48 hr with 10 µg/ml CT DNA in parallel with HP and ST DNA with or without Lipofectin. Like CT DNA, HP DNA and ST DNA in either ds or ss forms, when delivered with the cytofectin agent, induced high NO levels, while these DNAs alone had no effect on macrophage NO production (Table 1). These observations suggest that immune stimulation may be a general property of non-bacterial DNA when introduced into cells by cytofectins.
Table 1.
Induction of NO in J774 cells by vertebrate DNA
| DNA | Lipofectin (–) | Lipofectin (+) |
|---|---|---|
| Medium | 0·8 ± 0·3 | 3·5 ± 0·1 |
| CT DNA | ||
| ds | 1·1 ± 0·4 | 20·1 ± 0·9 |
| ss | 0·7 ± 0·2 | 22·5 ± 2·3 |
| HP DNA | ||
| ds | 0·4 ± 0·2 | 22·4 ± 0·7 |
| ss | 0·4 ± 0·2 | 19·3 ± 3·2 |
| ST DNA | ||
| ds | 1·2 ± 0·3 | 21·5 ± 1·9 |
| ss | 1·0 ± 0·3 | 35·2 ± 1·2 |
J774 cells were stimulated with double-stranded (ds) or single-stranded (ss) DNA alone [Lipofectin (–)] or as complexes with Lipofectin [Lipofectin (+)] and NO production measured at 48 hr as described in ‘Materials and methods’. Results presented represent levels of NO as mean ± SD µM for triplicate wells.
Influence of DNA strandedness on NO production by DNA–cytofectin complexes
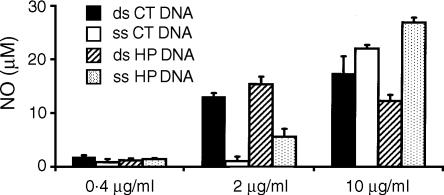
The above data show that both ss and ds CT DNAs in combination with cytofectins are able to induce NO. These observations differ from those of other investigators, who reported that only ds CT DNA in the presence of cytofectin agents could activate macrophages.15 To investigate the basis of these differences, we assessed the influence of DNA strandedness by examining the dose–response of macrophages to ds and ss CT DNA or HP DNA in the presence of cytofectin. For this purpose, RAW264·7 cells were treated with 0·4–10 µg/ml of ds and ss CT DNA or HP DNA in complexes with Fugene 6 for 48 hr, and supernatants examined for NO production. As shown in Fig. 2, there was a dose-dependent increase of NO levels in cells treated with cytofectin complexes with either ds or ss CT DNA and HP DNA, while less than 3 µm NO was found in supernatants of cells treated with ds and ss CT DNA or HP DNA alone.
Figure 2.
Dose-dependent induction of NO from macrophages. RAW264·7 cells were treated for 48 hr with 0·4–10 µg/ml of ds and ss CT DNA or HP DNA with or without Fugene 6. In the presence of the lipid agent, both the ds and ss forms of these mammalian DNA stimulated macrophages to produce NO, although ds DNA induced more NO than ss DNA at a lower dose (2 µg/ml). NO levels of < 3 µm were detected in cells cultured with medium alone, Fugene 6 alone or DNA alone. Error bars depict the standard deviations. The data are representative of at least three separate experiments.
In these experiments, ds and ss DNA showed a difference in the dose–response for NO induction. At 2 µg/ml, ds CT and HP DNA induced NO production, while their ss counterparts had much less effect. In contrast, at 10 µg/ml, both the ds and ss forms of these DNA induced NO. Our results with a low dose of DNA are thus similar to those of other investigators.15 Similar results were also obtained from repeated experiments with J774 cells (data not shown). Together, these observations suggest that macrophages respond to ds and ss DNA complexed to cytofectins at different dose thresholds.
Effects of synthetic polydeoxynucleotides–cytofectin complexes on murine macrophages
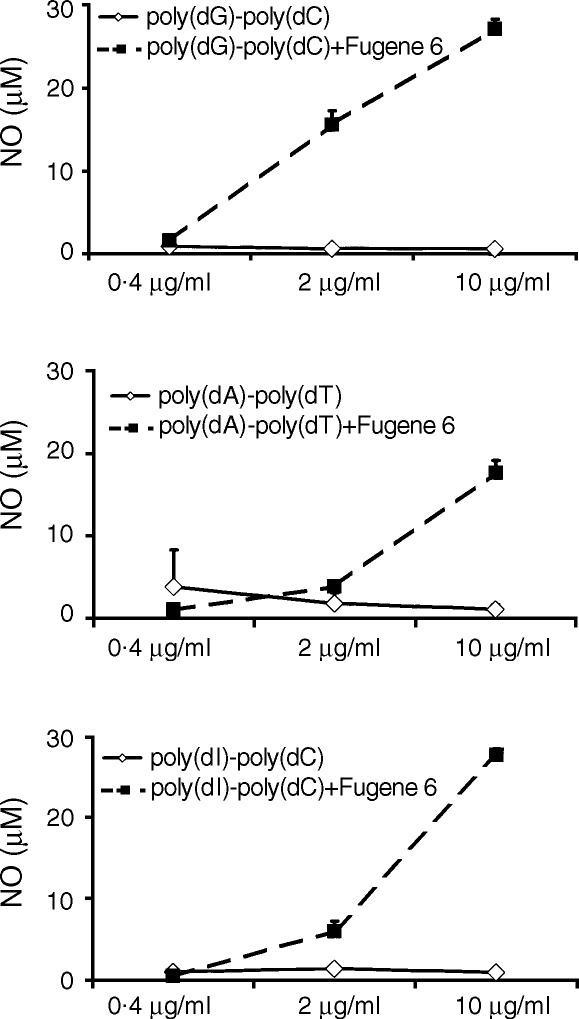
The activation of macrophages by cytofectin complexes of mammalian DNA could potentially result from unmethylated CpG motifs in these DNAs.21 To assess the role of CpG in mammalian DNA-induced macrophage activation, we examined the effects of synthetic DNA–cytofectin complexes on macrophage activation. J774 cells were treated with 0·4–10 µg/ml of poly(dA)·poly(dT), poly(dI)·poly(dG), poly(dG)·poly(dC), poly(dA), poly(dT), and poly(dC), in the presence or absence of Fugene 6 for 48 hr. As shown in Fig. 3, all three ds polynucleotides in complexes with Fugene 6 induced NO production in a dose-dependent fashion, while these polymers alone showed no effect on NO production. The three ss polynucleotides, either alone or in the presence of Fugene 6, had no stimulatory effects on J774 cells, yielding NO levels similar to medium controls (< 3 µm for treatments with medium or polymers alone). There was no increased IL-12 production in any of these synthetic DNA treatment groups (data not shown). Similar results were obtained in experiments with RAW264·7 cells (data not shown).
Figure 3.
Induction of NO in macrophages by cytofectin complexes of synthetic nucleic acids. J774 cells were treated for 48 hr with 0·4–10 µg/ml of ds poly(dG)·poly(dC), poly(dA)·poly(dT), or poly(dI)·poly(dC) with or without Fugene 6. In complexes with the cytofectin agent, all three polymers induced NO, while these DNAs alone were inactive. NO levels in cells cultured with medium alone and Fugene 6 alone were < 2 µm. Each value represents a mean of triplicates. Error bars depict the standard deviations. The data are representative of at least three separate experiments.
Effects of mammalian DNA–cytofectin complexes on DCs
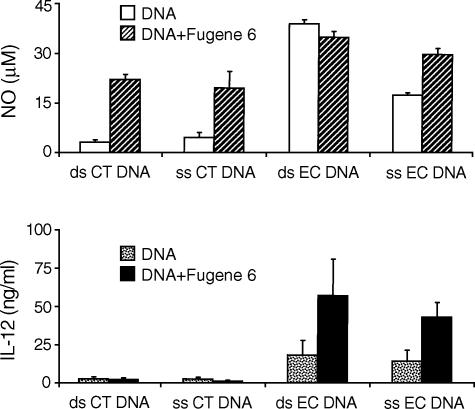
To determine whether cytofectins affect the response to DNA of another cell type, we examined the effects of DNA–cytofectin complexes on the DC, a key cell involved in the initiation and regulation of the innate and acquired immunity.22 Murine bone marrow-derived DCs were incubated with 10 µg/ml of ds or ss CT DNA in the presence or absence of Fugene 6. Native EC DNA at a dose of 10 µg/ml was used as control. CT DNA alone did not induce NO, while both ds and ss CT DNA–cytofectin complexes induced high levels of NO from the cells (Fig. 4, upper panel). The CT DNA preparations, however, had no effect on IL-12 production with or without the cytofectin agent (Fig. 4, lower panel). Stimulation of DCs with EC DNA alone or together with Fugene 6 resulted in increased NO and IL-12 production. These findings suggest that cytofectins can influence cell activation by mammalian DNA in more than one cell type.
Figure 4.
Induction of NO in dendritic cells by CT DNA–cytofectin complexes. DCs were treated as in Fig. 1, and produced high levels of NO (upper panel), but not IL-12 (lower r panel), in response to ds or ss CT DNA–cytofectin complexes. EC DNA induced both NO and IL-12. NO levels of < 4 µm and IL-12 levels of < 4 ng/ml were detected in cells cultured with medium alone or Fugene 6 alone. Each value represents a mean of triplicates. Error bars depict the standard deviations. The data are representative of at least three separate experiments.
The role of endosomes on NO induction by DNA–cytofectin complexes
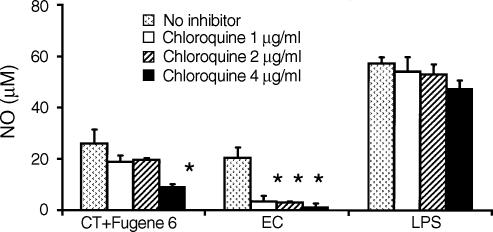
Previous studies have demonstrated that cell activation by CpG DNA can be blocked by the endosomal inhibitor chloroquine.23 To investigate the role of endosomes in DNA–cytofectin complex-induced NO production, J774 cells were pretreated with 1–4 µg/ml of chloroquine for 1 hr and then incubated for 48 hr with 10 µg/ml CT DNA in complexes with Fugene 6. As controls, 10 µg/ml EC DNA and 1 µg/ml LPS without Fugene 6 were used. As shown in Fig. 5, CT DNA–cytofectin complexes, EC DNA and LPS all induced NO production in J774 cells. Chloroquine blocked NO induction by CT DNA–cytofectin complexes and EC DNA, but not by LPS, with CT DNA–cytofectin complexes less sensitive than EC DNA to the effect of chloroquine. Our observations with EC DNA and LPS are consistent with other investigators' observations.23 These findings suggest that cell activation by CT DNA–cytofectin complexes, like that of EC DNA, is at least partially mediated through a chloroquine-sensitive intracellular signalling pathway.
Figure 5.
Effects of chloroquine on induction of NO by CT DNA–cytofectin complexes. J774 cells were pretreated with 1–4 µg/ml of chloroquine for 1 hr, followed by incubation with 10 µg/ml CT DNA in the presence of Fugene 6. EC DNA at 10 µg/ml and LPS at 1 µg/ml were used as controls. NO induction by CT DNA–cytofectin complexes was partially blocked by chloroquine. Whereas chloroquine blocked EC DNA-induced NO, it had a minimal effect on LPS activity. Error bars depict the standard deviations. The data are representative of at least three separate experiments. *P < 0·05 in a comparison of cells treated with CT DNA–cytofectin complexes or EC DNA in the presence and absence of chloroquine.
Effect of cytofectin on DNA uptake
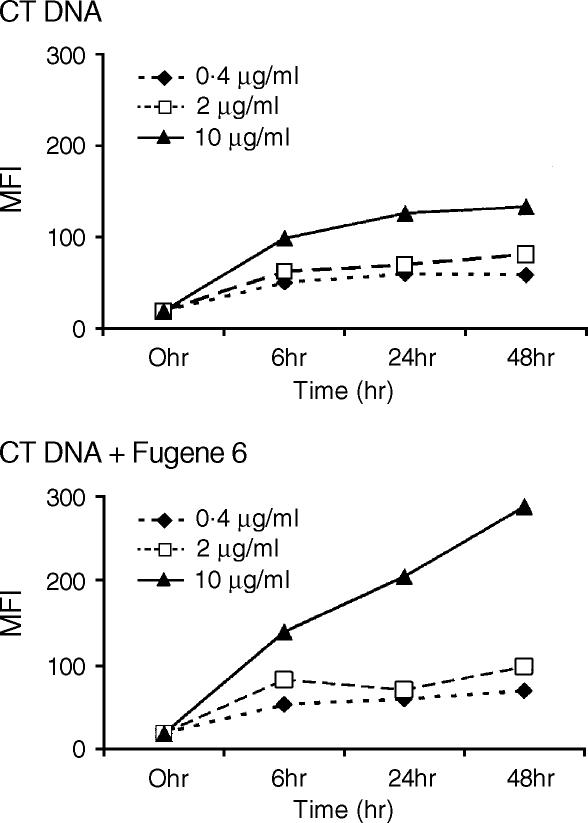
Internalization is required for cell activation by CpG DNA.3 To examine the effects of cytofectins on DNA uptake, EMA-labelled CT DNA was used for flow cytometric analysis of DNA uptake in the presence or absence of the cytofectin agent Fugene 6. J774 cells were incubated with 0·4–10 µg/ml EMA-CT DNA or the same dose range of EMA-CT DNA–Fugene 6 complexes for up to 48 hr. Cells were collected at different time-points and assessed for DNA uptake by flow cytometry. Flow cytometric analysis revealed a dose- and time-dependent increase in DNA uptake by macrophages (Fig. 6).
Figure 6.
Effect of cytofectins on CT DNA uptake by macrophages. J774 cells were incubated for up to 48 hr with 0·4–10 µg/ml EMA-CT DNA with or without Fugene 6. DNA uptake was assessed by flow cytometric analysis of the cells collected at different time-points. The levels of DNA uptake are represented as mean fluorescence intensity (MFI) for each group. There was a dose- and time-dependent increase of DNA uptake in the presence of Fugene 6.
Effect of cytofectin on intracellular distribution of DNA
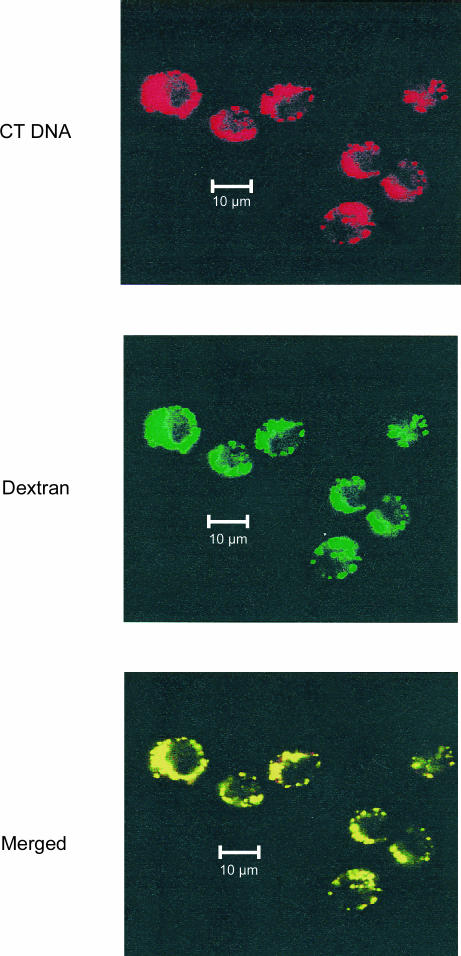
One explanation for the transformation of mammalian DNA into a stimulant by the cytofectins could be an alteration in not only the amount of DNA taken up into cells, but also the uptake pathway or localization. Endocytosis has been suggested as the main pathway for the internalization of DNA–cytofectin complexes.13 To examine the effects of cytofectins on DNA endocytosis, DNA uptake was assessed by confocal microscopic analysis in J774 cells co-incubated with EMA-CT DNA alone or complexed to Fugene 6, and Oregon green-conjugated dextran, an intracellular trafficking marker.24 After 12 hr of incubation, CT DNA and dextran were mostly co-localized in the peripheral cytoplasm in the presence (Fig. 7) or absence of Fugene 6 (data not shown). Similar results were obtained in experiments with Lipofectin. These observations indicate that DNA–cytofectin complexes use an endocytosis pathway similar to that of dextran. These findings also suggest that cytofectins do not dramatically alter the intracellular distribution pattern of mammalian DNA despite enhancing DNA uptake.
Figure 7.
Confocal microscopy analysis of intracellular distribution of CT DNA. J774 cells were simultaneously incubated with 1 µg/ml of EMA-labelled CT DNA in complexes with Fugene 6 (CT DNA) and 0·5 mg/ml Oregon green-labelled dextran (Dextran) at 37° for 12 hr. Internalized CT DNA (red-coloured) and dextran (green-coloured) were examined by confocal microscopy. CT DNA can be seen mostly co-localized (yellow-coloured) with dextran (Merged), indicating a fluid phase endocytosis pathway for DNA uptake (bar = 10 µm).
Discussion
Results presented herein provide further insight into the immune activities of DNA and suggest that immune stimulation by DNA is not solely a reflection of species origin or content of CpG motifs. Thus, in our in vitro systems with murine macrophages and dendritic cells, we have shown that the mammalian DNA is transformed from an inhibitor to a stimulant when the DNA is presented with a cytofectin. This transformation occurred with both ss and ds DNA, a finding that differs from previous observations,15 suggesting that this DNA has a unique potential for immune activation when introduced into cells. These findings raise the possibility that immune stimulation may be a more general property of DNA than previously suggested and depends on intracellular context and amount of uptake.14–16
In addition to showing that cytofectins can alter the immune properties of mammalian DNA, our studies suggest that immune stimulation by DNA may not be uniform and may lead to differential induction of pro-inflammatory molecules. In our studies, whereas mammalian DNA in cytofectin caused a significant stimulation of NO production, it did not induce IL-12 production. This difference was observed with both macrophages and DCs, suggesting a similar pattern of regulation in both cells.
As shown in previous studies, when tested in culture alone, mammalian DNA fails to stimulate B cells or macrophages and, furthermore, shows inhibitory activity against CpG DNA.5 Nevertheless, as shown herein and reported previously, the same DNA, when complexed with a cytofectin, leads to a distinctive pattern of immune stimulation that would not have been predicted on the basis of the response to free DNA.14,15 This response could be observed with ss and ds mammalian DNA as well as some ds, but not ss, synthetic polynucleotides. Furthermore, this stimulation was observed with more than one cytofectin, suggesting a general effect rather than a unique moiety created by a particular DNA or cytofectin.
A number of mechanisms could account for this stimulation. The first reflects the manner in which DNA signals the immune system. To the extent that each DNA is a mixture of stimulatory, inhibitory and neutral sequences, the outcome of this process may depend on the context in which these sequences interact with internal receptors (e.g. TLR9) following internalization. With the uptake of free DNA, it appears that the balance between inhibition and stimulation is directed toward inhibition.
In contrast to free DNA, with DNA complexed to cytofectins, stimulation appears dominant. In our experiments, all three non-bacterial DNA (CT, HP and ST) induced significant amounts of NO when presented in a cytofectin. The levels of NO induction were comparable to those induced by bacterial DNA, although, as noted above, cytokine production did not occur under these circumstances. Despite the differences between NO and cytokine production, these results suggest that, under these conditions, inhibitory sequences of a natural DNA are not operative, allowing stimulation to occur by the active motifs present. As such, these results imply that the structure–function relationship for DNA depends on the manner in which DNA is introduced into cells and that the CpG ‘rule’ does not control all encounters of DNA with cells.
To explore the role of CpG and other sequences in stimulation by DNA in cytofectin complexes, we conducted experiments with synthetic polynucleotides. In these studies, poly(dA)·poly(dT), poly(dI)·poly(dG) and poly(dG)·poly(dC) in the presence of cytofectin all activated macrophages to produce NO, despite the absence of any CpG dinucleotides. These findings indicate that CpG is unlikely to play a significant role in transformation of DNA activity in the presence of a cytofectin agent. Other investigators have reached similar conclusions regarding to the role of CpG in the cell activation by mammalian DNA–cytofectin complexes.14
To address the impact of cytofectins on DNA uptake, we performed flow cytometry and confocal microscopy. Together, these studies indicate that, while a cytofectin causes an overall increase in the amount of DNA taken up into cells, the pathway of uptake is similar to that of free DNA. Furthermore, the pattern of intracellular localization appears similar, as shown by co-localization with dextran, a endocytosis marker.24 The inhibition of immune activation by chloroquine is consistent with the role of endocytosis in uptake and stimulation by mammalian DNA.23 In these experiments, however, we cannot exclude the possibility that, with cytofectin agents, limited amounts of DNA may have access to intracellular compartments or receptors that is not possible with free DNA, and that DNA causes immune activation because of its cationic nature in these locales.
While the mechanism of action of complexed DNA requires further elucidation, these findings have a number of important implications. The first concerns the effects of cytofectin agents when used in vitro or in vivo to enhance plasmid uptake for gene therapy or as a tool to study gene regulation. As our experiments indicate, cytofectins can markedly alter the immunological properties of a DNA and transform an inactive or even an inhibitory molecule into a stimulant. This possibility should be considered in transfection experiments, especially where the modulation of an immune response is a key outcome or variable. In this regard, we have only studied the effects of complexed DNA on macrophages and DCs. It is possible that cytofectin-complexed DNA has effects on other types of immune cells or cells of other lineages.
Another implication of our studies concerns the role of self-DNA in the triggering immune responses in systemic lupus erythematosus. This prototypic autoimmune disease is characterized by antibody responses to DNA, among other nucleosomal components.25 As shown by molecular analysis of monoclonal antibodies from both human and murine sources, these antibodies have features of antigen selection, with DNA appearing to be the driving antigen.26 This conclusion has been difficult to reconcile with studies indicating that DNA is a poor immunogen and has inhibitory effects on the induction of immune responses induced by CpG DNA, among other stimulants.5
A number of lines of evidence support the notion that complexes of DNA with other molecules can alter the immune properties of DNA. Thus, as we and others have shown, complexed DNA with a cytofectin can lead to cell activation (e.g. up-regulation of costimulatory molecules) which could promote immune responses to DNA, among other antigens.14,15 Furthermore, DNA or nucleosomes, when bound to antibodies in the form of immune complexes, can induce IFN-α/β and lead to activation of certain B-cell populations by a mechanism dependent on TLR9.27 In these situations, anti-DNA antibodies may function as a cytofectin and lead to higher intracellular concentrations of DNA than possible with free DNA or access to other intracellular compartments, resulting in cell activation.28 Studies are currently in progress to address this possibility.
Acknowledgments
We thank Drs J. Brice Weinberg and Farshid Guilak, Ms. Mary Misukonis and Mr Robert Nielson for their advice and assistance in this study. This work was supported by grants from the VA Merit Review, the Arthritis Foundation and NIH grant AI44808.
Abbreviations
- BMMC
bone marrow-derived macrophage
- CpG
cytosine phosphate guanosine dinucleotide
- CT
calf thymus
- DC
dendritic cell
- ds
double-stranded
- EC
Escherichia coli
- EMA
ethidium monoazide
- FITC
fluorescein isothiocyanate
- HP
human placental
- NO
nitric oxide
- ODN
oligodeoxynucleotide
- PDN
polydeoxynucleotides
- ss
single-stranded
- ST
salmon testes
References
- 1.Tokunaga T, Yamamoto H, Shimada S, et al. Antitumor activity of deoxyribonucleic acid fraction from Mycobacterium bovis BCG. I. Isolation, physicochemical characterization, and antitumor activity. J Natl Cancer Inst. 1984;72:955–62. [PubMed] [Google Scholar]
- 2.Messina JP, Gilkeson GS, Pisetsky DS. Stimulation of in vitro murine lymphocyte proliferation by bacterial DNA. J Immunol. 1991;147:1759–64. [PubMed] [Google Scholar]
- 3.Krieg AM, Yi AK, Matson S, Waldschmidt TJ, Bishop GA, Teasdale R, Koretzky GA, Klinman DM. CpG motifs in bacterial DNA trigger direct B-cell activation. Nature. 1995;374:546–9. doi: 10.1038/374546a0. [DOI] [PubMed] [Google Scholar]
- 4.Krieg AM, Wu T, Weeratna R, et al. Sequence motifs in adenoviral DNA block immune activation by stimulatory CpG motifs. Proc Natl Acad Sci USA. 1998;95:12631–6. doi: 10.1073/pnas.95.21.12631. [DOI] [PMC free article] [PubMed] [Google Scholar]
- 5.Pisetsky DS, Reich CF. Inhibition of murine macrophage IL-12 production by natural and synthetic DNA. Clin Immunol. 2000;96:198–204. doi: 10.1006/clim.2000.4897. [DOI] [PubMed] [Google Scholar]
- 6.Verthelyi D, Ishii K, Gursel M, Takeshita F, Klinman D. Human peripheral blood cells differentially recognize and respond to two distinct CpG motifs. J Immunol. 2001;166:2372–7. doi: 10.4049/jimmunol.166.4.2372. [DOI] [PubMed] [Google Scholar]
- 7.Hemmi H, Takeuchi O, Kawai T, et al. A Toll-like receptor recognizes bacterial DNA. Nature. 2000;408:740–5. doi: 10.1038/35047123. [DOI] [PubMed] [Google Scholar]
- 8.Pisetsky DS, Reich CF, Crowley SD, Halpern MD. Immunological properties of bacterial DNA. Ann N Y Acad Sci. 1995;772:152–63. doi: 10.1111/j.1749-6632.1995.tb44740.x. [DOI] [PubMed] [Google Scholar]
- 9.Lipford GB, Heeg K, Wagner H. Bacterial DNA as immune cell activator. Trends Microbiol. 1998;6:496–500. doi: 10.1016/s0966-842x(98)01408-5. [DOI] [PubMed] [Google Scholar]
- 10.Zhu FG, Reich CF, Pisetsky DS. Inhibition of murine macrophage nitric oxide production by synthetic oligonucleotides. J Leukoc Biol. 2002;71:686–94. [PubMed] [Google Scholar]
- 11.MacMicking J, Xie QW, Nathan C. Nitric oxide and macrophage function. Annu Rev Immunol. 1997;15:323–50. doi: 10.1146/annurev.immunol.15.1.323. [DOI] [PubMed] [Google Scholar]
- 12.Chesnoy S, Huang L. Structure and function of lipid-DNA complexes for gene delivery. Annu Rev Biophys Biomol Struc. 2000;29:27–47. doi: 10.1146/annurev.biophys.29.1.27. [DOI] [PubMed] [Google Scholar]
- 13.Zabner J, Fasbender AJ, Moninger T, Poellinger KA, Welsh MJ. Cellular and molecular barriers to gene transfer by a cationic lipid. J Biol Chem. 1995;270:18997–9007. doi: 10.1074/jbc.270.32.18997. [DOI] [PubMed] [Google Scholar]
- 14.Suzuki K, Mori A, Ishii KJ, Saito J, Singer DS, Klinman DM, Krause PR, Kohn LD. Activation of target-tissue immune-recognition molecules by double-stranded polynucleotides. Proc Natl Acad Sci USA. 1999;96:2285–90. doi: 10.1073/pnas.96.5.2285. [DOI] [PMC free article] [PubMed] [Google Scholar]
- 15.Ishii KJ, Suzuki K, Coban C, Takeshita F, Itoh Y, Matoba H, Kohn LD, Klinman DM. Genomic DNA released by dying cells induces the maturation of APCs. J Immunol. 2001;167:2602–7. doi: 10.4049/jimmunol.167.5.2602. [DOI] [PubMed] [Google Scholar]
- 16.Pisetsky DS, Reich CF. The influence of lipofectin on the in vitro stimulation of murine spleen cells by bacterial DNA and plasmid DNA vectors. J Interferon Cytokine Res. 1999;19:1219–26. doi: 10.1089/107999099313163. [DOI] [PubMed] [Google Scholar]
- 17.Lutz MB, Kukutsch N, Ogilvie AL, Rossner S, Koch F, Romani N, Schuler G. An advanced culture method for generating large quantities of highly pure dendritic cells from mouse bone marrow. J Immunol Meth. 1999;223:77–92. doi: 10.1016/s0022-1759(98)00204-x. [DOI] [PubMed] [Google Scholar]
- 18.Green LC, Wagner DA, Glogowski J, Skipper P, Wishnok JS, Tannenbaum SR. Analysis of nitrate, nitrite, and [15N]nitrate in biological fluids. Anal Biochem. 1982;126:131–8. doi: 10.1016/0003-2697(82)90118-x. [DOI] [PubMed] [Google Scholar]
- 19.Swiggard WJ, Mirza A, Nussenzweig MC, Steinman RM. DEC-205, a 205-kDa protein abundant on mouse dendritic cells and thymic epithelium that is detected by the monoclonal antibody NLDC-145: purification, characterization, and N-terminal amino acid sequence. Cell Immunol. 1995;165:302–11. doi: 10.1006/cimm.1995.1218. [DOI] [PubMed] [Google Scholar]
- 20.Sutterwala F, Mosser DM. The taming of IL-12: suppressing the production of proinflammatory cytokines. J Leukoc Biol. 1999;65:543–51. [PubMed] [Google Scholar]
- 21.Bird AP. CpG-rich islands and the function of DNA methylation. Nature. 1986;321:209–13. doi: 10.1038/321209a0. [DOI] [PubMed] [Google Scholar]
- 22.Banchereau J, Steinman RM. Dendritic cells and the control of immunity. Nature. 1998;392:245–52. doi: 10.1038/32588. [DOI] [PubMed] [Google Scholar]
- 23.Yi AK, Tuetken R, Redford T, Waldschmidt M, Kirsch J, Krieg AM. CpG motifs in bacterial DNA activate leukocytes through the pH-dependent generation of reactive oxygen species. J Immunol. 1998;160:4755–61. [PubMed] [Google Scholar]
- 24.Klein G, Satre M. Kinetics of fluid-phase pinocytosis in Dictyostelium discoideum amoebae. Biochem Biophys Res Commun. 1986;138:1146–52. doi: 10.1016/s0006-291x(86)80402-8. [DOI] [PubMed] [Google Scholar]
- 25.Amoura Z, Piette JC, Bach JF, Koutouzov S. The key role of nucleosomes in lupus. Arthritis Rheum. 1999;42:833–43. doi: 10.1002/1529-0131(199905)42:5<833::AID-ANR1>3.0.CO;2-T. [DOI] [PubMed] [Google Scholar]
- 26.Pisetsky DS. Anti-DNA autoantibodies. Curr Opin Rheumatol. 2000;12:364–8. doi: 10.1097/00002281-200009000-00002. [DOI] [PubMed] [Google Scholar]
- 27.Leadbetter EA, Rifkin R, Hohlbaum AM, Beaudette BC, Shlomchik MJ, Marshak-Rothstein A. Chromatin-IgG complexes activate B cells by dual engagement of IgM and Toll-like receptors. Nature. 2002;416:603–7. doi: 10.1038/416603a. [DOI] [PubMed] [Google Scholar]
- 28.Koutouzov S, Cabrespines A, Amoura Z, Chabre H, Lotton C, Bach JF. Binding of nucleosomes to a cell surface receptor: redistribution and endocytosis in the presence of lupus antibodies. Eur J Immunol. 1996;26:472–86. doi: 10.1002/eji.1830260230. [DOI] [PubMed] [Google Scholar]


