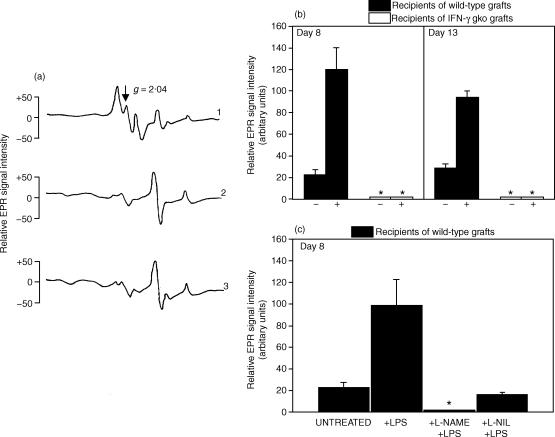
Figure 4.
Representative plots of the EPR spectroscopy signals observed in intestinal tissue (a). Mice were injected with the NO spin trapping agents DETC and FeSO4. The relative EPR spectroscopy signal intensities of ON-Fe2+–(DETC)2 complexes were expressed in arbitrary units, which were calculated by measuring the distance from the peak to the trough of the triplet hyperfine structure at the g = 2·04 location. Plot 1 shows the signal from an LPS-injected wild-type graft recipient on day 8. The background signal observed in intestinal tissue from a B6D2F1 control mouse is shown in plot 2. Plot 3 shows the signal from an IFN-γ gko graft recipient on day 8. The upper bar graph (b) shows the NO levels in intestinal tissue from recipients of wild-type grafts and recipients of IFN-γ gko grafts on days 8 and 13 post-induction. The levels for mice that either did (+), or did not (–) receive LPS are shown. The lower bar graph (c) presents results from another experiment in which NO levels were measured in intestinal tissue from recipients of wild-type grafts that were either untreated or that had been injected with either LPS only, l-NAME followed by LPS, or l-NIL followed by LPS. The experiment in (c) was performed on day 8 and all recipients were injected with NO spin-trapping agents 30 min before they were killed. In (b) and (c), an asterisk indicates that a triplet-hyperfine structure produced by the NO-Fe2+–(DETC)2 complex could not be detected by EPR spectroscopy. Error bars in (b) and (c) represent the standard error of the mean NO level determined for three individual mice and the data are expressed as the mean, relative EPR spectroscopy signal intensities of each ON-Fe2+–(DETC)2 complex after subtraction of the Cu2+–(DETC)2 signal. In (b), the LPS-induced NO level was significantly higher than the constitutive level on days 8 (P < 0·001) and 15 (P < 0·01). Similarly, the LPS-induced NO level was significantly higher than the constitutive level in (c) (P < 0·01). It was also significantly higher than the levels observed when l-NAME (P < 0·01) and l-NIL (P < 0·01) were used. Statistical analyses were performed using anova followed by a Tukey–Kramer multiple comparison test.

