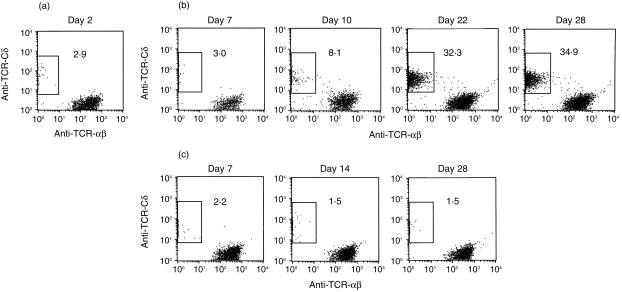
Figure 2.
Kinetics of TCR αβ and γδ T cells in the kidneys after intrarenal injection with L. monocytogenes. (a) Profiles of TCR αβ and γδ T cells from right kidneys of mice on day 2 of infection. The profiles of TCR αβ and γδ expressions in T cells from the right kidneys of mice whose urine contained L. monocytogenes on day 7 of infection (b) and those of mice whose urine did not contain L. monocytogenes on day 7 of infection (c). The analysis gate was set on CD3+ cells. The data shown are representative of the results from individual analyses of 32 mice.

