Abstract
We investigated the function of CD56+ CD8+ T cells (CD56+ T cells) and CD56− CD57+ CD8+ T cells (CD57+ T cells; natural killer (NK)-type T cells) and compared them with those of normal CD56− CD57− CD8+ T cells (CD8+ T cells) and CD56+ NK cells from healthy volunteers. After the stimulation with immobilized anti-CD3 antibodies, both NK-type T cells produced much larger amounts of interferon-γ (IFN-γ) than CD8+ T cells. Both NK-type T cells also acquired a more potent cytotoxicity against NK-sensitive K562 cells than CD8+ T cells while only CD56+ T cells showed a potent cytotoxicity against NK-resistant Raji cells. After the stimulation with a combination of interleukin (IL)-2, IL-12 and IL-15, the IFN-γ amounts produced were NK cells ≥ CD56+ T cells ≥ CD57+ T cells > CD8+ T cells. The cytotoxicities against K562 cells were NK cells > CD56+ T cells ≥ CD57+ T cells > CD8+ T cells while cytotoxicities against Raji cells were CD56+ T cells > CD57+ T cells ≥ CD8+ T cells ≥ NK cells. However, the CD3-stimulated proliferation of both NK-type T cells was smaller than that of CD8+ T cells partly because NK-type T cells were susceptible to apoptosis. In addition to NK cells, NK-type T cells but not CD8+ T cells stimulated with cytokines, expressed cytoplasmic perforin and granzyme B. Furthermore, CD3-stimulated IFN-γ production from peripheral blood mononuclear cells (PBMC) correlated with the proportions of CD57+ T cells in PBMC from donors. Our findings suggest that NK-type T cells play an important role in the T helper 1 responses and the immunological changes associated with ageing.
Introduction
In addition to normal CD8+ T cells without natural killer (NK) cell markers, CD8+ T cells with NK cell markers are also present in the peripheral blood of humans. These NK-type T cells include both CD56+ T cells and CD57+ T cells.1,2 CD56 is now known as neural cell adhesion molecule-13 and CD57 is a sulphated carbohydrate determinant on a glycoprotein of neural cells.4 These cells are relatively rare in the peripheral blood, lymph nodes and spleen but are relatively abundant in the liver and bone marrow.5 We recently reported that CD56+ T cells in peripheral blood can be a potent antitumour effector after stimulation with interleukin (IL)-2 and IL-12.6 On the other hand, researchers have noticed that CD57+ T cells increased under certain conditions. CD57+ T cells increase in patients after bone marrow and other organ transplantations,7,8 in rheumatoid arthritis patients9,10 and acquired immune deficiency patients,11 thus suggesting that these cells play a certain role in the immunological abnormalities in those patients. It was recently reported that CD57+ T cells produced a larger amount of interferon-γ (IFN-γ) than normal T cells.12 Importantly, these cells, which have been suggested to differentiate extrathymically,5 are also known to increase in older adults and seem to play an important role in the immunological changes that take place with ageing.13 Previous reports have shown that the proliferation capacity and cytokine production of T cells change with age.14,15 For example, mitogen-induced T-cell proliferation and IL-2 production decreased15–17 while IFN-γ production tended to increase with ageing.15,18 However, these phenomena cannot be precisely defined without also considering NK-type T cells. In addition, there has so far been no report in which the functions of CD56+ T cells and CD57+ T cells were simultaneously investigated, presumably because these T-cell populations are rare in peripheral blood mononuclear cells (PBMC; 2–5% and 5–10% in PBMC, respectively) and, to a significant degree, tend to overlap. Therefore, it is important to comprehensively clarify the functional characteristics and differences among CD56+ T cells, CD57+ T cells, normal CD8+ T cells and NK cells. In the present study, we demonstrate the unique functional features of NK-type T cells, in view of IFN-γ production and antitumour cytotoxicity (including perforin and granzyme B production). Furthermore, we show that the increase in the number of CD57+ T cells in PBMC is closely related to the enhanced IFN-γ production from CD3-stimulated PBMC. In addition, T-cell receptor β repertoires of CD57+ T cells and CD56+ T cells were different, suggesting that these NK-type subsets are distinct populations. We argue that the increased number of CD57+ T cells in aged hosts does not necessarily mean the impaired immunocompetence with ageing and seems to be a biological adaptation to the immunological events occurring in older hosts.
Materials and Methods
Peripheral blood samples
Heparinized peripheral blood samples were obtained from adult and young adult volunteers. Samples of children were obtained at the outpatient clinic of National Defense Medical College Hospital from children without any significant clinical features who visited for routine examinations. Informed consent was obtained from all parents.
Isolation of PBMC, monoclonal antibodies (mAb) and flow cytometric analysis
PBMC were obtained from peripheral blood by Lymphocyte Separation Medium (ICN Biomedicals Inc., Aurora, OH). Surface phenotypes of the PBMC were identified by mAb in conjunction with three-colour immunofluorescence tests. mAb used in this study were as follows: phycoerythrin (PE) or fluoroscein isothiocyanate (FITC)-anti-CD3 antibody (UCHT1), PE-anti-αβ T-cell receptor (TCR) antibody or PC5-anti-αβ TCR antibody, FITC-anti-CD57 antibody (NC1), PE-anti-CD56 antibody (NKH-1), PC5-anti-CD56 antibody PE-anti-CD4 antibody, PE-anti-CD8 antibody, PE-anti-NKG2A antibody and FITC-anti-Vα24 antibody, all of which were purchased from Beckman Coulter (Miami, FL). FITC-anti-αβ TCR antibody was purchased from PharMingen, San Diego, CA. NK-type T cells were identified by staining PBMC with FITC-anti-CD57 antibody, PE-anti-αβ TCR antibody and PC5-anti-CD56 antibody. NK cells were identified by FITC-anti-CD3 antibody and PE-anti-CD56 antibody. Other cell markers of each subset were also identified with three-colour immunofluorescence tests. Lymphocytes were gated by forward scatter and side scatter and were analysed by EPICS XL (Beckman Coulter).
Cell sorting and culture
PBMC were stained with FITC-anti-CD4 antibody (T4, Beckman Coulter) and FITC-anti-γδTCR antibody (IMMU510, Beckman Coulter) and CD4+ T cells and γδ T cells were depleted by magnetic-activated cell sorting (MACS; Miltenyi Biotec GmbH, Bergisch Gladbach, Germany) using anti-FITC-microbeads. More than 95% of CD4+ T cells and γδ T cells were depleted by this procedure. Thereafter, PBMC were stained with FITC-anti-CD57 antibody, PE-anti-αβ T-cell TCR antibody and PC5-anti-CD56 antibody. CD56+ αβ TCR− NK cells, CD56+ αβ TCR+ cells, CD56− CD57+ αβ TCR+ cells and CD56− CD57− αβ TCR+ cells were purified by EPICS Elite (Beckman Coulter) (purity of each population was more than 95%).
For the depletion of NK-type T cells, whole PBMC were stained with FITC anti-αβ TCR antibody and either with PE-anti-CD56 antibody, anti-CD57 antibody or both PE-anti-CD56 antibody and anti-CD57 antibody, while either CD56+ T cells or CD57+ T cells, or both of them were sorted out.
One hundred µl (5 µg/ml) of Ant-CD3 antibody (UCHT1) had been incubated at 37° for 4 hr in 96-well flat-bottomed plates to immobilize the antibody before starting culture. Cells of each T-cell population (2 × 10⁵ in 200 µl of RPMI-1640 containing 20% human serum) were cultured with immobilized anti-CD3 antibody in a 96-well flat-bottomed plate. Each T-cell and NK-cell population was also incubated with 20 ng/ml of human IL-12 (PEPRO TECH EC, London, UK), 100 ng/ml of IL-2 (PEPRO TECH EC) and 5 ng/ml of IL-15 (Genzyme, Cambridge, MA). After a 48-hr culture, the supernatants were harvested and maintained at −80° for enzyme-linked immunosorbent assay (ELISA). After a 4-day culture, the cells were harvested and then subjected to cytotoxic assays.
Assays for IFN-γ levels
IFN-γ levels in lymphocyte culture supernatants were evaluated using the cytokine-specific ELISA (OptEIATM, PharMingen).
Cytotoxic assay
NK-sensitive K562 cells or NK-resistant Raji cells were labelled with 100 µCi Na2(51Cr)O4 for 60 min at 37° in RPMI-1640 medium containing 10% fetal calf serum (FCS), washed three times with medium, and subjected to cytotoxicity assays. Labelled targets (4 × 10³/well) were incubated in a total volume of 200 µl with effector cells which had been stimulated with anti-CD3 antibody or cytokines for 4 days (E : T ratio = 10 : 1) in RPMI-1640 in 96-well round-bottomed microtitre plates. The plates were centrifuged after incubation for 4 hr, after which the supernatant was harvested and counted with a gamma counter. In some experiments, after a 4-day culture with cytokines, 5 × 10⁵ CD56+ CD3− NK cells were incubated with 50 µl of anti-NKG2A antibody (200 µg/ml, mouse immunoglobulin G (IgG)2b, Coulter; isotype antibody as a control) for 10 min at 4° to block an inhibitory NK cell receptor for major histocompatibility complex (MHC) class I molecules, NKG2A/CD94 complex, washed twice and then subjected to cytotoxic assay against Raji cells.
The cytotoxicity was calculated as the percentage of releasable counts after subtraction of spontaneous release. Spontaneous release was less than 15% of the maximum release.
Intracellular staining of perforin and granzyme B
For intracellular staining, the cells were first stained with cell surface FITC, PE or PC5 mAb, washed, and then fixed and permeabilized in 250 µl of Cytofix/Cytoperm TM (PharMingen) for 20 min at 4°, washed twice, and incubated with intracellular mAb, i.e. FITC-anti-human perforin antibody (Ancell, Bayport, MN) or PE-anti-human granzyme B antibody (Caltag, Burlingame, CA) for 30 min at 4°. The cells were then washed and immediately applied to a flow cytometric analyser (EPICS XL, Beckman Coulter).
DNA synthesis assay
To test the proliferation of each CD8+ T-cell subset (2 × 10⁵/200 µl) by stimulation with anti-CD3 mAb, the cells were pulsed with 0·5 µCi per well of [3H]thymidine ([3H]-TdR) 12 hr before the cells were harvested. The radioactivities of the harvested cells at indicated culture time points were assessed by the liquid scintillation counting method.
Assay for lymphocyte apoptosis
An assay for reactivity to annexin V19 in apoptotic cells was performed using commercial reagents (Immunotech, Marseille, France) according to the manufacturer's instructions. After staining the cells with FITC–annexin V and propidium iodide, cells were applied to a flow cytometric analyser (EPICS XL, Beckman Coulter).
Analysis of Vβ TCR repertoire of CD56+ T cells, CD57+ T cells and normal CD8+ T cells
After depleting the CD4+ T cells from PBMC by magnetic beads, the cells were then analysed by three-colour flow cytometry using anti-αβ TCR antibody, anti-CD56 antibody and anti-CD57 antibody, and various anti-Vβ TCR antibodies, anti-CD56 antibody and anti-CD57 antibody (Beckman Coulter). Anti-Vβ TCR antibodies that reportedly reacted with relatively larger populations of αβ T cells were selected and used. The percentage of each Vβ T-cell population was determined in CD56+ T cells, CD57+ T cells and normal CD8+ T cells as follows:
% of Vβ T cells in CD56+ T cells = (% CD56+ Vβ T cells/% CD56+ αβ T cells) × 100
% of Vβ T cells in CD57+ T cells = (% CD56− CD57+ Vβ T cells/% CD56− CD57+ αβ T cells) × 100
% Vβ T cells in CD56− CD57− αβ T cells (normal CD8+ T cells) = (% CD56− CD57− Vβ T cells/% CD56− CD57− αβ T cells) × 100.
Statistical analysis
Differences between the groups were analysed by the Mann–Whitney U-test or an anova analysis with Fisher's protected least significant difference (PLSD) using the Stat View program on an Apple computer. Differences were considered to be significant when P < 0·05.
Results
Phenotypic characterization of NK-type T cells, normal T cells and NK cells
CD56+ αβ T cells and CD57+ αβ T cells from PBMC were, in a significant part, phenotypically overlapped (CD56+CD57+). Approximately 60% of the CD56+ T cells were CD57+ while one-quarter of the CD57+ T cells were CD56+(Table 1). Most of both NK-type T cells were CD8+ and Vα24−. In addition, half of the CD56+ T cells and two-thirds of CD3− CD56+ NK cells expressed CD161 (NKR-P1). NKG2A was expressed on NK cells but not on the majority of the other subsets.
Table 1.
Phenotypic characterization of respective populations as expression of other markers
| CD56+ CD57+ (%) | CD161 (%) | TCR Vα24 (%) | NKG2A (%) | CD4 (%) | CD8 (%) | |
|---|---|---|---|---|---|---|
| CD56+ αβ T cells | 61·3 ± 17·1 | 50·2 ± 16·6 | 0·6 ± 0·1 | 7·2 ± 3·0 | 7·0 ± 4·3 | 91·1 ± 3·8 |
| CD57+ αβ T cells | 24·8 ± 0·6 | 11·7 ± 5·2 | < 0·1 | 1·2 ± 1·0 | 8·9 ± 3·9 | 89·5 ± 4·0 |
| CD56– CD57– αβ T cells | – | 14·3 ± 2·2 | 0·3 ± 0·1 | 0·6 ± 0·2 | 69·1 ± 8·0 | 28·8 ± 3·2 |
| CD3– CD56+ NK cells | 70·2 ± 13·3 | 68·7 ± 8·6 | – | 58·2 ± 8·8 | – | – |
Data shown represent the means± SE (n = 8).
IFN-γ production and antitumour cytotoxicity in CD3-stimulated T-cell subsets
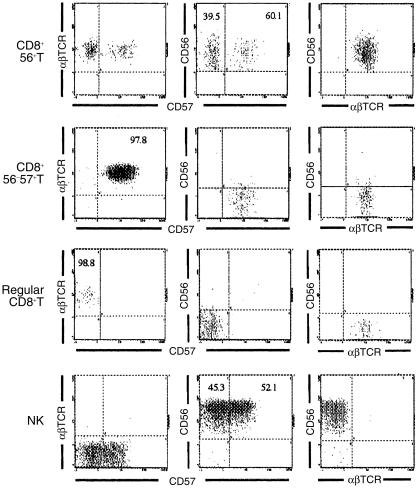
Because CD56+ T cells are a small population within PBMC, and it was recently reported that the cytolytic effector of CD8+ T cells closely correlated with surface CD56 expression,6,20 CD56+ CD57+ T cells were included in sorted CD56+ T cells while CD56− CD57+ T cells were purified so as not to contain CD56+ CD57+ T cells (Fig. 1). Because most CD56+ T cells and CD57+ T cells were CD8+ (Table 1), the CD4+ T cells (and also γδ T cells) were initially depleted from PBMC by magnetic beads as described in Materials and Methods. Thereafter, CD8+ CD56+ T cells, CD8+ CD57+ T cells and normal CD56− CD57− CD8+ T cells were purified by a cell sorter. Phenotypic profiles of each sorted population and their purity are shown in Fig. 1.
Figure 1.
A phenotypic profile and the purity of each sorted lymphocyte subset. The numbers in each profile indicate the percentages of cells within indicated quadrants.
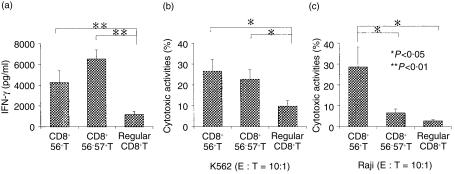
After the stimulation with immobilized anti-CD3 antibody for 48 hr, both NK-type T cells, especially CD57+ T cells, produced much greater amounts of IFN-γ than did CD8+ T cells (Fig. 2a). However, none of the subsets produced any detectable IL-4 (data not shown). Four days after the CD3 stimulation both NK-type T cells were more cytotoxic against NK-sensitive K562 cells than CD8+ T cells (Fig. 2b). On the other hand, CD3-stimulated CD56+ T cells, but not the other two T-cell populations, acquired a potent cytotoxicity against NK-resistant Raji cells (Fig. 2c).
Figure 2.
CD3-stimulated IFN-γ production and antitumour cytotoxicity in the T cell subsets. (a) IFN-γ production. Each purified T-cell population was stimulated with anti-CD3 antibody for 48 hr and the IFN-γ levels of the culture supernatants were subjected to ELISA. (b) Cytotoxic activity against K562 cells. (c) Cytotoxic activity against Raji cells. Each purified cell population was stimulated with anti-CD3 antibody for 4 days and cytotoxic assays were performed. All data represented are the means± SE from eight independent experiments.
Cytokine-stimulated IFN-γ production and antitumour cytotoxicity in NK cells and T-cell subsets
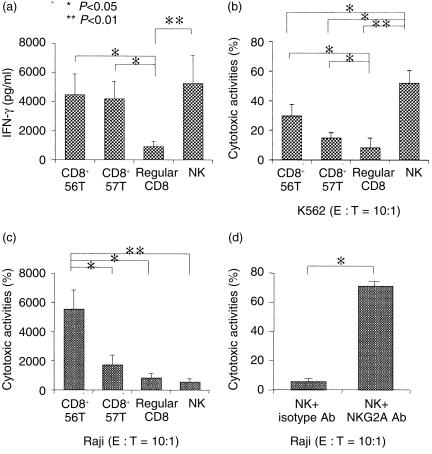
When each population was stimulated with a combination of IL-2, IL-12 and IL-15 for 48 hr, both NK-type T cells produced larger amounts of IFN-γ than that of CD8+ T cells (Fig. 3a). CD56+ NK cells (including CD56+ CD57+ cells and CD56+ CD57− cells) also produced a large amount of IFN-γ (Fig. 3a). NK cells cultured with cytokines for 4 days showed the greatest cytotoxicity against K562 cells, while both NK-type T cells showed stronger cytotoxicities than did CD8+ T cells (Fig. 3b). The cytokine-stimulated CD56+ T cells also showed a greater cytotoxicity against Raji cells than did the other T-cell subsets or NK cells (Fig. 3c). We also previously reported that IL-2- and IL-12-activated CD56+ T cells also effectively killed another NK-resistant tumour, namely Wish cells.6 It was also interesting to note that the cytotoxic activity of NK cells against Raji cells (MHC class-I positive)21 was greatly enhanced by blocking the CD94/NKG2A complex on NK cells by NKG2A antibody, but not by the isotype antibody (Fig. 3d).
Figure 3.
Cytokine-stimulated IFN-γ production and antitumour cytotoxicity in various lymphocyte subsets, and enhancement of the cytotoxicity against Raji cells by blocking NKG2A. (a) IFN-γ production. Each purified population was stimulated with a combination of IL-2, IL-12 and IL-15 for 48 hr and IFN-γ levels of the culture supernatants were subjected to ELISA. Cytotoxic activity against K562 cells (b) or Raji cells (c). Each purified cell population was stimulated with cytokines for 4 days and cytotoxic assays were performed. All data represented are the means± SE from five to eight independent experiments. (d) The augmentation of the cytotoxicity against Raji cells of cytokine-stimulated NK cells by blocking NKG2A. Purified NK cells were cultured for 4 days and incubated with NKG2A antibody (200 µg/ml) (mouse IgG2b antibody as a control) at 4° for 10 min and washed twice and then cytotoxic assays were performed. The data represented are the means± SE from four independent experiments.
Expression of cytoplasmic perforin and granzyme B in NK cells and both NK-type T cells after cytokine stimulation
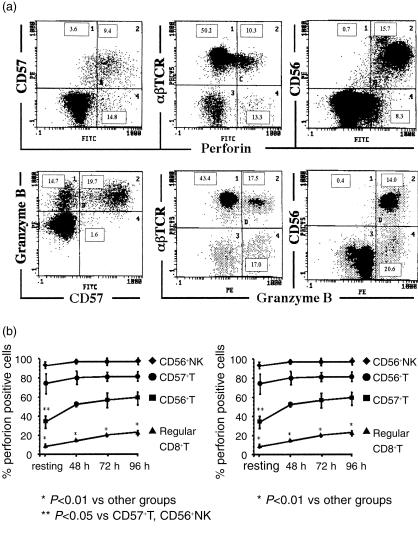
To explore the mechanism for the cytotoxicities of the subsets, both cytoplasmic perforin and granzyme B were examined because the perforin–granzyme B pathway is one of main pathways of target cell lysis.22–24 Perforin causes membrane pore formation of target cells and granzyme B enters into target cells through the pores made by perforin, thereby inducing target apoptosis.22–24 After stimulation of the whole PBMC for 72 hr with a combination of IL-2, IL-12 and IL-15, most of CD57+ cells and CD56+cells were either cytoplasmic perforin or granzyme B positive while most of αβ T cells were negative for either perforin or granzyme B (Fig. 4a). By gating each subset using the three-colour flow cytometric analysis, the percentage of perforin or granzyme B positive cells in each subset was examined after cytokine stimulation at the indicated time points (n = 4) (Fig. 4b). Most of the NK cells and CD57+ T cells were positive for perforin and granzyme B at every time point (Fig. 4a,b). In contrast, only a small population of CD8+ T cells expressed cytoplasmic perforin or granzyme B. Interestingly, the percentage of perforin-positive NK cells and CD57+ T cells in a resting state (before cytokine stimulation) was larger than that in resting CD56+ T cells, and even after culture, the proportion of perforin-positive CD56+ T cells tended to be smaller than that of NK cells and CD57+ T cells (Fig. 4a). Because four-colour flow cytometric analysis was not performed, we could not directly determine the percentage of perforin-positive CD56− CD57+ T cells; however, it is suggested that most of the CD56− CD57+ T cells have cytoplasmic perforin, similar to CD56+ NK cells.
Figure 4.
The expression of cytoplasmic perforin and granzyme B in NK cells and both NK-type T cells after cytokine stimulation. (a) 72 hr after stimulation of PBMC with a combination of IL-2, IL-12 and IL-15, either cytoplasmic perforin or granzyme B of CD57+ cells, CD56+ cells and normal CD8+ cells were examined. (b) A time course analysis of the proportion of either cytoplasmic perforin- or granzyme-B-expressing cells in each lymphocyte subset. By gating each subset in the three-colour flow cytometric analysis, the percentage of perforin- or granzyme-B-positive cells in each subset was examined after cytokine stimulation at the indicated time points (n = 4).
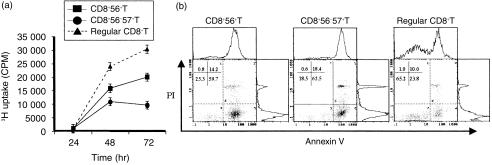
NK-type T cells proliferated weakly in response to CD3-stimulation and were susceptible to apoptosis
Purified CD8+ T cells and NK-type T cells were stimulated by anti-CD3 antibody and then were compared for their proliferation. The results showed that normal CD8+ T cells proliferated vigorously while NK-type T cells, especially CD57+ T cells, proliferated less vigorously (Fig. 5a). It was also revealed by the PI and annexin V staining findings that both NK-type T cells were more susceptible to apoptosis than normal CD8+ T cells (Fig. 5b).
Figure 5.
CD3-stimulated proliferation and apoptosis of each T-cell subset. Each T-cell population was stimulated with immobilized anti-CD3 antibody for the indicated hours and the cells were pulsed with [3H]thymidine for 12 hr before the cells were harvested (a). Representative results are shown from repeated experiments with similar results. Each T-cell population was stimulated for 48 hr and stained with propidium iodide (PI) and FITC–annexin V and then was analysed by flow cytometry (b). Representative results were shown from repeated experiments with similar results.
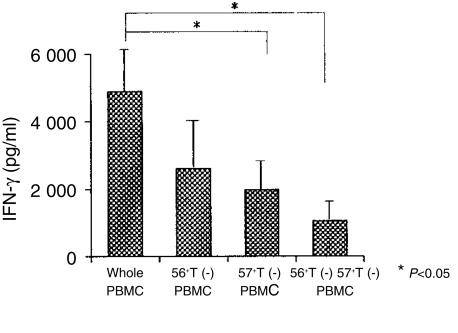
The decrease in the CD3-stimulated IFN-γ production from PBMC in vitro by the depletion of either CD57+ T cells, CD56+ T cells or both populations
To further confirm the importance of NK-type T cells for the CD3-stimulated IFN-γ production from PBMC, IFN-γ production from NK-type T-cell-depleted PBMC was examined. CD56+ αβ T cells, CD57+ αβ T cells or both were depleted by a cell sorter, as described in Materials and Methods, and NK-type T-cell-depleted PBMC were stimulated for 48 hr. The results showed that NK-type T cells, especially CD57+ T cells, were an important cellular component for effective IFN-γ production by PBMC (Fig. 6).
Figure 6.
NK-type T cells as a major source for the production of IFN-γ in CD3-stimulated PBMC. NK-type T-cell-depleted PBMC were cultured with anti-CD3 antibody for 48 hr and their IFN-γ production capacities were compared with those of whole PBMC. All data represented are the means ± SE from four independent experiments.
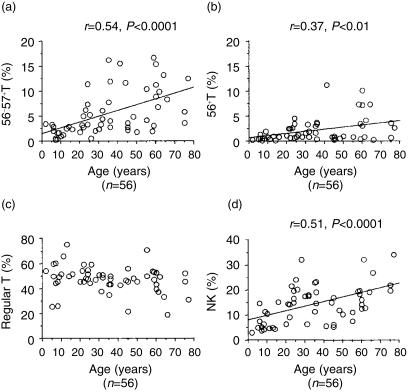
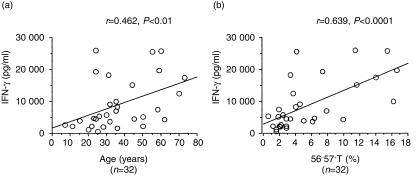
Proportions of CD57+ T cells in PBMC correlate with amounts of IFN-γ produced by CD3-stimulated PBMC
The proportions of CD57+ T cells and NK cells in PBMC constantly increased with age (Fig. 7a,d). The CD56+ T cells also tended to increase with age (Fig. 7b) while the proportions of normal T cells (including both CD4+ and CD8+) did not significantly change (Fig. 7c). CD3-stimulated IFN-γ production from PBMC increased with age (Fig. 8a). Interestingly, the proportion of CD57+ T cells in PBMC also correlated with the IFN-γ production by CD3-stimulated PBMC, regardless of the ages of donors (Fig. 8b).
Figure 7.
The proportions of NK cells and NK-type T cells increase proportionally with age. The data are based on the PBMC obtained from 56 individuals.
Figure 8.
The IFN-γ production capacity of PBMC correlates either with the age or the proportion of CD57+ T cells. The data are based on the findings of several independent experiments from 32 individuals.
TCR β repertoires of CD56+ T cells, CD57+ T cells and normal CD8+ T cells
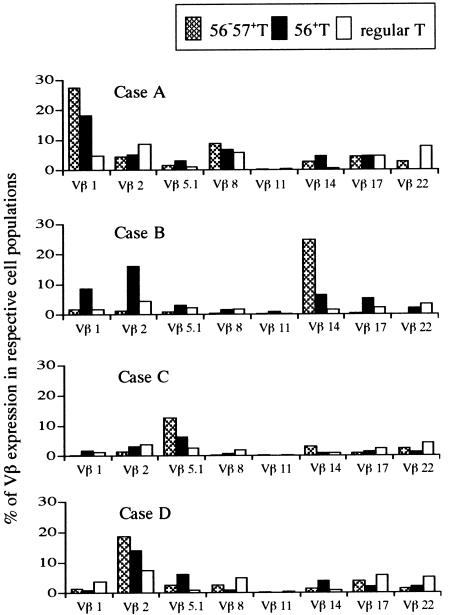
Vβ T-cell repertoire analysis revealed that oligoclonal expansion of a few Vβ T cells in CD57+ T cells as reportedly by Morley et al.25 An oligoclonal expansion of certain Vβ T cells was also observed in CD56+ T cells while their oligoclonality was less dramatic than that in CD57+ T cells (Fig. 9), suggesting that CD57+ T cells and CD56+ T cells were distinct T-cell subsets if they partially overlapped. In contrast, normal CD8+ T cells demonstrated the polyclonality of the TCR β repertoire.
Figure 9.
T-cell receptor β repertoire of CD56+ T cells, CD57+ T cells and normal CD8+ T cells.PBMC from four individual healthy volunteers were stained as described in Materials and Methods. % of Vβ T cells in CD56+ T cells = (% CD56+ Vβ T cells/% CD56+ αβ T cells) × 100; % of Vβ T cells in CD57+ T cells = (% CD56– CD57+ Vβ T cells/% CD56– CD57+ αβ T cells) × 100; % Vβ T cells in CD56– CD57– αβ T cells (normal CD8+ T cells) = (% CD56– CD57– Vβ T cells/% CD56– CD57– αβ T cells) × 100.
Discussion
In the present study, we demonstrated that CD56+ T cells as well as CD57+ T cells were potent IFN-γ producers by either CD3 or cytokine stimulation and thus can be antitumour effectors. CD56+ T cells are a most potent antitumour effector against NK-resistant Raji cells. On the other hand, NK cells produced the largest amount of IFN-γ in response to cytokines and thus were found to be strong antitumour effectors against NK-sensitive K562 cells. Interestingly, the blocking of NKG2A on NK cells significantly augmented the NK cell cytotoxicity against Raji cells. Furthermore, substantial proportions of resting and most of cytokine-stimulated NK cells and NK-type T cells expressed intracellular perforin and granzyme B. CD3-stimulated IFN-γ production from PBMC correlated with the proportions of CD57+ T cells in PBMC of donors regardless of their ages. The increased proportions of CD57+ T cells in PBMC with age and their susceptibility to apoptosis may also explain why the IFN-γ production increased while the proliferation decreased in CD3-stimulated PBMC from aged donors. In contrast to normal CD8+ T cells, the TCR β repertoire of CD57+ T cells and CD56+ T cells showed the oligoclonal expansion of some Vβ T cells while the their TCR β repertoires were not the same and the oligoclonality of the former was more dramatic than that of the latter.
IL-12 is produced by monocyte/macrophages and has various biological effects.26,27 Most notably, it is a potent inducer of the T helper 1 (Th1) immune response by inducing IFN-γ production from NK cells and T cells.28 We recently reported that IL-12 activates either human CD56+ T cells or mouse T cells with an NK cell marker, NK1.1+ T (NKT) cells (also constitutively expressing a natural killer cell marker, IL-2Rβ (CD122)), to acquire an antitumour cytotoxicity.6,29–31 In addition, IL-12 induced IFN-γ production from mouse NKT cells31 and from human CD56+ T cells, as demonstrated in this study. On the other hand, IL-15 is a recently reported cytokine that is also produced by monocyte/macrophages32 and reportedly synergizes with IL-12 and activates NK cells and T cells to produce IFN-γ33 and sustains the survival of activated NK cells.34 These monokines (including IL-18) and IFN-γ produced from NK cells and NKT cells may play an important role in host defence against microbes and tumours.35
Although CD57+ T cells are rare in children and younger adults, the number of CD57+ T cells constantly increases with age, as also demonstrated in this study, and approximately 15% of all lymphocytes are CD57+ T cells in centenarians;13,36 this suggests that these T cells are thymus-independent. CD57+ T cells were potent IFN-γ producers and this was the reason why the PBMC from elderly persons produced a higher amount of IFN-γ after CD3 stimulation than from younger persons. It is known that aged hosts are more susceptible to malignant tumours or bacterial infections. Therefore, although immunological function is impaired in aged hosts, probably as a result of a dysfunction in the normal T cells, the increase in the number of CD57+ T cells bearing a potent IFN-γ producing capacity with ageing may be an appropriate physiological and immunological adaptation to compensate for the immune dysfunction of aged hosts.
Our previous studies demonstrated that human CD56+ T cells and mouse NKT cells are both abundant in the liver (approximately 20% of all liver lymphocytes and 40% of liver T cells).6,29,30,37 Mouse NKT cells mainly use Vα14/Vβ8 gene products for their TCR.37,38 Mouse Vα14+NK1.1+ T cells and human Vα24+ T cells have been reported to have their TCR α gene homology38 and both responded CD1-dependently to α-galactosylceramide and produced IFN-γ and acquired antitumour cytotoxicity.39–42 However, human PBMC and liver mononuclear cells (MNC) have few Vα24+ T cells and most of CD56+ T cells in the liver as well as in PBMC do not express Vα24.21,35,43,44 Consistent with these results, we recently found that, in contrast to mice, neither human liver MNC nor PBMC produced IFN-γ and acquired antitumour cytotoxicity, if any, after the stimulation with α-galactosylceramide.21 Therefore, although human Vα24+ T cells may represent a homologue of mouse NKT cells, the role of human Vα24+ T cells in the host immune response is suggested to be more limited than that of mouse Vα14+ NKT cells. On the other hand, mouse NK1.1 antigen and the human CD161 molecule both belong to the NKRP-1 family and most human CD56+ T cells in the liver and approximately 50% of the peripheral CD56+ T cells expressed CD161.21 Based on their tissue localization, the IL-12-stimulated ability to produce IFN-γ and a MHC-unrestricted antitumour cytotoxicity, we therefore proposed the possibility that human CD56+ T cells and mouse NKT cells are functionally similar populations especially in Th1 immune responses.21,35 However, it should be noted that IFN-γ produced by lipopolysaccharide (LPS)/IL-12-activated NKT cells in mice was responsible for the LPS-induced shock syndrome (generalized Shwartzman reaction) accompanied by multiple organ failure.31 It was also found that either IL-12 or α-galactosylceramide-activated NKT cells caused hepatocyte injury.31,45,46 Therefore, activated T cells with NK cell markers in both mice and humans sometimes may be harmful to the hosts.
In addition, we found that NK cells as well as NK-type T cells contained cytoplasmic perforin and granzyme B, suggesting that the antitumour cytotoxicity of these cells is played, at least in part, by an exocytosis of these molecules. Consistent with this speculation, IL-12 activated mouse NKT cells also killed Fas (−) tumors.31 However, the proportion of perforin containing cells in either resting or cytokine-activated CD56+ T cells tended to be smaller than those in NK cells and CD57+ T cells, raising the possibility that CD56+ T cells may use other killing mechanisms including the Fas–Fas ligand pathway.
Human CD57+ T cells and mouse CD122+ CD8+ T cells are also abundant in the liver and constantly increase with age in the liver and periphery.5,13,37 We recently found that mouse CD122+ CD8+ T cells, which develop extrathymically,35,47,48 also produced a much larger amount of IFN-γ in vitro after the stimulation with anti-CD3 antibody than normal CD122− CD8+ T cells and acquired an antitumour cytotoxicity.49 Their IFN-γ-producing capacity was even greater than that of NKT cells.48 This was also the case for human CD57+ T cells and CD56+ T cells; CD3-stimulated CD57+ T cells produced an even greater amount of IFN-γ than that of CD56+ T cells. We therefore propose that human CD57+ T cells and mouse CD122+ CD8+ T cells may also be functionally similar populations and may play an important role in Th1 responses.
Another notable finding was that both NK-type T cells poorly proliferated in response to CD3 stimulation, and this was partly caused by apoptosis. This finding may explain why the PBMC of aged hosts reportedly proliferate less vigorously by T-cell mitogens than do the PBMC of younger hosts.14 The possibility was also raised that activated NK-type T cells may die after inducing a Th1 immune response in the hosts to avoid any additional harmful effect similarly to α-galactosylceramide-activated NKT cells in mice.45,46
It should also be noted that cytokine-stimulated CD56+ T cells effectively killed NK-resistant Raji cells while NK cells more effectively killed NK-sensitive K562 cells. In this point, NK cells expressed CD94/NKG2A which inhibited cytotoxic activity of NK cells against MHC-class-I bearing tumors,50 whereas CD56+ T cells were CD94/NKG2A negative. Because K562 cells do not express MHC class-I and Raji cells strongly express class I,21,51 K562 cells may be susceptible to NK cell-mediated lysis while Raji cells may be NK resistant. In fact, we also found that the preincubation of cytokine-activated NK cells with NKG2A antibody significantly augmented their cytotoxicity against Raji cells. As a result, NK cells, CD56+ T cells may thus both possess different functional assignments regarding antitumour immunity, and their surface molecules also may affect their function. Although the antitumour cytotoxicity of activated CD57+ T cells was weaker than that of CD56+ cells, their cytotoxicity was stronger than that of normal CD8+ T cells. Therefore, based on the increased number of CD57+ T cells with age and their potent IFN-γ-producing capacity, the role of these cells in the tumour immunity may thus be important.
In conclusion, CD57+ T cells and CD56+ T cells are potent IFN-γ producers and antitumour effectors and the increase in the number of CD57+ T cells with age may thus be closely involved in age-associated immunological changes. In addition to normal T cells and NK cells, these NK-type T cells should be considered in the host defence and Th1 immune responses.
Acknowledgments
This work was supported in part by Kawano Memorial Foundation.
References
- 1.Abo T, Balch CM. A differentiation antigen of human NK and K cells identified by a monoclonal antibody (HNK-1) J Immunol. 1981;127:1024–9. [PubMed] [Google Scholar]
- 2.Lanier LL, Le AM, Civin CI, Loken MR, Phillips JH. The relationship of CD16 (Leu-11) and Leu-19 (NKH-1) antigen expression on human peripheral blood NK cells and cytotoxic T lymphocytes. J Immunol. 1986;136:4480–6. [PubMed] [Google Scholar]
- 3.Lanier LL, Testi R, Bindl J, Phillips JH. Identity of Leu-19 (CD56) leukocyte differentiation antigen and neural cell adhesion molecule. J Exp Med. 1989;169:2233–8. doi: 10.1084/jem.169.6.2233. [DOI] [PMC free article] [PubMed] [Google Scholar]
- 4.Kruse J, Mailhammer R, Wernecke H, Faissner A, Sommer I, Goridis C, Schachner M. Neural cell adhesion molecules and myelin-associated glycoprotein share a common carbohydrate moiety recognized by monoclonal antibodies L2 and HNK-1. Nature. 1984;311:153–5. doi: 10.1038/311153a0. [DOI] [PubMed] [Google Scholar]
- 5.Abo T, Watanabe H, Iiai T, et al. Extrathymic pathways of T-cell differentiation in the liver and other organs. Int Rev Immunol. 1994;11:61–102. doi: 10.3109/08830189409061717. [DOI] [PubMed] [Google Scholar]
- 6.Satoh M, Seki S, Hashimoto W, Ogasawara K, Kobayashi T, Kumagai K, Matsuno S, Takeda K. Cytotoxic gammadelta or alphabeta T cells with a natural killer cell marker, CD56, induced from human peripheral blood lymphocytes by a combination of IL-12 and IL-2. J Immunol. 1996;157:3886–92. [PubMed] [Google Scholar]
- 7.Leroy E, Calvo CF, Divine M, et al. Persistence of T8+/HNK-1+ suppressor lymphocytes in the blood of long- term surviving patients after allogeneic bone marrow transplantation. J Immunol. 1986;137:2180–9. [PubMed] [Google Scholar]
- 8.Fregona I, Guttmann RD, Jean R. HNK-1+ (Leu-7) and other lymphocyte subsets in long-term survivors with renal allotransplants. Transplantation. 1985;39:25–9. [PubMed] [Google Scholar]
- 9.Dupuy d'Angeac A, Monier S, Jorgensen C, et al. Increased percentage of CD3+, CD57+ lymphocytes in patients with rheumatoid arthritis. Correlation with duration of disease. Arthritis Rheum. 1993;36:608–12. doi: 10.1002/art.1780360506. [DOI] [PubMed] [Google Scholar]
- 10.Arai K, Yamamura S, Seki S, Hanyu T, Takahashi HE, Abo T. Increase of CD57+ T cells in knee joints and adjacent bone marrow of rheumatoid arthritis (RA) patients: implication for an anti-inflammatory role. Clin Exp Immunol. 1998;111:345–52. doi: 10.1046/j.1365-2249.1998.00511.x. 10.1046/j.1365-2249.1998.00511.x. [DOI] [PMC free article] [PubMed] [Google Scholar]
- 11.Sadat-Sowti B, Debre P, Mollet L, Quint L, Hadida F, Leblond V, Bismuth G, Autran B. An inhibitor of cytotoxic functions produced by CD8+ CD57+ T lymphocytes from patients suffering from AIDS and immunosuppressed bone marrow recipients. Eur J Immunol. 1994;24:2882–8. doi: 10.1002/eji.1830241145. [DOI] [PubMed] [Google Scholar]
- 12.Van den Hove LE, Van Gool SW, Vandenberghe P, Boogaerts MA, Ceuppens JL. CD57+/CD28− T cells in untreated hemato-oncological patients are expanded and display a Th1-type cytokine secretion profile, ex vivo cytolytic activity and enhanced tendency to apoptosis. Leukemia. 1998;12:1573–82. doi: 10.1038/sj.leu.2401146. [DOI] [PubMed] [Google Scholar]
- 13.Miyaji C, Watanabe H, Minagawa M, et al. Numerical and functional characteristics of lymphocyte subsets in centenarians. J Clin Immunol. 1997;17:420–9. doi: 10.1023/a:1027324626199. [DOI] [PubMed] [Google Scholar]
- 14.Grossmann A, Ledbetter JA, Rabinovitch PS. Reduced proliferation in T lymphocytes in aged humans is predominantly in the CD8+ subset, and is unrelated to defects in transmembrane signaling which are predominantly in the CD4+ subset. Exp Cell Res. 1989;180:367–82. doi: 10.1016/0014-4827(89)90064-5. [DOI] [PubMed] [Google Scholar]
- 15.Ernst DN, Weigle WO, Noonan DJ, McQuitty DN, Hobbs MV. The age-associated increase in IFN-gamma synthesis by mouse CD8+ T cells correlates with shifts in the frequencies of cell subsets defined by membrane CD44, CD45RB, 3G11, and MEL-14 expression. J Immunol. 1993;151:575–87. [PubMed] [Google Scholar]
- 16.Proust JJ, Filburn CR, Harrison SA, Buchholz MA, Nordin AA. Age-related defect in signal transduction during lectin activation of murine T lymphocytes. J Immunol. 1987;139:1472–8. [PubMed] [Google Scholar]
- 17.Philosophe B, Miller RA. Diminished calcium signal generation in subsets of T lymphocytes that predominate in old mice. J Gerontol. 1990;45:B87–93. doi: 10.1093/geronj/45.3.b87. [DOI] [PubMed] [Google Scholar]
- 18.Saxena RK, Saxena QB, Adler WH. Lectin-induced cytotoxic activity in spleen cells from young and old mice. Age-related changes in types of effector cells, lymphokine production and response. Immunology. 1988;64:457–61. [PMC free article] [PubMed] [Google Scholar]
- 19.van Engeland M, Ramaekers FC, Schutte B, Reutelingsperger CP. A novel assay to measure loss of plasma membrane asymmetry during apoptosis of adherent cells in culture. Cytometry. 1996;24:131–9. doi: 10.1002/(SICI)1097-0320(19960601)24:2<131::AID-CYTO5>3.0.CO;2-M. 10.1002/(sici)1097-0320(19960601)24:2<131::aid-cyto5>3.0.co;2-m. [DOI] [PubMed] [Google Scholar]
- 20.Pittet MJ, Speiser DE, Valmori D, Cerottini JC, Romero P. Cutting edge: cytolytic effector function in human circulating CD8+ T cells closely correlates with CD56 surface expression. J Immunol. 2000;164:1148–52. doi: 10.4049/jimmunol.164.3.1148. [DOI] [PubMed] [Google Scholar]
- 21.Kawarabayashi N, Seki S, Hatsuse K, et al. Decrease of CD56 (+) T cells and natural killer cells in cirrhotic livers with hepatitis C may be involved in their susceptibility to hepatocellular carcinoma. Hepatology. 2000;32:962–9. doi: 10.1053/jhep.2000.19362. [DOI] [PMC free article] [PubMed] [Google Scholar]
- 22.Duke RC, Persechini PM, Chang S, Liu CC, Cohen JJ, Young JD. Purified perforin induces target cell lysis but not DNA fragmentation. J Exp Med. 1989;170:1451–6. doi: 10.1084/jem.170.4.1451. [DOI] [PMC free article] [PubMed] [Google Scholar]
- 23.Liu CC, Walsh CM, Young JD. Perforin: structure and function. Immunol Today. 1995;16:194–201. doi: 10.1016/0167-5699(95)80121-9. [DOI] [PubMed] [Google Scholar]
- 24.Smyth MJ, Trapani JA. Granzymes: exogenous proteinases that induce target cell apoptosis. Immunol Today. 1995;16:202–6. doi: 10.1016/0167-5699(95)80122-7. [DOI] [PubMed] [Google Scholar]
- 25.Morley JK, Batliwalla FM, Hingorani R, Gregersen PK. Oligoclonal CD8+ T cells are preferentially expanded in the CD57+ subset. J Immunol. 1995;154:6182–90. [PubMed] [Google Scholar]
- 26.Kobayashi M, Fitz L, Ryan M, et al. Identification and purification of natural killer cell stimulatory factor (NKSF), a cytokine with multiple biologic effects on human lymphocytes. J Exp Med. 1989;170:827–45. doi: 10.1084/jem.170.3.827. [DOI] [PMC free article] [PubMed] [Google Scholar]
- 27.Stern AS, Podlaski FJ, Hulmes JD, et al. Purification to homogeneity and partial characterization of cytotoxic lymphocyte maturation factor from human B-lymphoblastoid cells. Proc Natl Acad Sci USA. 1990;87:6808–12. doi: 10.1073/pnas.87.17.6808. [DOI] [PMC free article] [PubMed] [Google Scholar]
- 28.Trinchieri G. Interleukin-12: a proinflammatory cytokine with immunoregulatory functions that bridge innate resistance and antigen-specific adaptive immunity. Annu Rev Immunol. 1995;13:251–76. doi: 10.1146/annurev.iy.13.040195.001343. [DOI] [PubMed] [Google Scholar]
- 29.Hashimoto W, Takeda K, Anzai R, Ogasawara K, Sakihara H, Sugiura K, Seki S, Kumagai K. Cytotoxic NK1.1 Ag+ alpha beta T cells with intermediate TCR induced in the liver of mice by IL-12. J Immunol. 1995;154:4333–40. [PubMed] [Google Scholar]
- 30.Takeda K, Seki S, Ogasawara K, et al. Liver NK1.1+ CD4+ alpha beta T cells activated by IL-12 as a major effector in inhibition of experimental tumor metastasis. J Immunol. 1996;156:3366–73. [PubMed] [Google Scholar]
- 31.Ogasawara K, Takeda K, Hashimoto W, et al. Involvement of NK1+ T cells and their IFN-gamma production in the generalized Shwartzman reaction. J Immunol. 1998;160:3522–7. [PubMed] [Google Scholar]
- 32.Grabstein KH, Eisenman J, Shanebeck K, et al. Cloning of a T cell growth factor that interacts with the beta chain of the interleukin-2 receptor. Science. 1994;264:965–8. doi: 10.1126/science.8178155. [DOI] [PubMed] [Google Scholar]
- 33.Avice MN, Demeure CE, Delespesse G, Rubio M, Armant M, Sarfati M. IL-15 promotes IL-12 production by human monocytes via T cell-dependent contact and may contribute to IL-12-mediated IFN-gamma secretion by CD4+ T cells in the absence of TCR ligation. J Immunol. 1998;161:3408–15. [PubMed] [Google Scholar]
- 34.Carson WE, Fehniger TA, Haldar S, et al. A potential role for interleukin-15 in the regulation of human natural killer cell survival. J Clin Invest. 1997;99:937–43. doi: 10.1172/JCI119258. [DOI] [PMC free article] [PubMed] [Google Scholar]
- 35.Seki S, Habu Y, Kawamura T, Takeda K, Dobashi H, Ohkawa T, Hiraide H. The liver as a crucial organ in the first line of host defense: the roles of Kupffer cells, natural killer (NK) cells and NK1.1 Ag+ T cells in T helper 1 immune responses. Immunol Rev. 2000;174:35–46. doi: 10.1034/j.1600-0528.2002.017404.x. [DOI] [PubMed] [Google Scholar]
- 36.Abo T, Kawamura T, Watanabe H. Physiological responses of extrathymic T cells in the liver. Immunol Rev. 2000;174:135–49. doi: 10.1034/j.1600-0528.2002.017415.x. [DOI] [PubMed] [Google Scholar]
- 37.Tsukahara A, Seki S, Iiai T, et al. Mouse liver T cells: their change with aging and in comparison with peripheral T cells. Hepatology. 1997;26:301–9. doi: 10.1002/hep.510260208. [DOI] [PubMed] [Google Scholar]
- 38.Lantz O, Bendelac A. An invariant T cell receptor alpha chain is used by a unique subset of major histocompatibility complex class I-specific CD4+ and CD4–8− T cells in mice and humans. J Exp Med. 1994;180:1097–106. doi: 10.1084/jem.180.3.1097. [DOI] [PMC free article] [PubMed] [Google Scholar]
- 39.Kawano T, Cui J, Koezuka Y, et al. CD1d-restricted and TCR-mediated activation of valpha14 NKT cells by glycosylceramides. Science. 1997;278:1626–9. doi: 10.1126/science.278.5343.1626. 10.1126/science.278.5343.1626. [DOI] [PubMed] [Google Scholar]
- 40.Cui J, Shin T, Kawano T, et al. Requirement for Valpha14 NKT cells in IL-12-mediated rejection of tumors. Science. 1997;278:1623–6. doi: 10.1126/science.278.5343.1623. 10.1126/science.278.5343.1623. [DOI] [PubMed] [Google Scholar]
- 41.Brossay L, Chioda M, Burdin N, Koezuka Y, Casorati G, Dellabona P, Kronenberg M. CD1d-mediated recognition of an alpha-galactosylceramide by natural killer T cells is highly conserved through mammalian evolution. J Exp Med. 1998;188:1521–8. doi: 10.1084/jem.188.8.1521. [DOI] [PMC free article] [PubMed] [Google Scholar]
- 42.Spada FM, Koezuka Y, Porcelli SA. CD1d-restricted recognition of synthetic glycolipid antigens by human natural killer T cells. J Exp Med. 1998;188:1529–34. doi: 10.1084/jem.188.8.1529. [DOI] [PMC free article] [PubMed] [Google Scholar]
- 43.Ishihara S, Nieda M, Kitayama J, et al. CD8 (+) NKR-P1A (+) T cells preferentially accumulate in human liver. Eur J Immunol. 1999;29:2406–13. doi: 10.1002/(SICI)1521-4141(199908)29:08<2406::AID-IMMU2406>3.0.CO;2-F. 10.1002/(sici)1521-4141(199908)29:08<2406::aid-immu2406>3.0.co;2-f. [DOI] [PubMed] [Google Scholar]
- 44.Doherty DG, O'Farrelly C. Innate and adaptive lymphoid cells in the human liver. Immunol Rev. 2000;174:5–20. doi: 10.1034/j.1600-0528.2002.017416.x. [DOI] [PubMed] [Google Scholar]
- 45.Osman Y, Kawamura T, Naito T, Takeda K, Van Kaer L, Okumura K, Abo T. Activation of hepatic NKT cells and subsequent liver injury following administration of alpha-galactosylceramide. Eur J Immunol. 2000;30:1919–28. doi: 10.1002/1521-4141(200007)30:7<1919::AID-IMMU1919>3.0.CO;2-3. 10.1002/1521-4141(200007)30:7<1919::aid-immu1919>3.0.co;2-3. [DOI] [PubMed] [Google Scholar]
- 46.Nakagawa R, Nagafune I, Tasunoki Y, et al. Mechanisms of the antimetastatic effect in the liver and of the hepatocyte injury induced by α-galactosyl ceramide in mice. J Immunol. 2001;166:6578–84. doi: 10.4049/jimmunol.166.11.6578. [DOI] [PubMed] [Google Scholar]
- 47.Sato K, Ohtsuka K, Hasegawa K, Yamagiwa S, Watanabe H, Asakura H, Abo T. Evidence for extrathymic generation of intermediate T cell receptor cells in the liver revealed in thymectomized, irradiated mice subjected to bone marrow transplantation. J Exp Med. 1995;182:759–67. doi: 10.1084/jem.182.3.759. [DOI] [PMC free article] [PubMed] [Google Scholar]
- 48.Watanabe H, Miyaji C, Seki S, Abo T. c-kit+ stem cells and thymocyte precursors in the livers of adult mice. J Exp Med. 1996;184:687–93. doi: 10.1084/jem.184.2.687. [DOI] [PMC free article] [PubMed] [Google Scholar]
- 49.Takayama E, Seki S, Ohkawa T, Ami K, Habu Y, Yamaguchi T, Tadakuma T, Hiraide H. Mouse CD8+ CD122+ T cells with intermediate TCR increasing with age provide a source of early IFN-gamma production. J Immunol. 2000;164:5652–8. doi: 10.4049/jimmunol.164.11.5652. [DOI] [PubMed] [Google Scholar]
- 50.Perez-Villar JJ, Melero I, Navarro F, et al. The CD94/NKG2-A inhibitory receptor complex is involved in natural killer cell-mediated recognition of cells expressing HLA-G1. J Immunol. 1997;158:5736–43. [PubMed] [Google Scholar]
- 51.Sugawara S, Abo T, Itoh H, Kumagai K. Analysis of mechanisms by which NK cells acquire increased cytotoxicity against class I MHC-eliminated targets. Cell Immunol. 1989;119:304–16. doi: 10.1016/0008-8749(89)90246-3. [DOI] [PubMed] [Google Scholar]


