Abstract
OBJECTIVES: To study the discrepancy between actual and recommended rates of use among several measures of screening for complications of diabetes in a national longitudinal sample, the correlations among measures of adherence, and whether or not higher rates of adherence reduce hospitalizations for complications of diabetes. The key study hypothesis was that lack of adherence to professional recommendations for diabetes care leads to adverse health outcomes for elderly persons. METHODS: Administrative claims and survey data for 1994-1999 on a nationally representative sample of Medicare beneficiaries age 65+. Principal components analysis and instrumental variables probit regression methods were used. RESULTS: Most Medicare beneficiaries diagnosed with type 2 diabetes had at least one physician visit per year, but rates of screening (eye examinations and HbA1c, lipid, microalbumin and urine tests) fell far short of recommendations. Correlations among use rates for various types of screening were positive but far less than one, suggesting that failure to screen reflects a complex set of underlying factors. Increased rates of adherence were observed for HbA1c and lipid testing over the observation period. Higher use was associated with lower rates of hospitalization for complications of diabetes (vascular (p=0.007), renal (p=0.002), and other complication (p=0.005)). CONCLUSIONS: Adherence to guidelines was associated with significantly reduced rates of hospitalization. Continued analysis of the trends in clinical practice is needed to demonstrate the effectiveness of standardized guidelines for the care of patients with diabetes.
Keywords: adherence, compliance, guidelines, diabetes mellitus, hospitalizations, complications
Introduction
Diabetes mellitus is a major cause of mortality and morbidity among persons over age 65 in the United States [1, 2]. Given the benefits of control [3] and of therapeutic interventions to mitigate complications from the disease [4-6], various guidelines specify minimum rates of screening [7-9], and the Health Employer Data and Information Set (HEDIS) [10] uses conformance with certain recommendations for diabetes as a measure of quality of care. However, actual screening rates fall far short of recommended levels [11-16]. The discrepancy plausibly reflects a combination of patient, physician, and system factors [17-19]. While such studies have been a cause for concern and have provided the basis for suggestions for methods to improve care, less well understood is the longitudinal pattern of care over many years. Because diabetes mellitus is a chronic disease, it is by understanding the patterns of longitudinal care, and then the impact of such care, that we can assess the value and import of regular care and how current care patterns either meet or fall short of appropriate levels.
This study used national administrative data from the Medicare program to address three issues. First, what is the discrepancy between actual and recommended rates of use among several measures of screening for complications of diabetes in a national longitudinal sample? Second, how correlated are the measures? Third, do higher rates of adherence to guidelines reduce hospitalizations for complications of diabetes? The key study hypothesis is that lack of adherence to professional recommendations for diabetes care leads to adverse health outcomes for elderly persons.
Methods
The study population consisted of individuals 65 years and over at the time of entry into the study in the U.S. and who were enrolled in the National LongTerm Care Survey (NLTCS). The NLTCS is a random sample of U.S. adults 65 years and older conducted by the U.S. Census Bureau and the Duke University Center for Demographic Studies. Because the NLTCS was originally designed to study disability among elderly individuals, the sample included persons living in the community and in nursing homes.
The NLTCS data files included individuals randomly selected from Medicare enrollment records who were 65 years or older at their firsst NLTCS interview. More than 25,000 persons were surveyed in 1982 and 1984; the first survey years with followup interviews were conducted in 1989, 1994, and 1999. To maintain a consistent sample size of more than 20,000 subjects at each interview, new sample members were added at the 1989, 1994, and 1999 interviews. An oversample of 500-600 persons aged 95+ was added in 1994 and 1999.
We used the NLTCS to select the sample for our study and for identifying beneficiary links to Medicare administrative claims files. We limited our analysis of adherence to 1984-1999 for two reasons. Clinical recommendations on five tests and services were consis-tent during this period and 1991 was the first year that Medicare Part B (mainly physician) claims contained information on diagnoses. We used claims data from 1985 through 1993 to identify persons with a diagnosis of diabetes mellitus. Following a procedure used by others [20], a person was included in our analysis sample if diabetes was reported as a diagnosis on a single institutional claim (inpatient, skilled nursing facility, home health care, hospice, and outpatient) or at least two non-institutional claims (carrier/physician supplier/Part B, durable medical equipment, clinical labs).
We obtained the analysis samples through a series of steps. First, we restricted the analysis to individuals with type 2 diabetes and age 65+ at the start of 1994. This yielded a sample of 3,964. Next, measuring adherence to clinical recommendations for care required that we observe all individuals for a common length of time. In total, 1,469 of these persons died during 1994-1998, leaving 2,495 persons who survived. After eliminating individuals with invalid or missing data for key variables, we were left with 2,341 observations for the analysis of hospitalizations for diabetes complications.
The dependent variables were hospitalizations for the following complications of diabetes at least once during 1994-1998 - peripheral vascular, neurological, renal, cardiovascular, and other complications of diabetes (Table 1). Hospitalizations for endocrine complications were not assessed since only eight sample persons had such hospitalizations during 1994-1998.
Table 1. Codes for Diagnosis and Procedures.
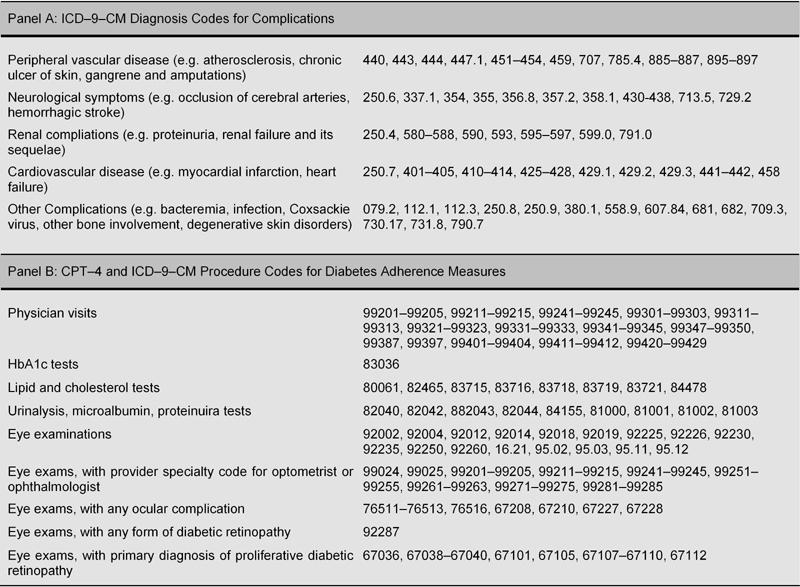
The key explanatory variable in our analysis of the probability of hospitalization with each of the complications during 1994-1998 was an index of patient adherence to clinical recommendations. As a first step to constructing this index, we defined binary variables for whether or not during the year the person had had a physician visit, an HbA1c test, a dilated eye exam, a lipid test, and a urinalysis, which included microalbumin and proteinuria tests. All five measures were observable in the claims, and there were no major changes in coding practices during 1994-1998 for any of the five measures. Influenza vaccinations were observable in the claims data, but were excluded since the clinical practice recommendation changed during the period.
To develop an index of annual utilization of such visits and tests, we performed principal components analysis, selecting scores from the first principal component as the index. The main use of principal components and the related statistical technique of factor analysis is to reduce a large set of correlated variables into a smaller number of uncorrelated variables [21]. Both techniques have been applied to a wide range of fields, including medicine and the physical and social sciences [22]. With statistical software [23], one can easily compute linear transformations of a large set of variables to obtain a smaller set, or principal components, that retain most of the relationships and information in the original data. In this case, we began with five measures of adherence with clinical guidelines and retained a single variable, the first principal component. Analysis results using principal components and factor analysis were quite similar, so only the results for principal components are reported in this paper.
All dependent variables were binary (equal to one when a complication leading to a hospitalization was observed and zero otherwise); thus we used a form of probit analysis. Since the coefficients from probit regression do not reveal the effect of a change in the explanatory variable on the dependent variable, we computed marginal probabilities using Stata 8.0 [23], which gives a numerical derivative evaluated at the observational means.
The goal of our analysis was to assess the impact of adherence as measured by the index on hospitalizations for complications of diabetes. However, visits and testing may reflect severity of illness not recorded in administrative records and not accounted for by the other independent variables. To deal with potential endogeneity of the index (the possibility that the onset of complications influenced utilization of recommended care), we used an instrumental variables approach, Amemiya's generalized least squares (AGLS) [24], a form of probit analysis. This method requires that two conditions be satisfied. First, some variables must not have a direct effect on outcomes but affect utilization. (These variables only affect outcomes through their influence on utilization.) Second, the variables must be correlated with utilization [25]. Predictors of utilization that were omitted from the outcomes analysis were measures of the number of internal medicine and general practice physicians, ophthalmologists, and optometrists per 10,000 population in the person's Primary Sampling Unit (a standard metropolitan statistical area (SMSA) for residents of SMSAs and a county or small group of counties for others), whether or not the person was enrolled in Medicaid, and whether or not the person had a private supplemental health insurance policy to Medicare.
We used two specification tests to check for the appropriateness and strength of the instrumental variables. To test the null hypothesis that the dependent variable is exogenous in which case the instrumental variable approach would be unnecessary, we used a test of exogeneity developed by Smith and Blundell [26]. We computed an F-test of the joint significance of the instruments in the firststage regression to test that the instrumental variables were sufficiently correlated with the endogenous explanatory variable, the principal component of adherence. The results are shown in the appendix (Tables A1 and A2).
Other explanatory variables in the analysis of hospitalizations were: the person's age in 1994; a binary variable for gender; whether the person had been diagnosed with dementia by the beginning of 1994; the person's DxCG score [27, 28], a measure of severity of illness based on diagnosis and procedure codes and demographic characteristics; the number of months the person was enrolled in a Medicare health maintenance organization (HMO) during 1994-1998; a prior history of the complication as of the beginning of 1994 (for the analysis of hospitalizations for complications); and several variables measuring the duration of diabetes. For persons for whom we likely observed the first diagnosis of diabetes, we included the number of years between 1994 and this first diagnosis (during 1984-1993). We included a separate explanatory variable for the number of years between diagnosis and 1994 for individuals for whom the first diagnosis of diabetes was censored. Our definition of censoring was observing a diabetes diagnosis in the first year of an individual's claims (beginning at age 65 or older) or a diabetes diagnosis in 1991 for individuals for whom we observed in claims prior to 1991. Therefore, our definition of "not censored" is individuals for whom we observed one or more years of claims without a diabetes diagnosis and who had a first diagnosis in 1984-1990 or 1992-1993. Physician (Part B) claims prior to 1991 lacked diagnosis codes, thus persons for whom we first observed a diagnosis of diabetes mellitus were probably diagnosed earlier. We also included dummy variables for whether the censoring occurred in the 1984-1990 period or the 1991-1993 period to account for differences in the diagnosis codes on the two types of claims.
Results
On average, persons diagnosed with diabetes had 7.8 visits (median value 6.8); nearly all sample persons (89%) had at least one physician visit per year (Table 2). Annual utilization rates for the screening tests were much lower, ranging from 1.2 tests per year for urinanalysis tests to 0.37 annually for lipid tests. Slightly more than half of the persons had eye exams per year (53%). However, less than a quarter of persons had lipid tests (22%). Rates of use of HbA1c tests and urinalysis were in between. Annual rates of HbA1c and lipid testing increased between 1994 and 1998, but even in 1998, only 40% of persons had an HbA1c test and only 33% had a lipid test in that year.
Table 2. Diabetes Adherence Measures.
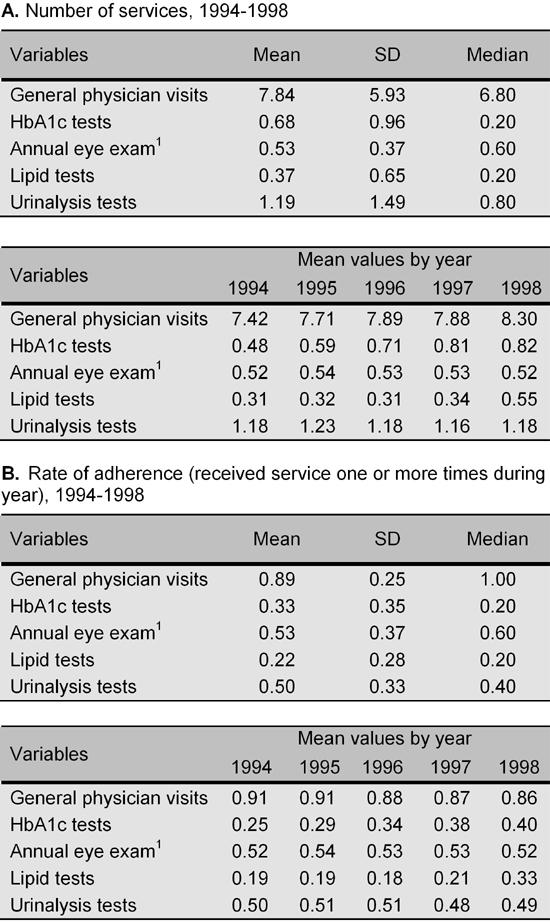
1 Annual eye exam is binary for one or more exams in both A and B.
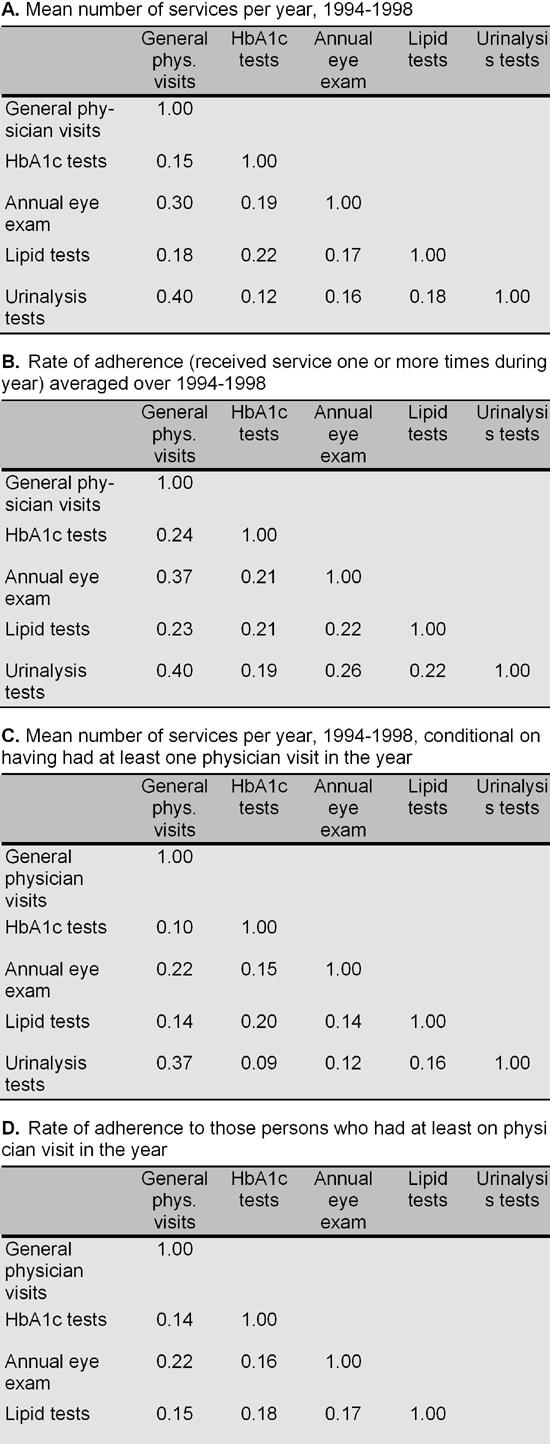
Although the individuals visited physicians more than once every other month on average, mean numbers of tests were only weakly correlated with the mean numbers of visits (Table 3, Panel A). Correlations with the number of visits ranged from 0.40 for urinalysis to 0.15 for HbA1c tests, indicating that greater contact with a physician was only weakly associated with higher frequency of testing. Likewise the probability of receipt of tests was only weakly related to the probability of having at least one visit (Table 3, Panel B). In general, correlations among the five measures, although positive, were not higher than 0.26. Limiting the sample to persons who had at least one visit during the year did not alter the patterns observed for the entire sample (Panels C and D).
Table 3. Correlations among Diabetes Adherence Measures.
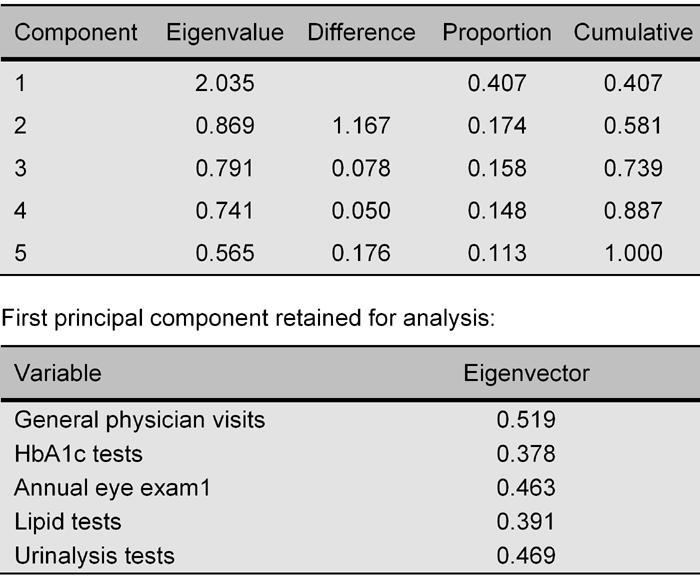
The first principal component accounted for 41% of the variance in the five utilization measures (Table 4). The values from the eigenvector indicated a high and positive association with each of the five measures. Each of the other four principal components was related to one or more of the other utilization measures (not shown) and individually, they explained much less of the variance in utilization than did the first principal component.
Table 4. Principal Components Analysis of Diabetes Adherence Measures.
We ranked the observations in order of their score on the first principal component and divided the sample into quartiles (Table 5). In the lowest quartile of scores, 61% of persons had at least one visit during the year. Annual rates of testing were all under 20%. Rates of use increased monotonically from the lowest to the highest quartile. In Quartile II, 96% of persons had visited a physician during the year on average, but rates of adherence with the recommendations for testing remained quite low. In Quartile IV, almost 100% of patients had an annual physician visit, but rates of testing remained far below the recommended levels. Rates of testing ranged from 47% for lipid tests to 83% for annual eye exams.
Table 5. Mean Values of Services by Quartile of Distribution of Principal Component Scores1.
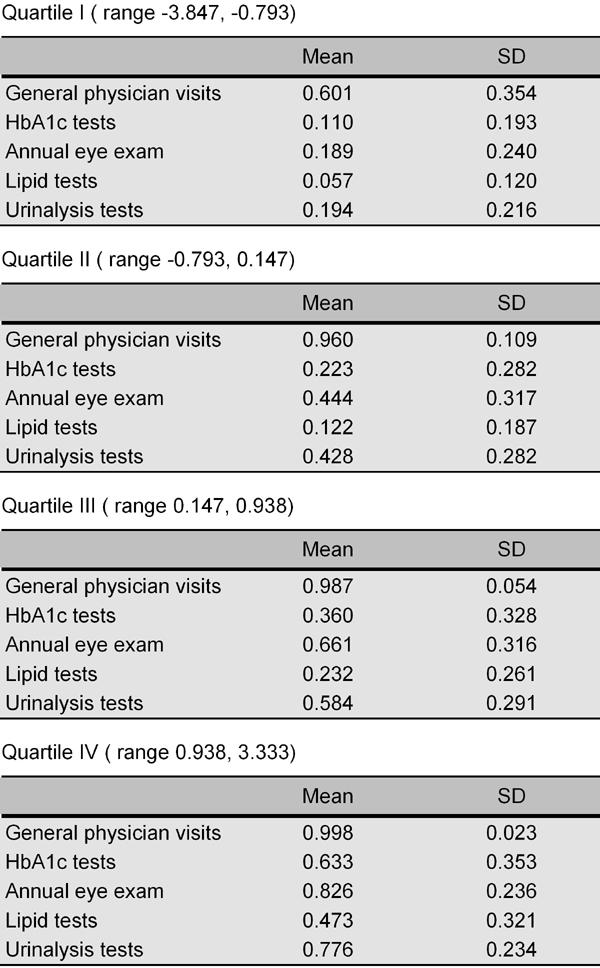
1 Mean is the proportion of years (1994-1998) with one or more service.
Rates of hospitalization during 1994-1998 for complications of diabetes ranged from 5.1% for noncardiac vascular complications to 26.2% for cardiovascular complications (Table 6). These rates are for persons who survived through 1998. For persons who died between 1994 and 1998, hospitalization rates were appreciably higher, especially for renal (11.1% among decedents) and cardiovascular complications (36.0% among decedents, not shown in table).
Table 6. Mean Values of Services1.
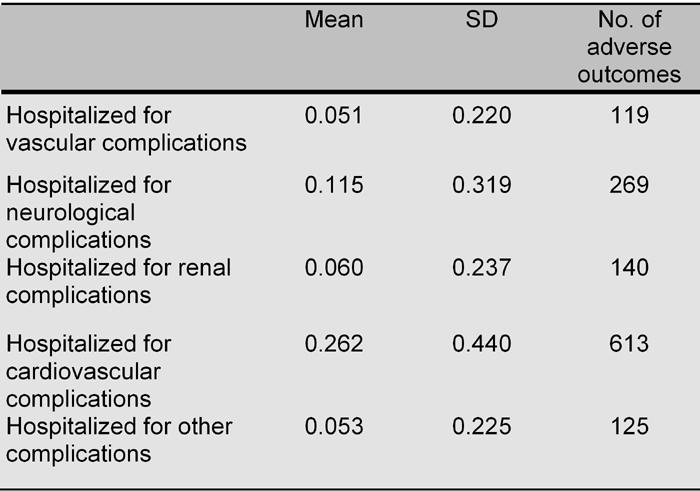
1 Sample size: N = 2341.
Adherence to guidelines was associated with lower rates of hospitalization for vascular (p=0.007), renal (p=0.002), and other complications of diabetes (p=0.005) (Table 7) with hospitalization for cardiovascular complications being almost statistically significant at conventional levels (p=0.051). Such hospitalizations were positively related to the number of years since diabetes had been diagnosed, whether the person had been hospitalized for the same complication before 1994 (1991-1993), and with comorbidities as measured by the DxCG score. These hospitalizations were negatively related to having a diagnosis of dementia (for some types of complications) and to the number of months the person had been enrolled in a Medicare HMO during 1994-1998. During the months the person was in an HMO, no utilization information was included in our data.
Table 7. Hospitalizations for Diabetes Complications, 1994-1998.
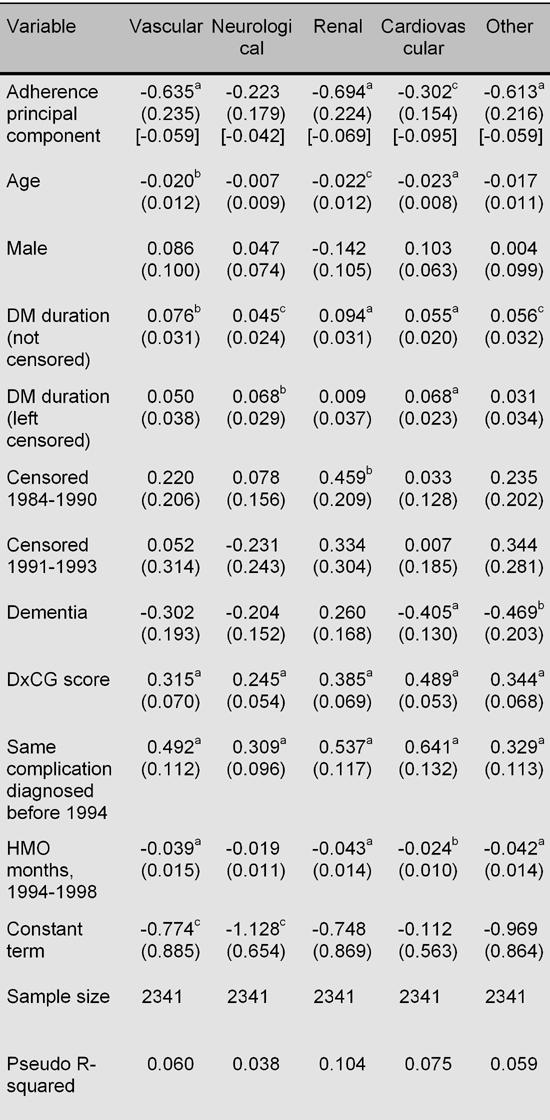
Standard errors in parentheses. Marginal effects (effects of a one unit change in the first principal component on the probability of
hospitalization for a complication) evaluated at sample means in brackets. a p < 0.01; b p < 0.05; c p < 0.10 (2 tailed test).
An increase in the adherence index from -0.5 to 0.5 (approximately a change from Quartile II to Quartile III) was associated with a reduction of 5.9% in the probability of being hospitalized for a vascular complication during 1994-1998. For hospitalizations for a renal complication, the reduction was 6.9% and cardiovascular and other, 9.5% and 5.9%, respectively.
Conclusion
The vast majority of Medicare beneficiaries diagnosed with type 2 diabetes had at least one visit per year to a physician. However, rates of screening fell far short of recommendations. With the possible exception of eye examinations, screenings tend to be done at the physician's initiative. It is possible that the low screening rates demonstrated in this study represent physician responsiveness to immediate concerns that led to the visit rather than to health maintenance. The correlations among use rates for the various types of screening were positive but far less than one, suggesting that failure to screen reflects a complex set of underlying factors. The use rates were sufficiently correlated to yield a principal component that we interpreted as a general index of screening rates. Higher use, as indicated by higher values of the principal component score, was associated with lower rates of hospitalization for complications of diabetes during this period.
Complications are prevalent in persons diagnosed with diabetes [29]. Both the Diabetes Control and Complications Trial (DCCT) in patients with type 1 diabetes [30] and the United Kingdom Prospective Diabetes Study (UKPDS) [31, 32] in patients with type 2 diabetes have demonstrated reductions in both the incidence and progression of microvascular complications with improved blood glucose control. In our study, although we lacked a patientspecific measure of glycemic control, we considered that increased monitoring may lead to effective therapeutic interventions, including improved lipid management, medications to prevent nephropathy, and retinal therapy. Further, accounting for the possibility that use may reflect unmeasured severity of illness, our analysis related several measures of screening to health outcomes.
Discussion
Despite clear evidence that improved metabolic control has a positive impact on morbidity and mortality related to diabetes, adherence to recommended screening guidelines remains poor [7]. During the time period of this study (1994-1998), standards of medical care became more intensive. This may account for the increased rates of adherence seen for HbA1c and lipid testing, which have been particularly emphasized in recent years. However, adherence rates of 0.4 for HbA1c and 0.33 for lipid testing are still substandard. Of even greater concern are the low rates of adherence for screening measures less well emphasized to general physicians, such as urine testing and ophthalmologic exam. Additionally, the adherence rates seen for urine testing in this study are likely an overestimate since this variable includes codes for nine tests, whereas spot urine microalbumin testing is the recommended screening exam.
We acknowledge several limitations. First, we used administrative and survey data. Although such data offer several advantages, including being nationally representative of the U.S. population over age 65 and ability to track outcomes over time, detailed information on individual patients' clinical status is lacking. Some of the observed differences between recommended and actual care might have been explained with clinical information not available in administrative data sets [33]. We relied on diagnostic and procedure coding as supplied in bills from physicians and hospitals to Medicare for clinical information. Second, we could not follow all types of screening specified in the guidelines, such as for foot care and neurosensory examination of the extremities. Such services were not billed separately from the physician visit; therefore we did not include these measures. We could not ascertain whether specific recommendations in the guidelines that reflect the specific clinical condition of the patient were followed. Third, we only followed persons diagnosed with type 2 diabetes for five years. The latency period for some complications of diabetes is considerably longer than this [34, 35]. Our adherence measure also required that we select individuals who survived for at least five years, so we did not capture the increased mortality associated with diabetes. Fourth, we lacked statistical power to follow some complications. Fifth, although we controlled for endogeneity of screening rates, our method relied on certain statistical assumptions which the method requires.
During the time of this study, a clear trend of improved adherence with screening recommendations appears to have occurred with respect to HbA1c and lipid testing. Likewise, the data indicate that adherence to these guidelines was associated with reduced rates of hospitalization. This is in agreement with other data that indicate that increased vigilance for complications of diabetes reduces the morbidity associated with the disease. Although the methodology employed in this study allowed a comprehensive assessment of use of health maintenance parameters, these data did not extend beyond 2000. Continued analysis of the trends in clinical practice is necessary to demonstrate the effectiveness of standardized guidelines for the care of patients with diabetes.
Acknowledgments
This research was supported in part by a grant from the National Institute on Aging, "Visual Impairment, Treatment, and Effects on the Elderly"; #1RO1AG1747.
Appendix
Table A1. Specification and Robustness Tests.
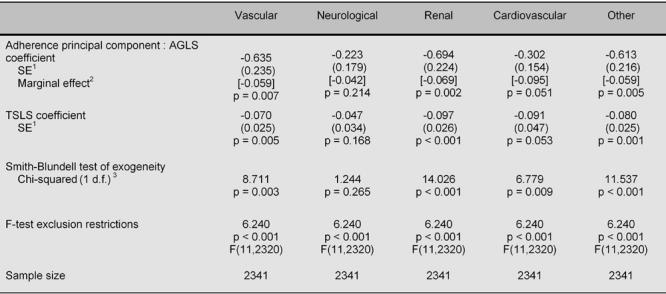
1 SE = Standard error of estimate. 2 See explanation in footnote to Table 7. 3 d.f. = degrees of freedom.
Table A2. First-Stage Regressions from TSLS Analysis.
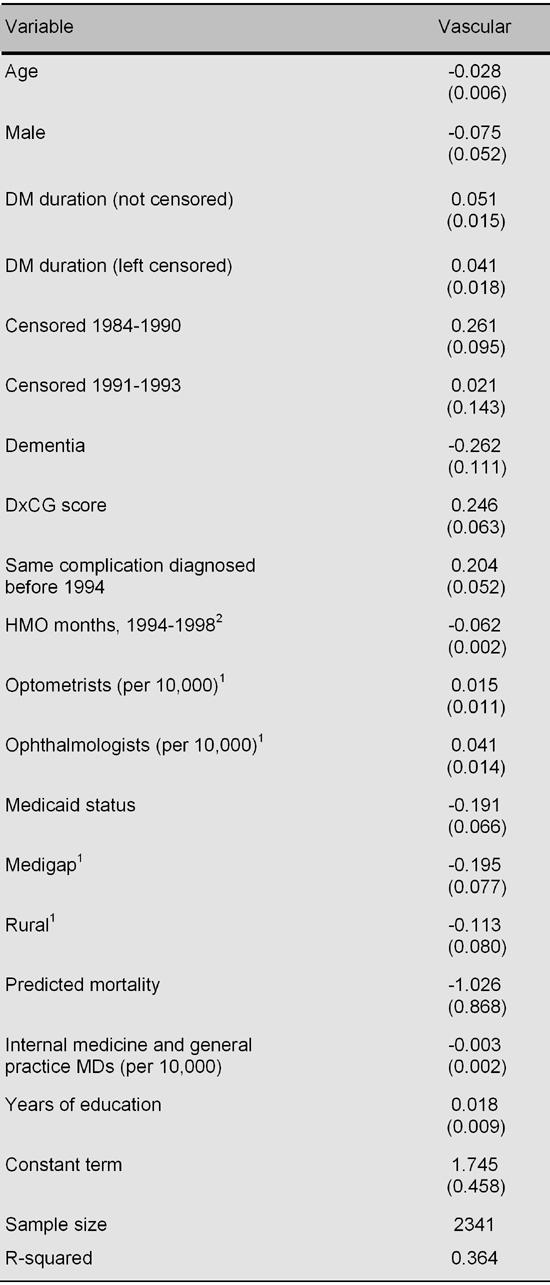
Standard errors in parentheses. First-stage regressions for other runs are similar and are available upon request. 1 Dummy variables for missing education, rural, optometrists and ophthalmologist not shown. 2 HMO months is 1994-1999 for blindness and low vision and 1994-1998 for all other specifications.
References
- 1.American Diabetes Association. American Diabetes Association; Alexandria, VA: 2001. Diabetes 2001 Vital Statistics. [Google Scholar]
- 2.National Diabetes Data Group. National Institutes of Health, National Institute of Diabetes and Digestive and Kidney Diseases; Bethesda, MD: 1995. Diabetes in America. 2nd ed. [Google Scholar]
- 3.Nathan DM, McKitrick C, Larkin M, Schaffran R, Singer DE. Glycemic control in diabetes mellitus: Have changes in therapy made a difference? Am J Med. 1996;100(2):157–163. doi: 10.1016/s0002-9343(97)89453-3. [DOI] [PubMed] [Google Scholar]
- 4.Javitt JC, Aiello LP. Cost-effectiveness of detecting and treating diabetic retinopathy. Ann Intern Med. 1996;124(1 Pt 2):164–169. doi: 10.7326/0003-4819-124-1_part_2-199601011-00017. [DOI] [PubMed] [Google Scholar]
- 5.Vijan S, Hofer TP, Hayward RA. Estimated benefits of glycemic control in microvascular complications in type 2 diabetes. Ann Intern Med. 1997;127(9):788–795. doi: 10.7326/0003-4819-127-9-199711010-00003. [DOI] [PubMed] [Google Scholar]
- 6.Vijan S, Hofer TP, Hayward RA. Cost-utility analysis of screening intervals for diabetic retinopathy in patients with type 2 diabetes mellitus. JAMA. 2000;283(7):889–896. doi: 10.1001/jama.283.7.889. [DOI] [PubMed] [Google Scholar]
- 7.American Diabetes Association. Clinical practice recommendations. Diabetes Care, Annual Supplements. 19941998.
- 8. http://www.aao.org/aao/member/policy/exams.cfm. American Academy of Ophthalmology; San Francisco: 2000. Policy Statement: Frequency of Ocular Examinations. accessed 17 April 2003. [Google Scholar]
- 9. http://www.aoa.org/clincare/pdf/1.pdf. American Optometric Association; St. Louis: 1997. Optometric clinical practice guideline: Comprehensive adult eye and vision examination. Reference guide for clinicians. 2nd ed., accessed 17 April 2003. [Google Scholar]
- 10.Health Employer Data and Information Set. http://www.aoa.org/clincare/pdf/1.pdf. 2001 accessed 22 January 2004.
- 11.Martin TL, Selby JV, Zhang D. Physician and patient prevention practices in NIDDM in a large urban managed-care organization. Diabetes Care. 1995;18(8):1124–1132. doi: 10.2337/diacare.18.8.1124. [DOI] [PubMed] [Google Scholar]
- 12.Weiner JP, Parente ST, Gamick DW, Fowles J, Lawthers AG, Palmer H. Variation in office-based quality: A claims-based profile of care provided to Medicare patients with diabetes. JAMA. 1995;273:1503–1508. doi: 10.1001/jama.273.19.1503. [DOI] [PubMed] [Google Scholar]
- 13.Coon P, Zulkowski K. Adherence to American Diabetes Association standards of care by rural health care providers. Diabetes Care. 2002;25(12):2224–2229. doi: 10.2337/diacare.25.12.2224. [DOI] [PubMed] [Google Scholar]
- 14.Lee PP, Feldman ZW, Ostermann J, Brown DS, Sloan FA. Longitudinal rates of annual eye examinations of persons with diabetes and chronic eye diseases. Ophthalmol. 2003;110(10):1952–1959. doi: 10.1016/S0161-6420(03)00817-0. [DOI] [PubMed] [Google Scholar]
- 15.Jencks SF, Huff ED, Cuerdon T. Changes in the quality of care delivered to Medicare beneficiaries, 1998-1999 to 2000-2001. JAMA. 2003;289(3):305–312. doi: 10.1001/jama.289.3.305. [DOI] [PubMed] [Google Scholar]
- 16.McGlynn EA, Asch SM, Adams J, Keesey J, Hicks J, DeCristofaro A, Kerr EA. The quality of health care delivered to adults in the United States. NEJM. 2003;348(26):2635–2645. doi: 10.1056/NEJMsa022615. [DOI] [PubMed] [Google Scholar]
- 17.Brown JB, Harris SB, Webster-Bogaert S, Wetmore S, Faulds C, Stewart M. The role of patient, physician and systemic factors in the management of type 2 diabetes mellitus. Fam Pract. 2002;19(4):344–349. doi: 10.1093/fampra/19.4.344. [DOI] [PubMed] [Google Scholar]
- 18.Cabana MD, Rand CS, Powe NR, Wu AW, Wilson MH, Abboud PA, Rubin HR. Why don't physicians follow clinical practice guidelines? A framework for improvement. JAMA. 1999;282(15):1458–1465. doi: 10.1001/jama.282.15.1458. [DOI] [PubMed] [Google Scholar]
- 19.Ciechanowski PS, Katon WJ, Russo JE, Walker EA. The patient-provider relationship: attachment theory and adherence to treatment in diabetes. Am J Psychiatry. 2001;158(1):29–35. doi: 10.1176/appi.ajp.158.1.29. [DOI] [PubMed] [Google Scholar]
- 20.Hebert PL, Geiss LS, Tierney EF, Engelgau MM, Yawn BP, McBean AM. Identifying persons with diabetes using Medicare claims data. Am J Med Qual. 1999;14(6):270–277. doi: 10.1177/106286069901400607. [DOI] [PubMed] [Google Scholar]
- 21. http://www.statsoftinc.com/textbook/stfacan.html. StatSoft, Inc.; Principal Components and Factor Analysis. accessed Jan. 20, 2004. [Google Scholar]
- 22.Dunteman GH. Sage Publications. Newbury Park, CA: 1989. Principal Components Analysis. [Google Scholar]
- 23.Stata, Version 8.0. College Station, TX 2002. Stata, Inc.; [Google Scholar]
- 24.Newey W. Efficient estimation of limited dependent variable models. J Econom. 1987;36:231–250. [Google Scholar]
- 25.Greene WH. Econometric Analysis, 5 th ed. Prentice Hall; Upper Saddle River, NJ: 2003. [Google Scholar]
- 26.Smith RJ, Blundell RW. An exogeneity test for a simultaneous equation tobit model with an application to labor supply. Econometrica. 1986;54(4):679–686. [Google Scholar]
- 27.DxCG risk adjustment software analytic guide, release 6.0. DxCG, Inc.; Boston, MA: 2001. [Google Scholar]
- 28.Ellis RP, Pope GC, Iezzoni LI, Ayanian JZ, Bate DW, Burstin H, Ash AS. Diagnosis-based risk adjustment for Medicare capitation payments. Health Care Financ Rev. 1996;17:101–128. [PMC free article] [PubMed] [Google Scholar]
- 29.Morgan CL, Currie CJ, Stott NC, Smithers M, Butler CC, Peters JR. The prevalence of multiple diabetes-related complications. Diabet Med. 2000;17(2):146–151. doi: 10.1046/j.1464-5491.2000.00222.x. [DOI] [PubMed] [Google Scholar]
- 30.Diabetes Control and Complications Trial Research Group. The effect of intensive diabetes treatment on the development and progression of long-term complications in insulin dependent diabetes mellitus: The diabetes control and com-plications trial. NEJM. 1993;329:977–986. doi: 10.1056/NEJM199309303291401. [DOI] [PubMed] [Google Scholar]
- 31.United Kingdom Prospective Diabetes Study Group. Intensive blood-glucose control with sulphonylureas or insulin compared with convention treatment and risk of complication in patients with type 2 diabetes (UKPDS 33) Lancet. 1998;352:837–853. [PubMed] [Google Scholar]
- 32.United Kingdom Prospective Diabetes Study Group. Effect of intensive blood- glucose control with metfomrin on complications in overweight patients with type 2 diabetes (UKPDS 34) Lancet. 1998;352:854–865. [PubMed] [Google Scholar]
- 33.Kerr EA, Smith DM, Hogan MM, Hofer TP, Krein SL, Bermann M, Hayward RA. Building a better quality measure: Are some patients with "poor quality" actually getting good care? Med Care. 2003;41(10):1173–1182. doi: 10.1097/01.MLR.0000088453.57269.29. [DOI] [PubMed] [Google Scholar]
- 34.Eastman RC, Javitt JC, Herman WH, Dasbach EJ, Zbrozek AS, Dong F, Manninen D, Garfield SA, Copley-Merriman C, Maier W et al. Model of complications of NIDDM. I. Model construction and assumptions. Diabetes Care. 1997;20(5):725–734. doi: 10.2337/diacare.20.5.725. [DOI] [PubMed] [Google Scholar]
- 35.Eastman RC, Javitt JC, Herman WH, Dasbach EJ, Copley-Merriman C, Maier W, Dong F, Manninen D, Zbrozek AS, Kotsanos J et al. Early Model of complications of NIDDM. II. Analysis of the health benefits and cost-effectiveness of treating NIDDM with the goal of normoglycemia. Diabetes Care. 1997;20(5):735–744. doi: 10.2337/diacare.20.5.735. [DOI] [PubMed] [Google Scholar]


