Abstract
Ubiquitin-dependent proteolysis of cyclins plays a critical role in cell cycle progression and tumorigenesis. We examined the expression of ubiquitin-conjugating enzyme E2C (UBE2C) during progression from Barrett's metaplasia to esophageal adenocarcinoma (EA) and the effects of targeting this enzyme on EA-derived cell lines. Using oligonucleotide microarrays UBE2C expression was elevated in 73% (11 of 15) of EAs relative to Barrett's metaplasia. Tissue microarray showed elevated UBE2C in 70% (7 of 10) of dysplastic samples and in 87% (58 of 67) of tumors relative to metaplastic samples. Transfection of dominant-negative UBE2C into Seg-1 cells decreased proliferation (P = .04) and increased mitotic arrest compared to vector controls (63.5% vs 6.8%; P < .001). Transfection of UBE2C small interfering RNA also caused inhibiton of cell proliferation and distortion of the cell cycle, with maximal increase of G2 cells (155% of mock cells) at 72 hours and of S-phase cells (308% of mock cells) at 24 hours. Treatment of Seg-1 cells with the proteasome inhibitor MG-262 (1 nM-1 µM) showed decreased proliferation (P = .02). EA-derived cells expressing UBE2C are sensitive to treatment with MG-262 and to silencing of UBE2C, suggesting that patients with EAs overexpressing UBE2C may benefit from agents targeting this ubiquitin-conjugating enzyme.
Keywords: Esophageal adenocarcinoma, ubiquitin, UBE2C, proteasome inhibitor, siRNA
Introduction
Targeted destruction of regulatory proteins, including cyclin B and securin, is important in cell cycle progression [1,2]. Destruction of cyclin B inactivates cdc2 kinase, allowing cells to exit mitosis, whereas destruction of securin releases separase, leading to anaphase and separation of chromatids. This targeted destruction is mediated by the ubiquitin/proteasome system. This involves the activity of three enzymes, including ubiquitin-activating enzymes (E1), which activate ubiquitin and transfer it to a ubiquitin-conjugating enzyme (E2). E2 then transfers ubiquitin to the target protein, often with the help of a ubiquitin-ligating enzyme (E3). The polyubiquitinated protein is then recognized by 26S proteasome for destruction. Although E1 and ubiquitin are highly conserved, various E2 and E3 enzymes provide substrate specificity [3,4].
The ubiquitin-conjugating enzyme E2C (UBE2C), also known as UBCH10, along with the E3 ligase of the anaphase-promoting complex (APC), catalyzes the ubiquitination of mitotic cyclins A and B, as well as securin. UBE2C is essential for cell cycle progression, and mutation of its active site cysteine confers a dominant-negative phenotype [5,6]. Overexpression of UBE2C at the mRNA level has been reported by Okamoto et al. [7] in a number of cancer cell lines and primary tumors, including lung, gastric, bladder, and uterine cancers, whereas only low levels were found in normal tissues. Takahashi et al. [8] suggest that overexpression of UBE2C may play an important role in advanced colon cancer with liver metastasis and that this overexpression may be a result of chromosomal amplification at the UBE2C locus, 20q13.1. In addition, NIH3T3 cells transfected with UBE2C showed an increase in growth rate and colony formation, suggesting that UBE2C is important in promoting cell growth and transformation. The level of UBE2C is also upregulated after NIH3T3 cells are transformed by an EWS-FL11 fusion gene from Ewing's sarcoma [9].
Over the past two decades, the incidence of esophageal adenocarcinoma has increased greatly, whereas the 5-year survival remains low at < 10% [10,11]. Although esophagectomy remains the primary means of treatment, there is an urgent need for both novel therapies and early detection methods. The present study was undertaken to delineate the expression of UBE2C in esophageal adenocarcinoma and to investigate this enzyme as a potential target against this deadly cancer.
Materials and Methods
Patients and Tissues
After obtaining informed consent, tissues were obtained from patients undergoing esophagectomy for adenocarcinoma at the University of Michigan Medical Center (Ann Arbor, MI) and transported to the laboratory in Dulbecco's modified Eagle's medium (DMEM; Life Technologies, Inc., Carlsbad, CA) on ice. A portion of each sample was embedded on OCT compound (Miles, Inc., Elkhart, IN) and frozen in isopentane cooled in liquid nitrogen for cryostat sectioning. The remainder was frozen in liquid nitrogen and stored at -80°C. Metaplastic or dysplastic mucosa and tumor samples with at least 70% cellularity were identified using hematoxylin and eosin-stained frozen sections, and 2-mm3 samples were obtained for RNA and protein isolation using microdissection on the original piece of tissue. The sections were then examined by two pathologists (T.J.G. and J.K.G.) to confirm the histopathological diagnosis of esophageal adenocarcinoma, high-grade or low-grade dysplasia, Barrett's metaplasia, or normal esophageal mucosa.
Cell Lines
Nine esophageal cell lines were used. OE33 [12], Seg-1, Bic-1, and Flo-1 were derived from esophageal adenocarcinoma and have been described previously [13]. H80-T, L20-T, and BA1 also originated from esophageal adenocarcinoma, whereas S95-B was derived from Barrett's metaplasia following immortalization with E6/E7 retroviral infection. BA1 was kindly provided by Dr. Michael Rutten (Oregon Health and Science University, Portland,OR). Het-1A is an esophageal squamous cell line immortalized by SV40 infection [14]. All cell lines were grown in DMEM (Life Technologies, Inc.) supplemented with 10% fetal bovine serum (FBS; Atlanta Biologicals, Norcross, GA) and 1% penicillin/streptomycin/fungizone (Life Technologies, Inc.) at 37°C in 5% CO2/95% air.
Oligonucleotide Microarray
Total RNA was isolated from 50 esophageal samples using Trizol (Life Technologies, Inc.) and purified with RNeasy spin columns (Qiagen, Valencia, CA) according to the manufacturer's instructions. RNA quality was confirmed by 1% agarose gel electrophoresis and A260/A280 spectrophotometer ratios. RNA quality was reassessed with Agilent Bioanalyzer (Agilent Technologies, Palo Alto, CA) at intermediate steps after double-stranded cDNA and cRNA syntheses. Four samples were excluded due to insufficient quantity of RNA (< 10 µg). cDNA synthesis, cRNA amplification, hybridization, and washing of HG-U133B Gene Chips (Affymetrix, Santa Clara, CA) were performed by the University of Michigan Cancer Center Microarray Core according to the manufacturer's instructions.
To normalize microarray data, a summary statistic was calculated using 11 probe pairs for each gene and the robust multichip average method [15], as implemented in the Affymetrix Library of Bioconductor (version 1.3, www.bioconductor.org), which provides background adjustment, quantile normalization, and summarization. Expression values for each sample were then compared to the mean expression value for the seven Barrett's metaplasia samples. A fold change of > 2.0 was considered significant, as previously described [16].
Western Blot Analysis
Western blot analysis was performed as previously described, with slight modifications [13]. Briefly, a 1:500 or 1:1000 dilution of a UBE2C antibody (catalog no. AB3861, rabbit polyclonal antibody; Chemicon International, Temecula, CA) and a 1:5000 dilution of goat anti-rabbit secondary antibody (catalog no. PI-1000; Vector Laboratories, Inc., Burlingame, CA) were used for protein detection. Western blot membrane was stripped (2 M glycine, pH 2.5, at room temperature for 30 minutes), and β-actin expression was determined with a 1:1000 or 1:5000 dilution of anti-β-actin antibody (catalog no. ab6276; Abcam, Inc., Cambridge, MA) and a 1:10,000 dilution of goat anti-mouse monoclonal secondary antibody (catalog no. ab6785; Abcam, Inc.) used as loading control.
Immunohistochemistry and Tissue Microarray (TMA)
TMA was constructed, as previously described [17], with formalin-fixed paraffin-embedded tissues. Immunohistochemical staining was performed using DAKO LSAB+ kit (DAKO, Carpinteria, CA) and diaminobenzidine as chromagen. Dewaxed and rehydrated sections of the TMA at 4 µm thickness were labeled with UBE2C antibody (Abcam, Inc.) at a 1:100 dilution after microwave citric acid epitope retrieval for 20 minutes.
The UBE2C antibody from Chemicon International was unsuitable for immunohistochemistry and was used only for Western blot analysis. Slides were lightly counterstained with hematoxylin. Each sample was then scored 0, 1, 2, or 3 corresponding to absent, light, moderate, or intense staining. To be conservative, only samples with moderate to intense staining were considered significant.
Expansion and Purification of Dominant-Negative UBE2C
pJS55 plasmid-encoding mutant (C114S) UBE2C was kindly provided by Dr. J. V. Ruderman (Harvard Medical School, Boston, MA) [5]. The sequence encoding the dominant-negative UBE2C was subcloned into a pSG5 vector (Stratagene, La Jolla, CA) at EcoRI and BglII restriction sites using standard techniques. UBE2C-pSG5 construct was then expanded in AG1 bacteria (Stratagene) according to the manufacturer's instructions. Individual colonies grown on LB plates were collected and grown overnight in LB medium containing ampicillin (100 µg/ml) and chloramphenicol (34 µg/ml) at 37°C with continuous shaking. DNA purification was performed using the QIAprep Spin Miniprep Kit (Qiagen) according to the manufacturer's instructions.
The dominant-negative UBE2C insert was confirmed by DNA sequencing and enzymatic digest. Sequencing was performed by the University of Michigan DNA Sequencing Core using an ABI Prism Gene Analyzer (Model 3700; Applied Biosystems, Foster City, CA). Forward and reverse primers 5′-CGTGCTGGTTATTGTGCTGTC-3′ and 5′-GTGAAATTTGTGATGCTATTGCT3′ were used. A doubleenzymatic digest was also performed with EcoRI/HindIII and NdeI using standard techniques. Products were resolved on a 1% agarose gel with ethidium bromide (0.25 µg/ml), and products were visualized with UV transillumination. After the insert had been confirmed, the bacteria were further expanded in LB medium overnight, and the dominant-negative plasmid was isolated using the High Purity Plasmid Maxiprep System (Marligen Biosciences, Ijamsville, MD) according to the manufacturer's instructions.
MTT and WST-1 Cell Proliferation Assays
Cell viability and cell proliferation were assessed using MTT assay (ATCC, Manassas, VA) or Cell Proliferation Reagent WST-1 (Roche Applied Science, Indianapolis, IN) according to the manufacturer's instructions. All experiments for dominant-negative UBE2C transfection and small interfering RNA (siRNA)-mediated silencing UBE2C were repeated in triplicate (MTT) or quadruplicate (WST-1). For WST-1 analysis, assays were performed in two different densities: 1.5 x 10³ and 2.5 x 10³ cells/well in 96-well format.
Transfection of Seg-1 Cells with Dominant-Negative UBE2C
Seg-1 cultures at 70% confluence were trypsinized, and cells were transferred to 96-well plates. Each well contained 2 x 10³ cells and was incubated for 24 hours in DMEM (Life Technologies, Inc.) with 10% FBS (Atlanta Biologicals) and 1% penicillin/streptomycin/fungizone (Life Technologies, Inc.). Transfection with dominant-negative UBE2C plasmids was performed using Fugene 6 Transfection Reagent (Roche Applied Science) according to the manufacturer's instructions using a 3:2 Fugene/DNA ratio. Cells were allowed to grow for 48 hours. Cell viability was then assessed using the MTTassay (ATCC). All experiments were repeated in triplicate.
To determine the mitotic index, cell cultures were trypsinized and cytospun onto poly-l-lysine-coated slides. Cells that were successfully transfected could be identified by expression of the AU1 epitope, which was included in the UBE2C insert. Immunohistochemical staining was performed as described above using an AU1 polyclonal antibody (Covance, Princeton, NJ) at a 1:400 dilution. Cells were then examined under light microscopy. Transfection efficiency was determined by dividing the number of cells that stained positive for AU1 by the total number of cells per high-power field. The mitotic index was calculated by dividing the number of mitotic figures in AU1-positive cells by the total number of cells expressing the AU1 protein. All experiments were repeated in triplicate.
Treatment of Cell Cultures with the Proteasome Inhibitor MG-262
Cell culture treatments were performed as previously described [18–21]. Briefly, once Seg-1 cultures had reached 70% confluence, they were trypsinized and transferred to 96-well plates. Each well was plated with 2 x 10³ cells and incubated for 24 hours in DMEM(Life Technologies, Inc.) with 10% FBS (Atlanta Biologicals) and 1% penicillin/streptomycin/fungizone (Life Technologies, Inc.). Cells were then treated with 1 nM to 1 µM MG-262 (Biomol International, Plymouth Meeting, PA) as previously described [22–24]. Control cultures were treated with an equivalent amount of distilled water. Cells were allowed to grow for 48 hours. Cell viability was then assessed using the MTTassay (ATCC). All experiments were repeated in triplicate.
UBE2C Silencing By Transfection of Gene-Specific siRNA
All SMARTpool siRNA reagents were purchased from Dharmacon (Lafayette, CO). Trial experiments were performed before actual siRNA assays to determine optimal cell densities, different sources of transfection reagents, ratios of transfection reagents, and siRNA cell toxicity for siRNA gene knockdown efficiency and transfection efficiency. Cell toxicity was assessed using cells stained with trypan blue. Twenty-four hours before siRNA transfection, Seg-1 cells were seeded in quadruplicate at densities of 1.5 x 10³, 2.5 x 10³, 3.5 x 10³, and 4.5 x 10³ cells/well with 100 ≤l of DMEM with 10% FBS but without antibiotics. For siRNA transfection, we added two reactants to each well of the 96-well format. Reaction tube 1 contained 9.5 µl of Opti-MEM I (Invitrogen, Carlsbad, CA) and 0.5 µl of 2 pmol/µl (2000 nM) SMARTpool siRNA (UBE2C or Lamin A/C as positive control or siCONTROL nontargeting siRNA no. 2 as negative control) (Dharmacon). Reaction tube 2 contained 0.1 µl of Lipofectamine RNAiMAX (Invitrogen) diluted in 9.9 µl of Opti-MEM I. The two reactants were incubated at room temperature for 5 minutes, respectively. siRNA and Lipofectamine RNAiMAX were then combined and incubated for 20 minutes at room temperature. siRNA Lipofectamin RNAiMAX complexes were pipetted into each well containing Seg-1 cells, with an siRNA working concentration of 10 nM. Transfected cells were incubated for 24 to 96 hours at 37°C before gene silencing analysis.
Real-Time Reverse Transcription-Polymerase Chain Reaction (RT-PCR) for Quantitative Measurement of UBE2C Expression after siRNA-Mediated Gene Silencing
Cells from four wells at each cell density were harvested at various time points, and total RNA was extracted using an RNeasy Mini Kit (Qiagen) according to the manufacturer's instruction. Real-time RT-PCR was performed using the Smart Cycler System (Cepheid, Sunnyvale, CA) with Platinum SYBR Green kit (Invitrogen). A standard curve of each targeted gene was generated with a series of dilutions (20.0, 2.0, 0.2, 0.02, and 0.0 ng) from a reference cDNA converted from total RNA using the Superscript II kit (Invitrogen). Primer sequences for real-time RT-PCR for UBE2C, a 132-bp PCR product crossing UBE2C exons 5 and 6, are UB2-5f 5′-ctg ccg agc tct gga aaa ac-3′ and UB2-6r 5′-agg aaa aat taa aaa gac gac aca ag-3′. The primers for Lamin A/C, a 145-bp PCR product crossing exons 2 and 3, are lmnaE2F 5′-aag gag gcc gca ctg agc act g-3′ and lmnaE3R 5′-cca ccc gcc gca gca tct c-3′. Optimal annealing temperature was determined, and melt curve was closely analyzed to ensure realtime PCR results.
Flow Cytometry of Seg-1 Cells Transfected after siRNA-Mediated UBE2C Silencing
Seg-1 cells grown in six-well culture plates were transfected with UBE2C-specific siRNA and harvested at 24, 48, 72, and 96 hours, respectively. Two other 72-hour to and 96-hour transfectants were also collected, each with an additional UBE2C-specific siRNA transfection at the 48-hour time point. For propidium iodine (PI) cell staining, cells were harvested by trypsinization and washed twice in ice-cold PBS. Cells were then resuspended at 106 cells/0.5 ml of PBS and fixed by dropwise addition of 1.17 ml of cold 100% methanol while vortexing. Cells were fixed for 20 minutes on ice and stored at 4°C before PI staining and flow cytometric analysis. For flow cytometry, cells were pelleted at 1000 rpm for 5 to 7 minutes at 4°C, washed with cold PBS and 1 ml of propidium iodide (PI) staining solution (50 µg/ml PBS) added to the cell pellet, and mixed. Fifty microliters of RNase A (100 µg/ml) was then added and incubated with the cells for 1 hour at room temperature in the dark. Flow cytometric analysis was performed at the University of Michigan Flow Cytometry Core.
Cells transfected with UBE2C-specific siRNA were also subjected to mitotic index analysis, as mentioned above. Cell cultures were trypsinized and cytospun onto poly-l-lysine-coated slides as described above. Mitotic cells were counted from enlarged microscopically obtained images.
Statistical Analysis
Statistical analysis was performed by comparing the experimental group to control cultures using a two-sided Student's t test.
Results
UBE2C mRNA Is Overexpressed in Barrett's Dysplasia and Adenocarcinoma
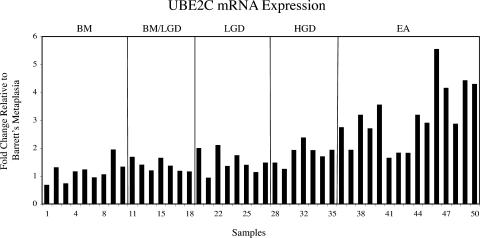
Oligonucleotide microarrays were used to analyze a cohort of 46 esophageal samples revealing at least a two-fold overexpression in esophageal adenocarcinoma relative to Barrett's metaplasia for UBE2C in 11 of 15 (73%) samples (Figure 1). Overexpression of UBE2C was also found in one of seven (14%) high-grade dysplasia samples and in one of eight (13%) low-grade dysplasia samples.
Figure 1.
Oligonucleotide microarray analysis of 46 esophageal samples revealed at least a two-fold overexpression (Y axis) of UBE2C in 11 of 15 (73%) cases of esophageal adenocarcinomas relative to Barrett's metaplasia. BM, Barrett's metaplasia; LGD, low-grade dysplasia; HGD, high-grade dysplasia; EA, esophageal adenocarcinoma. Numbers on X axis labels represent tumor ID.
UBE2C Protein Expression on TMA
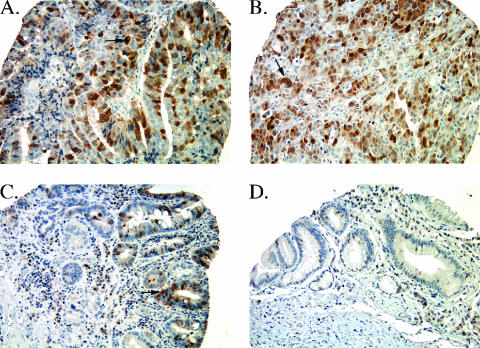
Staining of UBE2C protein was determined on a variety of esophageal tissue samples using UBE2C antibody on a TMA (Table 1). Significant UBE2C protein expression was found in 58 of 67 (87%) of esophageal adenocarcinoma samples (Figure 2, A and B). Seventy percent (7 of 10) of dysplastic samples (Figure 2C) showed significant UBE2C protein staining, whereas none of the Barrett's metaplasia samples was positive (Figure 2D). In addition, seven of eight (88%) samples of lymph node metastases had significant staining for UBE2C protein.
Table 1.
Immunohistochemical Analysis of UBE2C Expression in Esophageal Tissues Using TMA*.
| UBE2C Staining | |
| Barrett's metaplasia | 0/8 (0%) |
| Dysplasia | 7/10 (70%) |
| Adenocarcinoma | 58/67 (87%) |
| Lymph node metastases | 7/8 (88%) |
Significant staining includes moderate to intense staining (scores: 2 of 3; 3 of 3).
Figure 2.
TMA immunohistochemistry showing (A) intense nuclear staining (arrow) in tumor D48-T, (B) intense staining (arrow) in esophageal adenocarcinoma R35-T, (C) moderate staining (arrow) in Barrett's dysplasia sample P60-BD, and (D) no staining in Barrett's metaplasia sample I93-B. Original magnification, x200. Sections were counterstained with hematoxylin.
UBE2C Expression Confirmed on Western Blot Analysis
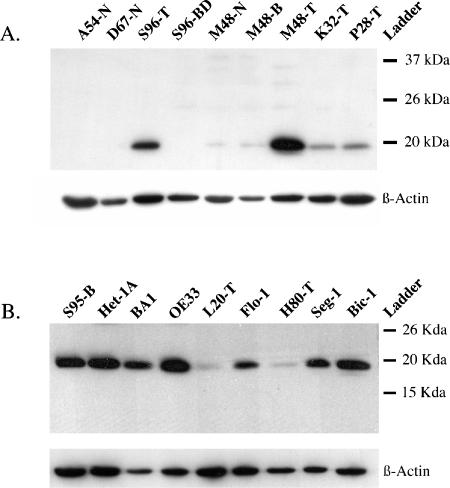
Western blot analysis was used to confirm TMA results for tumors S96-T, M48-T, K32-T, and P28-T showing an expression of a 19-kDa protein consistent with UBE2C (Figure 3A). In contrast, only small amounts of UBE2C protein were found in the Barrett's metaplasia sample M48-B and in the normal esophageal sample M48-N. There was no UBE2C protein expressed in the Barrett's dysplasia sample S96-BD or in the normal esophageal samples A54-N and D67-N (Figure 3A).
Figure 3.
(A) Western blot analysis shows expression of UBE2C (∼ 19 kDa) in esophageal adenocarcinomas S96-T, M48-T, K32T, and P28-T. The Barrett's metaplasia sample M48-B and the normal esophageal sample M48-N express small amounts of UBE2C, whereas there was no UBE2C protein expressed in either the Barrett's dysplasia sample S96-BD or the normal esophageal samples A54-N and D67-N. (B) Western blot analysis of nine esophageal cell lines shows expression of UBE2C (∼ 19 kDa) in the esophageal adenocarcinoma cell lines BA, OE33, Flo-1, Seg-1, and Bic-1, whereas L20-T and H80-T showed smaller amounts of UBE2C protein. The squamous cell line Het-1A and the Barrett's metaplasia-derived S95-B also expressed UBE2C protein. β-Actin expression was used as loading control.
Nine esophageal cell lines, including seven cell lines derived from esophageal adenocarcinoma, were evaluated for UBE2C protein expression by Western blot analysis. As shown in Figure 3B, the esophageal adenocarcinoma-derived cell lines BA, OE33, Flo-1, Seg-1, and Bic-1 expressed UBE2C protein, whereas the tumor-derived lines L20-T and H80-T showed lesser amounts of UBE2C protein. The SV40-immortalized squamous line Het-1A and the E6/E7 immortalized Barrett's metaplasia-derived S95-B cells also expressed UBE2C protein.
Seg-1 Transfection with Dominant-Negative UBE2C Decreased Cell Proliferation
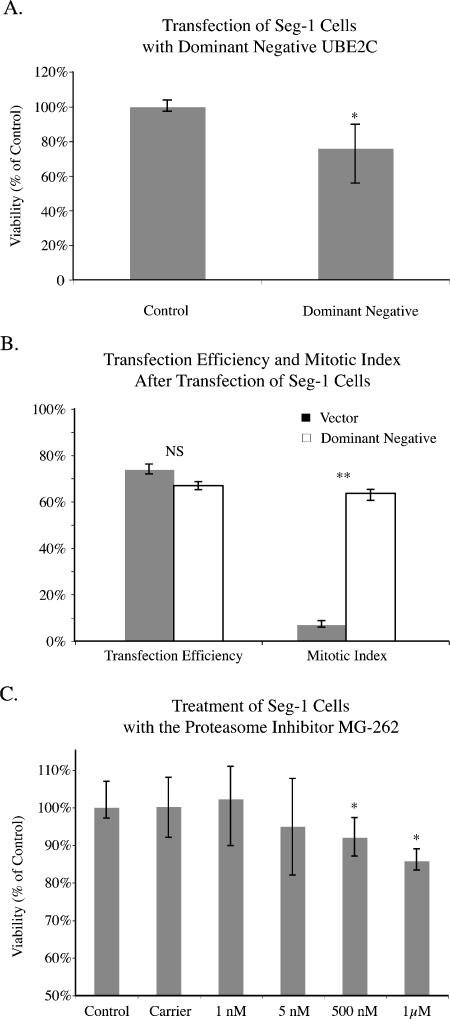
The dominant-negative UBE2C was subcloned and expanded in AG1 bacteria, and the insert was analyzed by DNA sequencing, confirming the expected dominant-negative UBE2C sequence encoding a cysteine-to-serine mutation at residue 114. The dominant-negative insert was also confirmed by double enzymatic digest. Wild-type UBE2C contains an internal NdeI restriction site that is lost in the dominant-negative insert due to a T-to-A base change. Seg-1 cells, which originally overexpressed wild-type UBE2C, showed a significant 24% decrease in cell proliferation 48 hours after transfection with the dominant-negative UBE2C when compared to control cultures using the MTT assay (P < .05) (Figure 4A). The transfection efficiency was 67% and was not significantly different between vector controls and plasmids containing dominant-negative UBE2C (Figure 4B). However, 64% of cells were in the mitotic phase after transfection with dominant-negative UBE2C, which was significantly higher than the 7% seen with vector controls (P < .005).
Figure 4.
(A) Seg-1 cells, which overexpressed UBE2C, showed a significant decrease in cell proliferation after transfection with the dominant-negative UBE2C when compared to control cultures using the MTT assay. All experiments were repeated in triplicate. (B) Although transfection efficiency was not significantly different between vector controls and dominant-negative UBE2C plasmids in Seg-1 cells, the percentage of cells in the mitotic phase was significantly higher after transfection with the dominant-negative UBE2C. All experiments were repeated in triplicate. (C) Seg-1 cells showed a significant decrease in cell proliferation after treatment with the proteasome inhibitor MG-262 when compared to control cultures using the MTT assay. All experiments were repeated in triplicate (*P < .05, **P < .005).
Seg-1 Cells Are Sensitive to the Proteasome Inhibitor MG-262
After treatment with the proteasome inhibitor MG-262, Seg-1 cells showed a significant decrease in cell proliferation at higher doses of 500 nM and 1 µM when compared to control cultures using the MTTassay (P < .05) (Figure 4C).
siRNA Targeting UBE2C Potently Inhibits UBE2C Expression
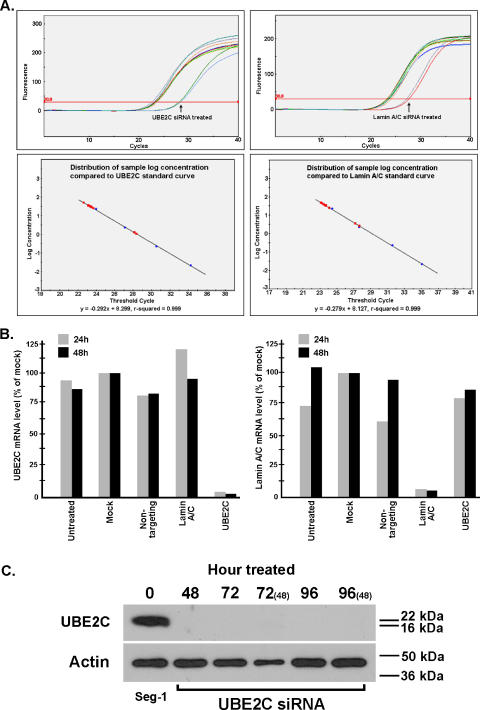
Seg-1 cells that overexpress UBE2C were grown at 1.5 x 10³ and 2.5 x 10³ cells/well in a 96-well format and transfected with 10 nM of either siGENOME SMARTpool UBE2C or relative control 24 hours after cell seeding. Cell toxicity was monitored, and no difference was detected between transfectants compared to untreated or mock cells (data not shown). Real-time quantitative RT-PCR revealed a potent gene silencing of UBE2C. A difference from four to five threshold cycles (Ct) between mock control and cells treated with UBE2C-specific siRNA and > 95% reduction of UBE2C mRNA in both 1.5 x 10³ and 2.5 x 10³ transfectants were detected (Figure 5, A and B). The gene-silencing efficiency of UBE2C mRNA expression consistently ranged from 92% to 95% among cells treated for 24, 48, 72, and 96 hours. Global siRNA inhibition was monitored using nontargeting siRNA transfection and was not detected in our experiments (Figure 5B). Cells transfected with UBE2C-specific siRNA were harvested at different time points, and protein was extracted. Western blot analysis revealed a complete UBE2C blockage, as shown in Figure 5C.
Figure 5.
UBE2C silencing with gene-specific siRNA treatment in Seg-1 cells. (A) Real-time quantitative RT-PCR indicated a potent knockdown of UBE2C mRNA expression, with four to five threshold cycles (Ct) between mock control and siRNA-mediated UBE2C-silencing transfectants. (B) A > 95% reduction of UBE2C mRNA expression was detected at 24 and 48 hours and in both 1.5 x 10³ and 2.5 x 10³ cells/well transfectants. (C) Western blot analysis of Seg-1 cells treated with UBE2C-specific siRNA at various time periods. The lack of expression in the treated samples indicates complete abrogation of the UBE2C protein.
Reduction of Cell Proliferation in Seg-1 Cells Transfected with UBE2C-Specific siRNA
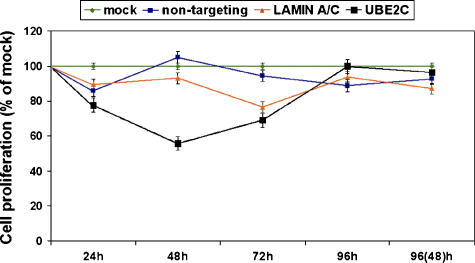
When WST-1 cell proliferation assay was performed on UBE2C-specific siRNA transfectants, a 39.9% (2.5 x 10³) to 44.3% (1.5 x 10³) reduction in cell proliferation was observed after 48-hour siRNA treatment compared to mock-transfected cells (Figure 6). Decreased cell proliferation was also seen in 24-hour and 72-hour transfectants that ranged from > 20% to > 30%, respectively (Figure 6). There was no difference in cell proliferation observed in either 96-hour transfectants or 96-hour dual transfectants compared to mock cells (Figure 6). However, this could be explained by the fact that, after 96 hours, cells had reached confluence and were no longer proliferating.
Figure 6.
WST-1 cell proliferation assay. The reduction of cell proliferation in Seg-1 cells treated with siRNA against UBE2C demonstrated a maximal decrease of 44.3% compared to mock control cells. Cell proliferation was decreased in 22.4% and 31.0% of mock controls after the 24-hour and 72-hour treatments, respectively, of siRNA-mediated UBE2C silencing. There was no difference in cell proliferation observed between treated cells and mock cells after 96 hours.
G2 Cells Reach Maximal Accumulation at 72 Hours Following siRNA-Mediated UBE2C Silencing
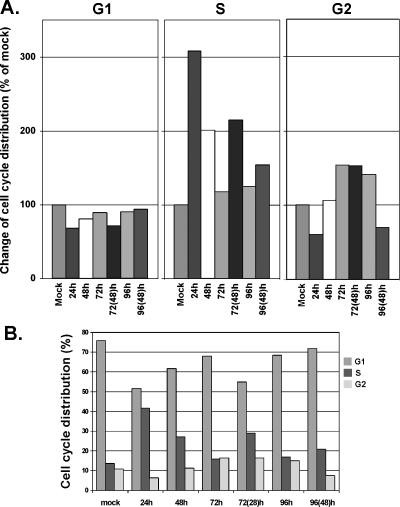
Because UBE2C is a cyclin A-specific and cyclin B1-specific E2 ubiquitin-conjugating enzyme, we speculated that, after UBE2C is downregulated, the cell cycle might be distorted and might arrest in G2-phase and/or M-phase accordingly. Figure 7 shows that G2 cell accumulation was observed to reach the maximum at 72 hours (155.4% of mock) but started to decrease 24 hours after siRNA-mediated UBE2C silencing compared to mock cells that showed a normal cell cycle distribution (Figure 7, A and B). Interestingly, we observed that knocking down UBE2C could also drastically increase S-phase cells (308% of mock) within 24 hours after siRNA treatment. In addition, 72 hours following siRNA-mediated UBE2C silencing with an additional siRNA treatment at the 48-hour time point, cells also demonstrated a sharp increase of S-phase cells (214.8% of mock for dual treatment vs 117.1% of mock for single treatment) (Figure 7A). PI labeling of cells for cytometric analysis also suggested that apoptosis was minimal (0.01–0.08%) in cells following siRNA treatment at various time points. Mitotic cells with condensed chromatin was increased by 38% (P = .016) in cells treated for 72 hours with siRNA against UBE2C compared to mock cells (data not shown).
Figure 7.
Flow cytometry of cells labeled with PI. (A) Change in cell cycle distribution over time was observed for Seg-1 cells following treatment with siRNA against UBE2C. Maximal G2 cell accumulation was observed 72 hours after treatment with siRNA (155.4% increase compared to mock cells and/or a normal range of cell cycle distribution). Shown also in this figure is that S-phase cell number increased significantly 24 hours after siRNA transfection. S-phase cells were also increased in 72-hour transfectants treated with an additional siRNA transfection at the 48-hour time point (24 hours before harvest of 72-hour transfectants). (B) Cell cycle distributions over time after siRNA treatment against UBE2C.
Discussion
In the current study, UBE2C was found to be overexpressed in a large percentage of esophageal adenocarcinomas—in 11 of 15 (73%) at the mRNA level and in 58 of 67 (87%) at the protein level—relative to Barrett's metaplasia, suggesting that therapeutic targeting against UBE2C may be applicable to some patients with esophageal adenocarcinomas. Overexpression of UBE2C also occurs relatively early in the progression from Barrett's metaplasia to esophageal adenocarcinoma, with overexpression in 2 of 15 (13%) Barrett's dysplasia samples at the mRNA level and in 7 of 10 (70%) at the protein level. This suggests that targeting UBE2C might also be applicable to premalignant lesions.
Cell-specific staining seen on TMA is likely related to the cell cycle-dependent expression of UBE2C protein. UBE2C is known to be involved in the regulation of the cell cycle, and overexpression of UBE2C may reflect tumor-related increases in cell proliferation. However, NIH3T3 cells transfected with UBE2C have been shown to have an increased rate of growth and colony formation, suggesting that UBE2C may be important in cell transformation [9].
UBE2C protein was expressed in several primary tumors and esophageal adenocarcinoma-derived cell lines. The squamous cell line Het-1A and the Barrett's metaplasia-derived cell line S95-B also expressed UBE2C protein on Western blot analysis. This may be due to the fact that these are SV40-immortalized and E6/E7-immortalized cell lines, respectively. In contrast, the primary Barrett's metaplastic tissue samples did not express high levels of UBE2C mRNA or protein based on oligonucleotide microarray, Western blot, and immunohistochemical analyses.
Transfection of Seg-1, an esophageal adenocarcinoma-derived cell line expressing high levels of UBE2C, with a dominant-negative form of UBE2C resulted in a significant decrease in cell proliferation compared to control cultures. Mutation of the active site cysteine to serine results in a dominant-negative phenotype [5,6]. Although the dominant-negative UBE2C can accept ubiquitin, the enzyme is not as efficient as the wild-type UBE2C due to the low free energy of hydrolysis of the ester bond compared to the thioester bond formed by wild type. The dominant-negative phenotype may also be the result of the mutant UBE2C being bound nonproductively to the APC [4].
Dominant-negative UBE2C inhibits destruction of cyclins A and B with cells arresting in M-phase. In the current study, 64% of transfected cells were arrested in the mitotic phase compared to only 7% of the cells transfected with vector controls, despite similar transfection efficiencies. Townsley et al. [5] reported similar findings showing that 50% of cells transfected with dominant-negative UBE2C showed cell cycle arrest compared to only 2% of controls. There was incomplete inhibition of cell cycle progression because > 35% of cells remained in interphase. In an earlier study, even a 10-fold excess of dominant-negative UBE2C resulted in only a 90% inhibition of UBE2C, with a 20-fold excess necessary for complete inhibition [5]. Inhibition of UBE2C may become an important therapeutic approach in cancers such as esophageal adenocarcinoma and may be even more effective when used in combination with therapies targeting other pathways. Wagner et al. [25] found that the combination of UBE2C siRNA and DR5/TRAIL receptor agonists significantly enhanced the killing of cancer cells.
Although no specific UBE2C inhibitors are currently available for clinical use, proteasome inhibitors form a novel class of chemotherapeutic agents that lead to cell cycle arrest and cell death. Tumor cells are more susceptible to proteasome inhibition due to their rapid division and disordered regulatory pathways, and bortezomib has now been approved for the treatment of advanced multiple myeloma. MG-262 is a cell-permeable reversible proteasome inhibitor (Ki = 0.023 nM) of the peptide boronate class that inhibits the chymotrypsinlike activity of proteasome [26]. When treated with MG-262, Seg-1 cells showed significant decreases in cell proliferation at higher doses of 500 nM and 1 µM when compared to control cultures (Figure 4C), although this did not reach 50% growth inhibition. Although Seg-1 cells expressed high levels of UBE2C, as did the majority of the esophageal cell lines available, L-20T and H80-T expressed low levels of UBE2C. Unfortunately, we were unable to analyze the effect of MG-262 on these cell lines due to their slow growth rate, which was on the order of months. However, this correlation between lower levels of UBE2C expression and a slower rate of growth suggests that UBE2C may be important in tumor cell proliferation.
Consistent with results from dominant-negative UBE2C transfection in Seg-1 cells, reduction of cell proliferation was observed up to 72 hours after siRNA-mediated UBE2C silencing in the same cell line. UBE2C mRNA expression was nearly completely silenced up to 96 hours after siRNA treatment. We included two controls with additional transfection of siRNA at the 48-hour time point for 72-hour and 96-hour groups; both single transfectants and dual transfectants showed nearly complete blockage of UBE2C mRNA and protein expression assayed using real-time RT-PCR and Western blot analysis. The greatest decrease in cell proliferation compared to mock cells was observed after 48 hours of siRNA treatment (44% reduction). However, cell cycle distortion was more complex after UBE2C was silenced because UBE2C is equally crucial for the degradation of the two distinct cyclins, cyclins A and B1 [5,6,27]. We observed a slight increase in G2 cells after 72-hour siRNA treatment as expected, but surprisingly, there was a sharp increase in S-phase cell accumulation 24 hours after siRNA-mediated UBE2C silencing. Both cyclin A and cyclin B1 are M-phase cyclins that engage cells to enter M-phase from G2-phase; timely degradation of the two cyclins leads cells to exit M-phase to G1-phase for the next round of the cell cycle [28]. Girard et al. [29] suggested that cyclin A might be involved in DNA replication as they observed that silencing cyclin A in G1-phase triggered inhibition of DNA synthesis. More recently, Mihaylov et al. reported that silencing of cyclin A, but not of cyclin B, led to complete duplication of genome from 4N to 8N. They analyzed cyclin A and geminin double knockouts and determined that the effect of cyclin A deficiency on cell cycle arrest and overreplication was dominant over that of geminin deficiency. The authors concluded that both cyclin A and geminin were required for the suppression of overreplication in Drosophila cells [30]. Neither G1-phase cyclin A silencing causing the onset of DNA synthesis nor the requirement of cyclin A to suppress overreplication may account for our observation of a sharp increase in S-phase cells 24 hours after siRNA-mediated UBE2C silencing. It may, however, be better explained by the unmasking of a cyclin B1 S-phase-promoting potential due to a decrease in cyclin B1 degradation following UBE2C silencing [31].
UBE2C expression has not been previously described in esophageal adenocarcinoma. This study characterizes the expression of UBE2C at mRNA and protein levels, providing a potential target in a subset of patients whose tumors express high levels of UBE2C in a type of a cancer with few successful treatments currently available. Esophageal adenocarcinoma-derived cells expressing UBE2C, as well as a dominant-negative form of UBE2C or UBE2C-specific siRNA, are sensitive to treatment with MG-262, suggesting that patients with esophageal adenocarcinomas expressing high levels of UBE2C may benefit from agents that target this ubiquitin-conjugating enzyme.
Acknowledgement
We would like to thank James McDonald for assistance with statistical analysis of microarray data.
Abbreviations
- UBE2C
ubiquitin-conjugating enzyme E2C
- DMEM
Dulbecco's modified Eagle's medium
- TMA
tissue microarray
Footnotes
This work was supported by National Cancer Institute grant CA71606 (D.G.B.) and National Institutes of Health Surgical Oncology Research Training Program T32 CA009672-15 (J.L.). Oligonucleotide microarray analysis was supported, in part, by the National Institutes of Health through the University of Michigan's Cancer Center support grant (5 P30 CA46592).
References
- 1.King RW, Deshaies RJ, Peters JM, Kirschner MW. How proteolysis drives the cell cycle. Science. 1996;274:1652–1659. doi: 10.1126/science.274.5293.1652. [DOI] [PubMed] [Google Scholar]
- 2.Townsley FM, Ruderman JV. Proteolytic ratchets that control progression through mitosis. Trends Cell Biol. 1998;8:238–244. doi: 10.1016/s0962-8924(98)01268-9. [DOI] [PubMed] [Google Scholar]
- 3.Ciechanover A. The ubiquitin-proteasome proteolytic pathway. Cell. 1994;79:13–21. doi: 10.1016/0092-8674(94)90396-4. [DOI] [PubMed] [Google Scholar]
- 4.Lin Y, Hwang WC, Basavappa R. Structural and functional analysis of the human mitotic-specific ubiquitin-conjugating enzyme, UbcH10. J Biol Chem. 2002;277:21913–21921. doi: 10.1074/jbc.M109398200. [DOI] [PubMed] [Google Scholar]
- 5.Townsley FM, Aristarkhov A, Beck S, Hershko A, Ruderman JV. Dominant-negative cyclin-selective ubiquitin carrier protein E2-C/UbcH10 blocks cells in metaphase. Proc Natl Acad Sci USA. 1997;94:2362–2367. doi: 10.1073/pnas.94.6.2362. [DOI] [PMC free article] [PubMed] [Google Scholar]
- 6.Yamanaka A, Hatakeyama S, Kominami K, Kitagawa M, Matsumoto M, Nakayama K. Cell cycle-dependent expression of mammalian E2-C regulated by the anaphase-promoting complex/cyclosome. Mol Biol Cell. 2000;11:2821–2831. doi: 10.1091/mbc.11.8.2821. [DOI] [PMC free article] [PubMed] [Google Scholar]
- 7.Okamoto Y, Ozaki T, Miyazaki K, Aoyama M, Miyazaki M, Nakagawara A. UbcH10 is the cancer-related E2 ubiquitin-conjugating enzyme. Cancer Res. 2003;63:4167–4173. [PubMed] [Google Scholar]
- 8.Takahashi Y, Ishii Y, Nishida Y, Ikarashi M, Nagata T, Nakamura T, Yamamori S, Asai S. Detection of aberrations of ubiquitin-conjugating enzyme E2C gene (UBE2C) in advanced colon cancer with liver metastases by DNA microarray and two-color FISH. Cancer Genet Cytogenet. 2006;168:30–35. doi: 10.1016/j.cancergencyto.2005.12.011. [DOI] [PubMed] [Google Scholar]
- 9.Arvand A, Bastians H, Welford SM, Thompson AD, Ruderman JV, Denny CT. EWS/FLI1 up regulates mE2-C, a cyclin-selective ubiquitin conjugating enzyme involved in cyclin B destruction. Oncogene. 1998;17:2039–2045. doi: 10.1038/sj.onc.1202129. [DOI] [PubMed] [Google Scholar]
- 10.Devesa SS, Blot WJ, Fraumeni JF., Jr Changing patterns in the incidence of esophageal and gastric carcinoma in the United States. Cancer. 1998;83:2049–2053. [PubMed] [Google Scholar]
- 11.Farrow DC, Vaughan TL. Determinants of survival following the diagnosis of esophageal adenocarcinoma (United States) Cancer Causes Control. 1996;7:322–327. doi: 10.1007/BF00052937. [DOI] [PubMed] [Google Scholar]
- 12.Rockett JC, Larkin K, Darnton SJ, Morris AG, Matthews HR. Five newly established oesophageal carcinoma cell lines: phenotypic and immunological characterization. Br J Cancer. 1997;75:258–263. doi: 10.1038/bjc.1997.42. [DOI] [PMC free article] [PubMed] [Google Scholar]
- 13.Hughes SJ, Nambu Y, Soldes OS, Hamstra D, Rehemtulla A, Iannettoni MD, Orringer MB, Beer DG. Fas/APO-1 (CD95) is not translocated to the cell membrane in esophageal adenocarcinoma. Cancer Res. 1997;57:5571–5578. [PubMed] [Google Scholar]
- 14.Stoner GD, Kaighn ME, Reddel RR, Resau JH, Bowman D, Naito Z, Matsukura N, You M, Galati AJ, Harris CC. Establishment and characterization of SV40 T-antigen immortalized human esophageal epithelial cells. Cancer Res. 1991;51:365–371. [PubMed] [Google Scholar]
- 15.Irizarry RA, Bolstad BM, Collin F, Cope LM, Hobbs B, Speed TP. Summaries of Affymetrix GeneChip probe level data. Nucleic Acids Res. 2003;31:e15. doi: 10.1093/nar/gng015. [DOI] [PMC free article] [PubMed] [Google Scholar]
- 16.Risinger JI, Maxwell GL, Chandramouli GV, Jazaeri A, Aprelikova O, Patterson T, Berchuck A, Barrett JC. Microarray analysis reveals distinct gene expression profiles among different histologic types of endometrial cancer. Cancer Res. 2003;63:6–11. [PubMed] [Google Scholar]
- 17.Kononen J, Bubendorf L, Kallioniemi A, Barlund M, Schraml P, Leighton S, Torhorst J, Mihatsch MJ, Sauter G, Kallioniemi OP. Tissue microarrays for high-throughput molecular profiling of tumor specimens. Nat Med. 1998;4:844–847. doi: 10.1038/nm0798-844. [DOI] [PubMed] [Google Scholar]
- 18.Cressey TR, Tilby MJ, Newell DR. Decreased telomerase activity is not a reliable indicator of chemosensitivity in testicular cancer cell lines. Eur J Cancer. 2002;38:586–593. doi: 10.1016/s0959-8049(01)00406-3. [DOI] [PubMed] [Google Scholar]
- 19.Troyano A, Fernandez C, Sancho P, de Blas E, Aller P. Effect of glutathione depletion on antitumor drug toxicity (apoptosis and necrosis) in U-937 human promonocytic cells. The role of intracellular oxidation. J Biol Chem. 2001;276:47107–47115. doi: 10.1074/jbc.M104516200. [DOI] [PubMed] [Google Scholar]
- 20.Uchino H, Kanai Y, Kim do K, Wempe MF, Chairoungdua A, Morimoto E, Anders MW, Endou H. Transport of amino acid-related compounds mediated by L-type amino acid transporter 1 (LAT1): insights into the mechanisms of substrate recognition. Mol Pharmacol. 2002;61:729–737. doi: 10.1124/mol.61.4.729. [DOI] [PubMed] [Google Scholar]
- 21.Vahrmeijer AL, van Dierendonck JH, Schutrups J, van de Velde CJ, Mulder GJ. Effect of glutathione depletion on inhibition of cell cycle progression and induction of apoptosis by melphalan (l-phenylalanine mustard) in human colorectal cancer cells. Biochem Pharmacol. 1999;58:655–664. doi: 10.1016/s0006-2952(99)00130-6. [DOI] [PubMed] [Google Scholar]
- 22.Lindsten K, Menendez-Benito V, Masucci MG, Dantuma NP. A transgenic mouse model of the ubiquitin/proteasome system. Nat Biotechnol. 2003;21:897–902. doi: 10.1038/nbt851. [DOI] [PubMed] [Google Scholar]
- 23.Mezquita J, Mezquita B, Pau M, Mezquita C. Downregulation of Flt-1 gene expression by the proteasome inhibitor MG262. J Cell Biochem. 2003;89:1138–1147. doi: 10.1002/jcb.10587. [DOI] [PubMed] [Google Scholar]
- 24.Terman A, Sandberg S. Proteasome inhibition enhances lipofuscin formation. Ann NY Acad Sci. 2002;973:309–312. doi: 10.1111/j.1749-6632.2002.tb04657.x. [DOI] [PubMed] [Google Scholar]
- 25.Wagner KW, Sapinoso LM, El-Rifai W, Frierson HF, Butz N, Mestan J, Hofmann F, Deveraux QL, Hampton GM. Overexpression, genomic amplification and therapeutic potential of inhibiting the UbcH10 ubiquitin conjugase in human carcinomas of diverse anatomic origin. Oncogene. 2004;23:6621–6629. doi: 10.1038/sj.onc.1207861. [DOI] [PubMed] [Google Scholar]
- 26.Mc Cormack T, Baumeister W, Grenier L, Moomaw C, Plamondon L, Pramanik B, Slaughter C, Soucy F, Stein R, Zuhl F, et al. Active site-directed inhibitors of Rhodococcus 20S proteasome. Kinetics and mechanism. J Biol Chem. 1997;272:26103–26109. doi: 10.1074/jbc.272.42.26103. [DOI] [PubMed] [Google Scholar]
- 27.Rape M, Kirschner MW. Autonomous regulation of the anaphase-promoting complex couples mitosis to S-phase entry. Nature. 2004;432:588–595. doi: 10.1038/nature03023. [DOI] [PubMed] [Google Scholar]
- 28.Hunter T, Pines J. Cyclins and cancer. Cell. 1991;66:1071–1074. doi: 10.1016/0092-8674(91)90028-w. [DOI] [PubMed] [Google Scholar]
- 29.Girard F, Strausfeld U, Fernandez A, Lamb NJ. Cyclin A is required for the onset of DNA replication in mammalian fibroblasts. Cell. 1991;67:1169–1179. doi: 10.1016/0092-8674(91)90293-8. [DOI] [PubMed] [Google Scholar]
- 30.Mihaylov IS, Kondo T, Jones L, Ryzhikov S, Tanaka J, Zheng J, Higa LA, Minamino N, Cooley L, Zhang H. Control of DNA replication and chromosome ploidy by geminin and cyclin A. Mol Cell Biol. 2002;22:1868–1880. doi: 10.1128/MCB.22.6.1868-1880.2002. [DOI] [PMC free article] [PubMed] [Google Scholar]
- 31.Moore JD, Kirk JA, Hunt T. Unmasking the S-phase-promoting potential of cyclin B1. Science. 2003;300:987–990. doi: 10.1126/science.1081418. [DOI] [PubMed] [Google Scholar]


