Abstract
Polycomb group (PcG) protein Bmi-1 is an important regulator of cell proliferation. It regulates cellular senescence and proliferation of cells via the transcriptional repression of INK4a/ARF locus and other target genes. Here, we report that Mel-18, a PcG ring finger protein (PCGF) transcriptionally down-regulates Bmi-1. Furthermore, the expression of Bmi-1 and Mel-18 inversely correlates in proliferating and senescent human fibroblasts. Bmi-1 down-regulation by Mel-18 results in accelerated senescence and shortening of the replicative life span in normal human cells. Importantly, using promoter-reporter, chromatin immunoprecipitation, and quantitative real-time primary transcript RT-PCR assays, and an RNA interference approach, we demonstrate that Bmi-1 is a bona fide target of c-Myc oncoprotein. Finally, our data suggest that Mel-18 regulates Bmi-1 expression during senescence via down-regulation of c-Myc. These studies link c-Myc and polycomb function in cell proliferation and senescence.
INTRODUCTION
After a finite number of cell divisions, most normal human cells undergo cellular senescence, whereby cells cease to divide (reviewed in Campisi, 2005; Dimri, 2005). Cellular senescence constitutes a tumor suppressor mechanism (Campisi, 2005; Dimri, 2005), and bypass of senescence is required for tumorigenesis (Dimri, 2005). It is regulated by an array of growth regulators including polycomb group (PcG) proteins (reviewed in Itahana et al., 2004). PcG proteins are chromatin-modifying proteins, which play an important role in development (reviewed in Ringrose and Paro, 2004). Besides their role in development, these proteins also regulate cell proliferation, senescence, and tumorigenesis (reviewed in Valk-Lingbeek et al., 2004; Gil et al., 2005). In particular, EZH2 and Bmi-1 overexpression has been linked to invasive breast and prostate cancers (Varambally et al., 2002; Kleer et al., 2003; Kim et al., 2004; Glinsky et al., 2005). In addition to its role in oncogenesis, recent work from several laboratories indicates that Bmi-1 is required for self-renewal of hematopoietic stem cells (HSCs) and neural stem cells in murine models (Lessard and Sauvageau, 2003; Molofsky et al., 2003; Park et al., 2003; Iwama et al., 2004). Bmi-1 is also involved in the maintenance and proliferation of breast stem cells (Liu et al., 2006).
The exact role of PcG proteins in tumorigenesis is still unclear. However, some of the polycomb proteins, such as Bmi-1 and EZH2, are known to regulate senescence and proliferation via well-known growth regulatory pathways (Jacobs et al., 1999; Bracken et al., 2003; Itahana et al., 2003). For example, Bmi-1 negatively regulates INK4a/ARF locus (Jacobs et al., 1999), which may impact both p16-pRb and ARF-p53-p21 pathways of cellular senescence (Dimri, 2005). Indeed, Bmi-1 has been shown to regulate cellular senescence in murine and human cells (Jacobs et al., 1999; Itahana et al., 2003). Bmi-1 is also thought to prevent premature senescence of neural stem cells by repressing INK4a/ARF locus (Bruggeman et al., 2005; Molofsky et al., 2005). Premature senescence of cells may contribute to organismic aging (Campisi, 2005). If so, the regulators of senescence are likely to play a role in aging. Indeed, down-regulation of Bmi-1 by the disruption of the SNF2-like gene PASG was shown to result in growth retardation and premature aging in a murine model (Sun et al., 2004).
Bmi-1 is a particularly interesting oncoprotein; it not only regulates the INK4a/ARF locus, but can also immortalize human mammary epithelial cells (HMECs) (Dimri et al., 2002). We recently reported that Bmi-1 expression is down-regulated during cellular senescence (Itahana et al., 2003). Molecular pathways that regulate Bmi-1 expression during cellular senescence are unknown. Identification of such regulatory pathways is important for our understanding of the role of Bmi-1 and other PcG proteins in cell proliferation, oncogenesis, stem cell biology, and aging.
In addition to Bmi-1, mammalian cells also express Mel-18 (also known as polycomb group ring finger 2 or PCGF2), a closely related PcG protein (Ishida et al., 1993). The Mel-18 gene product is structurally highly similar to Bmi-1. Its N-terminal region, which contains a RING finger domain, is 93% homologous to the similar region of Bmi-1 (Ishida et al., 1993). The homology toward the C-terminal region, which contains a nuclear localization signal (NLS) and a proline-serine–rich (PS) domain, is less conspicuous than the N-terminal region (Ishida et al., 1993). Bmi-1 and Mel-18 are known to interact and are thought to be the constituents of PRC1 (polycomb repressive complex 1; Alkema et al., 1997; Ringrose and Paro, 2004). However, a recent study suggests that Mel-18 may not be part of PRC1, although it could structurally but not functionally replace Bmi-1 in the PRC1 complex (Cao et al., 2005).
It is thought that Bmi-1 and Mel-18 regulate overlapping and unique sets of genes (Kanno et al., 1995; Tetsu et al., 1998, Akasaka et al., 2001). However, unlike Bmi-1, it has been reported that Mel-18 can bind to a well-defined nucleotide sequence 5′-GACTNGACT-3′ present in the promoter region of certain genes (Kanno et al., 1995). One of the unique target genes of Mel-18 is c-Myc, which is transcriptionally repressed by Mel-18 (Kanno et al., 1995; Tetsu et al., 1998). The exact role of Mel-18 in senescence, proliferation, and oncogenesis is unclear. Although its structural similarities to Bmi-1 suggest it to be an oncoprotein, a few studies have indicated that Mel-18 may in fact function as a tumor suppressor (Kanno et al., 1995; Tetsu et al., 1998) and that it might negatively regulate self-renewal of HSCs (Kajiume et al., 2004).
Despite the high similarity between Bmi-1 and Mel-18, we found that Mel-18 overexpression leads to accelerated or premature senescence in proliferating fibroblasts and that it is overexpressed in senescent fibroblasts. We also report that Mel-18 functions as a transcriptional repressor of Bmi-1 expression in human cells. Importantly, we found that the Bmi-1 promoter region contains a functional E-box through which c-Myc and Mel-18 regulate expression of Bmi-1. Because Mel-18 down-regulates c-Myc expression and Bmi-1 is a c-Myc target, our data suggest that Mel-18 regulates expression of Bmi-1 via repression of c-Myc during cellular senescence.
MATERIALS AND METHODS
Cellular Reagents and Methods
WI-38 and BJ fibroblasts were obtained from J. Campisi (Lawrence Berkeley National Laboratory, Berkeley, CA). The MRC-5 fibroblast strain was obtained from the NIA Aging Cell Repository (Coriell Institute for Medical Research, Camden, NJ). The fibroblasts strains were grown and serially passaged in DMEM supplemented with 10% fetal calf serum, and the onset of senescence in fibroblasts was determined using Senescence-associated beta galactosidase (SA-β-gal) assay as described (Dimri et al., 1995; Itahana et al., 2003). MCF10A and MCF7 cells were cultured as described in Dimri et al. (2002). Stable cell lines expressing Mel-18 or other genes of interest were generated by infection of the retroviral vectors expressing the particular gene as described (Dimri et al., 2000). The retroviruses were produced by transient transfection of the retroviral vector together with pIK packaging plasmid into tsa 54 packaging cell line as described (Dimri et al., 2000).
Molecular Reagents and Methods: Retroviral Expression and Short-Hairpin RNA Vectors
The vector containing cDNAs of Mel-18 and c-Myc were obtained from ATCC (American Type Culture Collection, Manassas, VA). Mel-18 cDNA was amplified and cloned either in pLPC retroviral vector obtained from Dr. J. Campisi (originally from Dr. T. deLange, Rockefeller University, New York) or in pBabe-puro vector (Dimri et al., 2000). Bmi-1 and Mel-18 short-hairpin RNAs (shRNAs) were designed and cloned in the retroviral vector pRS (retro-super) obtained from Oligoengine (Seattle, WA). The sequences of shRNA were as follows: Mel-18 no. 1: CGACGCCACCACUAUCGUG; no. 2: AGACCAACAAAUACUGCCC; and Bmi-1 shRNA no. 1 GUUCACAAGACCAGACCAC and no. 2 GACCAGACCACUACUGAAU. A retroviral vector expressing c-Myc shRNA (clone no. SH2236-B-10) was obtained from Open Biosystems (Huntsville, AL).
Promoter-Reporter Vectors and Luciferase Assays
The promoter region of Bmi-1 was identified by BLAST comparison of the untranslated region of Bmi-1 cDNA with human genomic clones and analyzing the region further upstream of it. The putative promoter region was amplified using a BAC clone RP11-573G6 obtained from the Children's Hospital Oakland Research Institute, Oakland, CA. The promoter regions of different sizes were amplified by PCR and cloned in the pGL3 luciferase reporter vector (Promega, Madison, WI). The reporter assays were performed using a luciferase assay kit (Promega) as described (Dimri et al., 2002).
Chromatin Immunoprecipitation Assays
Chromatin immunoprecipitation (ChIP) assays were performed using a kit from Upstate Cell Signaling Solutions (Charlottesville, VA). Briefly, chromatin that was cross-linked to transcription factors was immunoprecipitated using antibodies against c-Myc or Mel-18 (obtained from Santa Cruz Biotechnology, Santa Cruz, CA). The immunoprecipitated chromatin was amplified using 5′ACGGGCCTGACTACACCGACACT3′ and 5′CTGAAGGCAGAGTGGAAACTGACAC3′ primers, which flank the c-Myc binding site of the Bmi-1 promoter. The primers- 5′TTCAAAGGCATCTTCTGCAG3′ and 5′CTTAACCGCCCAGATACATC3′, which amplify a non-Myc binding region of the Bmi-1 promoter were used as a negative control.
Quantitative Real-Time RT-PCR Assays
The real-time RT-PCR (QRT-PCR) was carried out using Brilliant SYBR Green QRT-PCR Master Mix, 2-Step kit (Stratagene, La Jolla, CA). Briefly, total RNA was isolated using TRIzol reagent as described by manufacturer (Invitrogen, Carlsbad, CA), and treated with DNase (Promega) to remove any contaminating genomic DNA. The cDNA was generated using oligo dT primer mix and 2.0 μg of DNase treated total RNA. The cDNA was PCR-amplified using primers specific for GAPDH, c-Myc, and Bmi-1. The PCR amplification was carried out using Mx 3000P QPCR system (Stratagene). The PCR conditions consisted of an initial activation of SureStart Taq DNA polymerase at 95°C for 10 min, followed by 40 cycles of 95°C for 30 s, 58°C for 1 min, and 72°C for 1 min. The Ct (threshold cycle) value of Bmi-1 or c-Myc amplification was normalized to that of GAPDH control. The primers for QRT-PCR were as follows: GAPDH forward (F), 5′ GCTGAACGGGAAGCTCACTG 3′; GAPDH reverse (R), 5′GTGCTCAGTGTAGCCCAGGA 3′; Bmi-1 F, 5′ TGGAGAAGGAATGGTCCACTTC 3′; Bmi-1 R, 5′ GTGAGGAAACTGTGGATGAGGA 3′; and c-Myc F, 5′ TACATCCTGTCCGTCCAAGCA 3′; and c-Myc R, 5′ TCAGCCAAGGTTGTGAGGTTG 3′.
Quantitative real-time PCR to detect primary transcription, referred to as PT RT-PCR (primary transcript real-time RT-PCR) was carried out as described (Murray, 2005). Briefly, DNase-treated RNA was reverse-transcribed using random primer mix and amplified using primers that amplify a region of ∼200 base pairs of reverse-transcribed unspliced RNAs. The primers for PT RT-PCR were as follows: Bmi-1 F, 5′ CGTGTATTGTTCGTTACCTGGA3′ (present in Exon 2); Bmi-1 R, 5′ GGCAAGAAATTAAACGGCTACC3′ (present in Intron 3); c-Myc F, 5′GTCCAGAGACCTTTCTAACGTA3′ (present in Intron 2); and c-Myc R, 5′AGAAGGTGATCCAGACTCTGAC3′ (present in Exon 3).
Immunological Reagents, Western Blot Analysis, and Determination of Protein Half-Life
Bmi-1 was detected using either F6 mouse mAb from Upstate Cell Signaling Solutions or 1H6B10G7 mAb from Zymed (South San Francisco, CA). Mel-18 was detected by a rabbit polyclonal H-115 (Santa Cruz Biotechnology). The 9E10 mAb (Santa Cruz Biotechnology) against c-Myc was used to detect the expression of c-Myc tag in exogenously expressed proteins. p14ARF was detected using a rabbit polyclonal H-132 Ab (Santa Cruz Biotechnology). Western blot analyses to detect the expression of various proteins were performed as described (Dimri et al., 2000; Itahana et al., 2003). Protein half-life was determined using cyclohexamide (CHX) treatment to block the synthesis of new protein or by pulse-chase immunoprecipitation (IP) experiment using in vivo labeling of proteins with 35S-Express labeling mix (cat. no. NE-072, PerkinElmer Life and Analytical Sciences, Wellesley, MA) followed by chase with cold methionine/cysteine mix for different time points and IP using a specific antibody as described (Boyer et al., 1996).
RESULTS
Mel-18 Induces Premature Senescence in Normal Human Diploid Fibroblasts
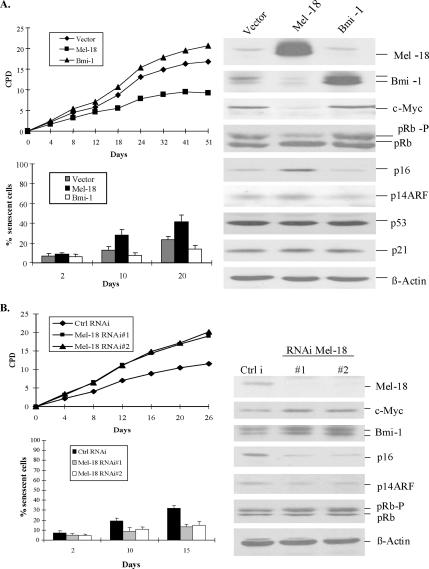
To understand the role of Bmi-1–related PcG proteins in cellular senescence and proliferation, we cloned the cDNA of Mel-18 into a retroviral expression vector pLPC. Using this vector, we overexpressed Mel-18 in MRC-5, a normal strain of human diploid fibroblasts (HDFs; Figure 1). In contrast to Bmi-1, which enhances proliferation and extends replicative life span (Itahana et al., 2003), Mel-18 overexpression led to inhibition of cellular proliferation (Figure 1A) and induction of premature senescence in MRC-5 fibroblasts as determined by SA-β-gal staining (Figure 1A, bottom panel, and Supplementary Figure 1). To further explore the mechanism of induction of premature senescence by Mel-18, we examined the expression of various senescence-associated genes in control and Mel-18– and Bmi-1–overexpressing MRC-5 fibroblasts (Figure 1A, right panel). Because, c-Myc has been reported to be down-regulated by Mel-18 (Tetsu et al., 1998), we also examined c-Myc expression in Mel-18–overexpressing cells. Consistent with published findings, significant down-regulation of c-Myc was noticed in Mel-18–overexpressing cells.
Figure 1.
Mel-18 regulates cellular senescence in human fibroblasts. (A) Overexpression of Mel-18 induces premature senescence in proliferating fibroblasts. MRC-5 fibroblasts overexpressing Mel-18 or Bmi-1 and vector-infected control cells were serially passaged in culture to determine the replicative life span (top left panel). Premature induction of senescence was determined using SA-β-gal staining (Dimri et al., 1995) of Mel-18– or Bmi-1–overexpressing and control cells (bottom left panel). % senescent cells, the percentage of SA-β-gal positive cells as determined by counting 200 cells in four different fields. Western blot analysis of various regulators of senescence (right panel) was done as described (Dimri et al., 2002; Itahana et al., 2003). CPD denotes cumulative population doublings. (B) Knockdown of Mel-18 expression leads to the extension of replicative life span in MRC-5 fibroblasts. Mel-18–expressing shRNAs (RNAi Mel-18 no. 1, RNAi Mel-18 no. 2) and control cells (Ctrl i) were passaged in culture to determine replicative life span, and SA-β-gal staining was done to determine the onset of senescence as described above. Western blot analyses (right panel) of Bmi-1, p16, pRb, and Mel-18 were done as described in Materials and Methods.
Interestingly, however, we found that Mel-18 overexpression leads to down-regulation of endogenous Bmi-1 and up-regulation of p16 in MRC-5 fibroblasts (Figure 1A). This finding suggests that Mel-18 may induce premature senescence via down-regulation of Bmi-1, leading to up-regulation of p16 and reduction in pRb phosphorylation. We also examined the expression of p14ARF in Mel-18– and Bmi-1–overexpressing cells. Consistent with published data, Bmi-1 modestly down-regulated p14ARF, whereas Mel-18–expressing cells showed a modest up-regulation of p14ARF. However, no induction of p53 or its target p21 was evident in Mel-18–overexpressing cells, suggesting that a modest up-regulation of p14ARF does not impact p53 and p21 expression in these cells. These data are consistent with our earlier finding that Bmi-1 does not significantly alter p53 and p21 expression in human fibroblasts (Itahana et al., 2003). Nonetheless, a modest up-regulation of p14ARF in Mel-18–overexpressing cells may still contribute to growth inhibition by p53-independent mechanisms (reviewed in Sherr et al., 2005).
To confirm the results of overexpression studies, we further determined if knockdown of Mel-18 expression by RNA interference (RNAi) approach up-regulates Bmi-1 and extends the replicative life span. Indeed, stable overexpression of two different Mel-18 shRNAs extended the replicative life span in MRC-5 fibroblasts (Figure 1B). Mel-18 shRNA-expressing cells also exhibited considerably less numbers of senescent cells (Figure 1B). Consistent with overexpression studies, Western blot analysis of Mel-18 knockdown cells showed up-regulation of Bmi-1, down-regulation of p16, and a consequent increase in pRb phosphorylation (Figure 1B). We also used stable expression of two different shRNAs (Bmi-1 RNAi no. 1 and Bmi-1 RNAi no. 2) against Bmi-1 and determined the replicative life span of MRC-5 fibroblasts. Western blot analysis indicated that only Bmi-1 RNAi no. 2 was effective in down-regulating Bmi-1 expression (Supplementary Figure 2). Furthermore, our results indicated that similar to Mel-18 overexpression, Bmi-1 knockdown by RNAi no. 2 accelerates the entry of cells into senescence by up-regulating p16 and increasing the growth inhibitory form of pRb (Supplementary Figure 2).
Mel-18 Expression Is Up-regulated during Cellular Senescence in HDFs
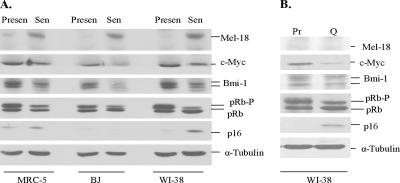
We have previously reported that Bmi-1 expression is down-regulated during cellular or replicative senescence in HDFs (Itahana et al., 2003). The molecular basis of Bmi-1 down-regulation during cellular senescence is not known. On the basis of our data, we surmised that Mel-18 expression might be up-regulated during senescence, which would result in down-regulation of Bmi-1 expression. Conversely, low levels of Mel-18 or absence of its expression in presenescent cells may permit high Bmi-1 expression in these cells. To address these hypotheses, we prepared total cell extract from presenescent (Presen), and senescent (Sen) cells of MRC5, BJ, and WI-38 fibroblast strains and examined Mel-18, Bmi-1, c-Myc, pRb, and p16 expression by Western blot analysis. The onset of senescence in these fibroblast strains was determined using SA-β-gal marker (Dimri et al., 1995). Consistent with our previous results (Itahana et al., 2003), Bmi-1 was down-regulated during cellular senescence (Figure 2A). Importantly, down-regulation of Bmi-1 also correlated with reduced c-Myc expression and a marked increase in Mel-18 expression in senescent cells (Figure 2A).
Figure 2.
Mel-18 is overexpressed in senescent human fibroblasts. (A) MRC-5, BJ, and WI-38 strains of human fibroblast were serially passaged in culture until senescence as determined by measuring the SA-β-gal index. Mel-18, Bmi-1, pRb, p16, and α-tubulin in total cell lysates from proliferating presenescent (Presen) and senescent (Sen) cultures were detected by Western blot analysis. (B) Mel-18 is not up-regulated during quiescence in WI-38 fibroblasts. Proliferating presenescent (Pr) cells were made quiescent (Q) by incubating cells in 0.1% serum for 5 d. Total cell lysates were prepared from proliferating (Pr) and quiescent (Q) cells, and the expression of Mel-18, c-Myc, Bmi-1, pRb, p16, and α-tubulin was determined by Western blot analysis.
Our data indicate that Mel-18 expression is virtually undetectable in presenescent (Presen) cells and is up-regulated in senescent (Sen) fibroblasts (Figure 2A). Consistent with previously published literature, senescent cells contained high levels of hypophosphorylated pRb (Figure 2A). Our results also indicated that p16 was conspicuously up-regulated in senescent MRC-5 fibroblasts, but not in senescent BJ fibroblasts, which expresses much lower levels of p16 even during senescence (Itahana et al., 2003). Up-regulation of Mel-18 in senescent cells could result because of the growth-arrested stage of these cells and not necessarily because of senescence. To rule out this possibility, we also examined Mel-18 expression in quiescent cells, which were growth arrested by serum starvation as described (Dimri et al., 1995). The results indicated that growth arrest due to quiescence does not increase Mel-18 expression, suggesting that up-regulation of Mel-18 is senescence-specific and is not due to growth arrest per se (Figure 2B). We also examined c-Myc and Bmi-1 expression under quiescence condition. Consistent with published literature (Waters et al., 1991), c-Myc expression was significantly reduced in quiescent fibroblasts. Our data also suggested a correlation between c-Myc and Bmi-1 expression in growing and senescent but not in quiescent fibroblasts. Importantly, Bmi-1 expression inversely correlated with Mel-18 expression during all three growth conditions: senescence (Sen), quiescence (Q), and proliferation (Pr; Figure 2, A and B).
Mel-18 Regulates Bmi-1 and c-Myc Expression
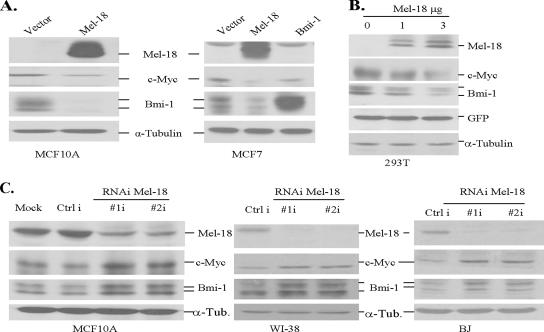
To further confirm that Mel-18 regulates Bmi-1 expression and to gain insight into its mechanisms, we carried out Mel-18 overexpression and Mel-18 knockdown studies in multiple cell types. Our results indicated that similar to MRC-5 fibroblasts, stable overexpression of Mel-18 results in Bmi-1 down-regulation in MCF10A and MCF7 cells (Figure 3A). We also examined the expression of c-Myc in Mel-18–overexpressing cells. Consistent with the published report (Tetsu et al., 1998), Mel-18 overexpression led to down-regulation of c-Myc in multiple cell types (Figures 1A and 3A).
Figure 3.
Mel-18 regulates Bmi-1 in human cells. (A) Stable expression of Mel-18 in MCF10A and MCF7 cells leads to down-regulation of Bmi-1 and c-Myc oncoprotein. Total cell lysate from indicated cells was analyzed by Western blot analysis using antibody against Bmi-1, Mel-18, c-Myc, and α-tubulin (loading control). (B) Transient overexpression of Mel-18 in 293T cells leads to the down-regulation of c-Myc and Bmi-1 in a dose-dependent manner. 293T cells were transiently transfected with increasing amounts pLPC-Mel-18, and 48 h after transfection total cell lysate was analyzed by Western blot analysis using antibody against Mel-18, Bmi-1, GFP (transfection control), and α-tubulin (loading control). (C) Stable knockdown of Mel-18 expression using the RNAi approach in MCF10A, WI-38, and BJ cells leads to up-regulation of c-Myc and Bmi-1 expression. MCF10A (left panel), WI-38 (middle panel), and BJ (right panel) cells were infected with pRS vector expressing either Mel-18 shRNA no. 1 (#1i), Mel-18 shRNA no. 2 (#2i), or an irrelevant control shRNA (Ctrl i), selected in puromycin and analyzed for the expression of Mel-18, c-Myc, and Bmi-1 by Western blot analysis.
To rule out the possibility of unknown genetic changes contributing to Bmi-1 down-regulation during selection of the stable expression of Mel-18, we also performed transient transfection assays in 293T cells. Increasing concentrations of transiently transfected Mel-18 resulted in a corresponding down-regulation of endogenous Bmi-1 and c-Myc in these cells (Figure 3B). The regulation of Bmi-1 by Mel-18 was further confirmed by the RNAi approach in multiple types of normal cells. MCF10A, MRC-5, WI-38, and BJ cells expressing two different Mel-18 shRNAs were generated. Western blot analysis of cells expressing Mel-18 shRNAs showed significant down-regulation of Mel-18 and up-regulation of Bmi-1 in these multiple cell types (Figures 1B and 3C). However, we notice that the knockdown effect of Mel-18 are more pronounced in MCF10A cells than in MRC-5 and WI-38 fibroblasts, suggesting that Mel-18 may more tightly regulate Bmi-1 in epithelial cell types. As expected, knockdown of Mel-18 also up-regulated c-Myc expression (Figure 3C). These results strongly suggest that Bmi-1 and c-Myc are physiological targets of Mel-18.
RING Finger of Mel-18 Is Required for the Down-Regulation of Bmi-1
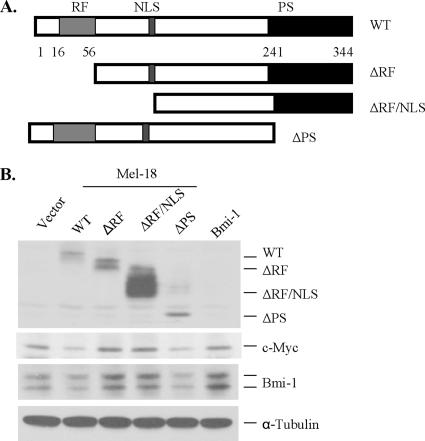
To identify the structural domain(s) of Mel-18 required for Bmi-1 down-regulation, we generated ΔRF (lacks RING finger domain), ΔRFNLS (lacks RING finger and nuclear localization signal), and ΔPS (lacks a PS region) mutants (Figure 4A). These mutants were stably overexpressed in MCF10A cells (Figure 4B). Next, we examined the expression of c-Myc and Bmi-1 in cells stably overexpressing wild type or different mutants of Mel-18. The results (Figure 4B) indicated that wild-type Mel-18 and the ΔPS mutant, both of which contained intact RING finger domain down-regulated Bmi-1 expression, suggesting that the RING finger domain of Mel-18 is required for down-regulation of Bmi-1. As expected, overexpression of wild type and the ΔPS mutant also led to c-Myc down-regulation. Interestingly, ΔRF and ΔRFNLS mutants of Mel-18 up-regulated Bmi-1 and c-Myc expression (Figure 4B).
Figure 4.
Structural analysis of Mel-18. (A) Schematic representation of mutants of Mel-18 depicting various domains. These mutants were generated by PCR and cloned in the pLPC retroviral vector. (B) Stable overexpression of wild type (WT) and the mutants of Mel-18 in MCF10A cells; WT and the PS mutant down-regulated Bmi-1 and c-Myc expression, whereas overexpression of ΔRF and ΔRFNLS mutants led to up-regulation of Bmi-1 and c-Myc. WT or mutants of Mel-18 were stably expressed using retroviral expression, and Bmi-1, c-Myc, Mel-18, and α-tubulin were detected by Western blot analysis as described in Materials and Methods.
Mel-18 Transcriptionally Down-Regulates Bmi-1 Gene Expression
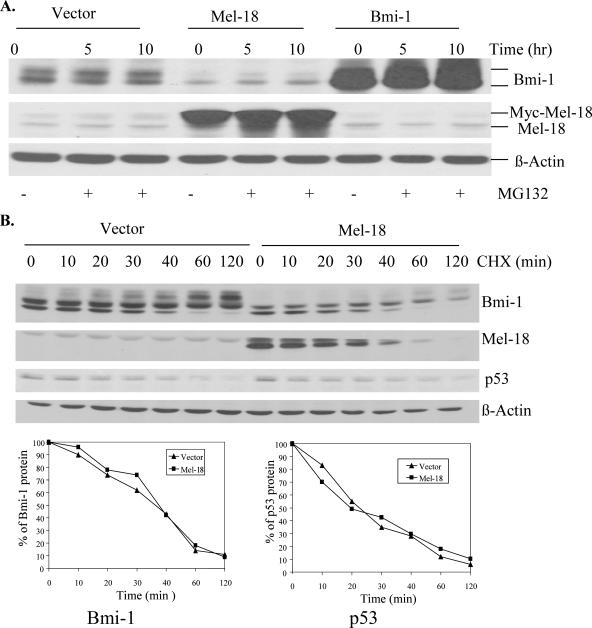
Next, we determined the mechanism of down-regulation of Bmi-1 by Mel-18. Because Mel-18 contains a RING finger domain, and RING finger proteins can function as an E3 ubiquitin ligase and promote protein degradation via proteosome pathway (Pickart, 2001), we hypothesized that Mel-18 may down-regulate Bmi-1 at the protein level. To examine this possibility, we subjected Mel-18–overexpressing and control cells to treatment with proteosome inhibitor MG-132 and determined Bmi-1 protein levels by Western blot analysis. The results indicated that MG-132 treatment did not significantly increase Bmi-1 protein levels, suggesting that Mel-18 does not regulate Bmi-1 by promoting its degradation via proteosomal pathway (Figure 5A).
Figure 5.
Mel-18 does not regulate Bmi-1 protein level. (A) Treatment with MG132, a proteosome inhibitor does not restore Bmi-1 expression in Mel-18–overexpressing cells. Control, Mel-18– and Bmi-1–overexpressing cells were treated with 10 μM MG132 for the indicted time period and analyzed by Western blot analysis for the expression of Bmi-1, Mel-18, and α-tubulin as described in Figure 1. (B) Bmi-1 half-life is similar in control and Mel-18–overexpressing cells. Vector control and Mel-18–overexpressing cells were treated with 100 μg/ml cyclohexamide (CHX) for the indicated amounts of time and analyzed for the expression of Bmi-1, Mel-18, p53, and β-actin. The percent remaining Bmi-1 (bottom left panel) or p53 (bottom right panel) protein was calculated by densitometry of the Bmi-1 signal present in different lanes and by normalizing it with the β-actin control signal present in the corresponding lanes. Only the lower band of Bmi-1 Western analysis, which clearly showed time-dependent degradation, was used to calculate half-life of Bmi-1.
To further confirm the above result, we determined the half-life of Bmi-1 and p53 proteins in control and Mel-18–overexpressing cells using CHX treatment (Figure 5B). The p53 protein was used as a control, which is known to have a short half-life of 20–25 min in these cells. We did not find any significant difference in the half-life of Bmi-1 in control and Mel-18–overexpressing cells, further indicating that Bmi-1 is not regulated at the protein level by Mel-18 (Figure 5B). As expected, p53 half-life in vector and Mel-18–overexpressing cells was ∼20 min (Figure 5B). Because CHX treatment leads to the generation of multiple bands of Bmi-1, which appear to have different half-lives, we confirmed the half-life of newly synthesized Bmi-1 by a pulse-chase IP experiment (Supplementary Figure 3). The results indicated that Bmi-1 has a half-life of ∼30 min in both vector control and Mel-18–overexpressing cells. Collectively, these data indicate that Mel-18 does not significantly alter Bmi-1 protein stability.
Because Mel-18 did not appear to regulate Bmi-1 expression via protein stability, we determined whether Mel-18 could regulate the transcription of the Bmi-1 gene. To examine this possibility, we first performed a QRT-PCR to determine the mRNA levels of Bmi-1 and c-Myc in control and Mel-18–overexpressing MCF 10A and MCF7 cells. Our data indicated that Mel-18 down-regulates both Bmi-1 and c-Myc at the mRNA level (Figure 6A). Using QRT-PCR, we also determined whether knockdown of Mel-18 up-regulates mRNA levels of Bmi-1 and c-Myc in MCF10A cells. Our data indicated that knockdown of Mel-18 expression indeed leads to up-regulation of c-Myc and Bmi-1 at the mRNA level (Figure 6B). Thus, our results suggest that Mel-18 possibly regulates transcription of Bmi-1, perhaps via down-regulation of c-Myc at the mRNA level.
Figure 6.
Mel-18 regulates mRNA levels of c-Myc and Bmi-1 as determined by QRT-PCR analysis. (A) The mRNA levels of Bmi-1 and c-Myc in Mel-18–overexpressing and control MCF10A and MCF7 cells were quantified by QRT-PCR and normalized to GAPDH mRNA levels as described in Materials and Methods. (B) Using QRT-PCR assay, the mRNA levels of c-Myc and Bmi-1 were quantified and normalized to GAPDH mRNA levels in control (Ctrl RNAi) and Mel-18 knockdown cells (Mel-18 i no. 1 and Mel-18 i no. 2). The QRT-PCR assays were performed in triplicates.
Mel-18 and c-Myc Regulate Bmi-1 Transcription via the c-Myc Binding Site Present in Its Promoter
To examine the possibility of Mel-18 regulating Bmi-1 transcription, we analyzed 400 base pairs of 5′ untranslated region (UTR) containing the Bmi-1 promoter. The analysis of binding sites for various transcription factors was done using TFSEARCH, version 1.3 (www.cbrc.jp/research/db/TFSEARCH.html). This analysis showed that the Bmi-1 promoter is a GC-rich promoter without a well-defined TATA sequence and that it contains numerous potential SP-1 binding sites (Supplementary Figure 4). We did not find any potential binding sites (GACTNGACT) for Mel-18. However, the sequence analysis showed the presence of a perfect E-box sequence (CACGTG), which is a potential binding site for the Myc family of transcription factors (Adhikary and Eilers, 2005). The importance of Myc binding sites in the Bmi-1 promoter was further underscored by the fact that this site is also present in the mouse Bmi-1 promoter (data not shown).
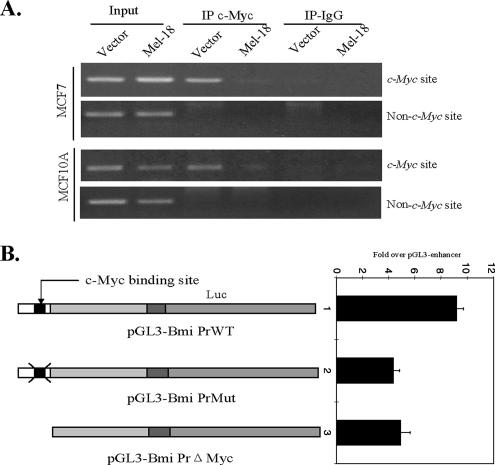
To determine if Bmi-1 is regulated by c-Myc via the E-box present in the Bmi-1 promoter, we first performed ChIP assay using vector control and Mel-18–overexpressing MCF7 and MCF10A cells. The cross-linked chromatin was immunoprecipitated (IPed) using a rabbit polyclonal Ab against c-Myc and the control rabbit IgG, and the PCR was performed using primers (c-Myc primer set) that flank c-Myc binding sites in the Bmi-1 promoter. A primer set derived from further upstream sequences that does not flank the c-Myc binding site was used as a control primer set. The results indicated that c-Myc primer set was specifically able to amplify the PCR product of an expected size (200 base pairs) from the vector control cells (Figure 7A). The yield of the PCR product was much less in Mel-18–overexpressing cells, indicating the down-regulation of c-Myc in Mel-18–overexpressing cells (Figure 7A). The control primer set using c-Myc and IgG IPed extracts did not yield any PCR product indicating the specificity of binding of c-Myc to the E-box present in the Bmi-1 promoter (Figure 7A).
Figure 7.
c-Myc binds to the Bmi-1 promoter and regulates its activity. (A) c-Myc binds to the E-box sequences in the Bmi-1 promoter as shown by the ChIP analysis. The ChIP analysis was performed using vector control or Mel-18–overexpressing MCF10A and MCF7 cells as indicated. The cell lysates were IPed using c-Myc antibody or control IgG and a primer set that either amplifies the c-Myc binding flanking region in the Bmi-1 promoter (c-Myc site) or a region further upstream that does not contain a c-Myc binding site (Non-Myc site). (B) Detailed analysis of Bmi-1 promoter activity. The pGL-Bmi PrWT, pGL-Bmi PrMut, and pGL-Bmi PrΔMyc reporters (described in the text) were analyzed for the luciferase activity in 293T cells by transient transfection as described in Materials and Methods.
We further cloned the E-box region (150 base pairs) of the Bmi-1 promoter in the pLuc vector (Stratagene), which contains a minimal promoter and studied c-Myc regulation of the reconstituted promoter (pLuc-Myc). The results strongly indicated that the E-box present in the Bmi-1 promoter is functional. Transient cotransfection of c-Myc increased the activity of the reconstituted promoter, whereas knockdown of c-Myc using a c-Myc shRNA resulted in inhibition of pLuc-Myc promoter activity (Supplementary Figure 5).
Next, three different Bmi-1 promoter-reporter constructs based on the pGL3 vector were generated (Figure 7B). pGL3-Bmi PrWT contained the +45 to −233 region of the Bmi-1 promoter and untranslated region of Bmi-1 mRNA. The second construct pGL3-Bmi PrMut contained a mutation in the Myc binding sequences (CACGTG changed to CGCGTG). The third construct pGL3-Bmi PrΔMyc contained a complete deletion of the c-Myc binding site. We determined the luciferase activity driven by wild-type or mutant promoters. The results indicated that wild-type promoter displays robust promoter activity, whereas the mutant promoters exhibited 50% less activity than the wild-type promoter (Figure 7B).
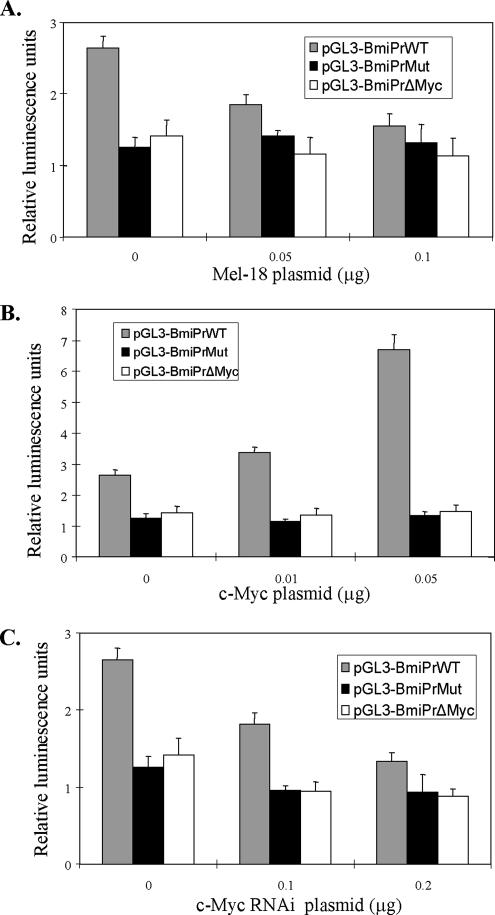
We further studied the regulation of the Bmi-1 promoter by c-Myc and Mel-18 (Figure 8, A–C). The promoter-reporter constructs were cotransfected with increasing amounts of Mel-18–overexpressing plasmid (Figure 8A), c-Myc overexpressing plasmid (Figure 8B), or a plasmid expressing c-Myc shRNA (Figure 8C). Analysis of the luciferase activity of these promoter-reporter constructs suggested that Mel-18 negatively regulates the Bmi-1 promoter through the c-Myc binding site, because the promoter that lacked the E-box or contained mutant c-Myc binding site did not respond to increasing concentrations of the Mel-18 expressing plasmid (Figure 8A). Furthermore, the transient cotransfection of c-Myc–overexpressing plasmid led to the up-regulation of activity of wild-type but not mutant promoters (Figure 8B). Similarly, knockdown of c-Myc expression by transfection of a plasmid expressing c-Myc shRNA down-regulated Bmi-1 promoter activity of the promoter that contained the wild-type c-Myc binding site (Figure 8C).
Figure 8.
Mel-18 and c-Myc regulate Bmi-1 promoter activity. (A) Overexpression of Mel-18 down-regulates only the wild-type Bmi-1 promoter. pGL3-Bmi-1 PrWT, pGL3-Bmi-1PrMut, and pGL3- Bmi-1PrΔMyc plasmids were transiently transfected into 293T cells together with an increasing amount of Mel-18–overexpressing plasmid (pLPC-Mel-18) and a plasmid expressing renilla luciferase. Forty-eight hours after transfection luciferase activity was determined as described in Materials and Methods. (B) Transient overexpression of c-Myc up-regulates wild-type Bmi-1 promoter activity through the c-Myc binding site. Different promoter-reporter constructs (as indicated) were transiently transfected into 293T cells with an increasing amount of pCMV-Myc expression plasmid together with a plasmid expressing renilla luciferase, and luciferase activity was determined as described in Materials and Methods. (C) c-Myc knockdown using transient transfection of a plasmid containing c-Myc shRNA down-regulates activity of the Bmi-1 promoter, which contains an intact c-Myc binding site. The promoter activity of various promoter-reporter constructs with the increasing amount of a plasmid expressing c-Myc shRNA was analyzed in 293T cells as described in Materials and Methods.
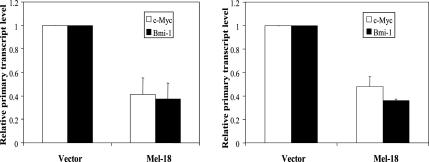
Our promoter-reporter analysis suggested that c-Myc positively regulates the expression of Bmi-1 and that Mel-18 negatively regulates Bmi-1 expression via repression of c-Myc. To further confirm these results, we performed a real-time PT RT-PCR assay, which accurately determines the regulation of a particular gene in its native state at the level of primary transcription (Murray, 2005). Our data indicated that Mel-18 indeed down-regulates Bmi-1 and c-Myc at the level of primary transcription (Figure 9).
Figure 9.
Mel-18 regulates c-Myc and Bmi-1 transcription. Quantitative PT RT-PCR analysis of primary transcripts of c-Myc and Bmi-1 in control and Mel-18–overexpressing MCF7 (left panel) and MCF10A cells (right panel). PT RT-PCR analysis was performed in triplicate as described in Materials and Methods.
Although our data indicate that Mel-18 and c-Myc regulate the expression of the Bmi-1 promoter via the E-box and Mel-18 acts via c-Myc repression, it is possible that Mel-18 directly binds to the E-box binding site and represses Bmi-1 promoter activity independent of c-Myc. To exclude this possibility, we performed ChIP assay using Mel-18 antibody. Because the E-box region is sufficient for Mel-18–mediated regulation of the Bmi-1 promoter, PCR primers in this region were chosen for the ChIP assay. Our results (Supplementary Figure 7) indicate that Mel-18 does not bind to the E-box present in the promoter region of Bmi-1; hence, Mel-18 does not directly regulate Bmi-1 expression. On the other hand, c-Myc was clearly able to bind the E-box as determined by ChIP assay (Figure 7A and Supplementary Figure 6).
Bmi-1 Is a Bona Fide Target of c-Myc, and c-Myc Overexpression Rescues Mel-18–mediated Repression of Bmi-1 Expression
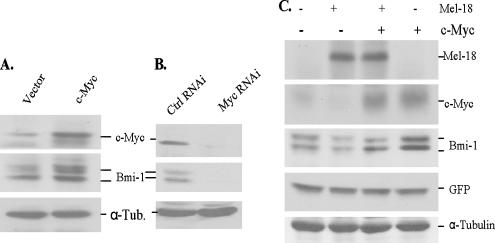
To further confirm that the endogenous promoter of Bmi-1 is regulated by c-Myc, we studied the expression of Bmi-1 in MCF10A cells, which stably overexpress c-Myc under a retroviral promoter (Figure 10A), and in MCF10A cells where the expression of c-Myc was stably knockdown by the RNAi approach (Figure 10B). Our data suggest that the stable overexpression of c-Myc results in up-regulation of Bmi-1 expression (Figure 10B). Accordingly, we also found that knockdown of c-Myc expression using the RNAi approach results in a substantial down-regulation of endogenous Bmi-1 expression (Figure 10B).
Figure 10.
c-Myc regulates endogenous Bmi-1 expression and transient expression of c-Myc in Mel-18–overexpressing cells restores Bmi-1 expression. (A) Stable overexpression of c-Myc leads to Bmi-1 up-regulation. MCF10A cells were infected with a c-Myc expressing retrovirus (pLNCX2-Myc), selected in G418, and the expression of c-Myc, Bmi-1, and α-tubulin was determined by Western blot analysis. (B) Knockdown of c-Myc expression by RNAi approach leads to down-regulation of endogenous Bmi-1. MCF10A cells expressing c-Myc shRNA (Myc RNAi) or a control shRNA (Ctrl. RNAi) were generated and analyzed for the expression of c-Myc, Bmi-1, and α-tubulin by Western blot analysis. (C) Restoration of c-Myc in Mel-18–overexpressing cells by its transient overexpression leads to the reversal of Bmi-1 repression by Mel-18. 293T cells were transfected with either Mel-18, c-Myc, or both and a GFP expressing plasmid. The total cell lysate from each set was analyzed for the expression of Mel-18, c-Myc, Bmi-1, GFP, and α-tubulin by Western blot analysis.
Next, we carried out a c-Myc rescue experiment. Because Mel-18 represses c-Myc expression by binding to its native promoter, we reasoned that c-Myc overexpression using a heterologous promoter should rescue Bmi-1 repression caused by Mel-18 overexpression. To test this hypothesis, we transiently transfected pLPC-Mel-18 together with pCMV-Myc. Our results indicated that indeed c-Myc overexpression using the CMV promoter rescues Mel-18–mediated repression of endogenous Bmi-1 (Figure 10C). Thus, our data strongly suggest that Mel-18 down-regulates Bmi-1 expression at the transcriptional level via c-Myc repression and that c-Myc acts as a positive regulator of Bmi-1 expression.
DISCUSSION
Various PcG proteins form higher order complexes such as PRC1 and PRC2 in cells (Ringrose and Paro, 2004). These complexes are thought to regulate expression of target genes such as members of the Hox family (Ringrose and Paro, 2004). When over- or underexpressed, individual polycomb proteins such as Bmi-1 can also regulate expression of specific target genes that are involved in proliferation and senescence. Virtually nothing is known about the regulation of the expression of various PcG proteins. Here, we report a novel observation that Bmi-1 is specifically regulated by another PcG protein Mel-18.
Our novel observation suggests that Mel-18 is an upstream negative regulator of Bmi-1 function, which promotes proliferation, oncogenesis, and stem “cell-ness.” Consistent with such an observation, Bmi-1 knockdown by RNAi as well as its down-regulation by Mel-18 overexpression in cells resulted in accelerated senescence. As senescence constitutes a tumor suppressor mechanism and is regulated by various tumor suppressors (Dimri, 2005), our results clearly place Mel-18 in the tumor suppressor category. It is known that various tumor suppressors are either up-regulated (for example, p16) or the physiological activity of tumor suppressors is up-regulated during senescence (Dimri, 2005). For example, DNA binding activity of p53 is up-regulated, and there is a relative increase in hypophosphorylated pRb compared with hyperphosphorylated pRb during senescence (Dimri, 2005). Forced expression of p16, p14ARF, and other tumor suppressors has been shown to accelerate senescence in human cells (Dimri, 2005). Consistent with these properties of tumor suppressors, we found that Mel-18 is up-regulated during senescence in human fibroblasts, which contributes to down-regulation of c-Myc and Bmi-1 oncoproteins. Accelerated senescence in Mel-18–overexpressing fibroblasts is accompanied by down-regulation of Bmi-1, robust p16 up-regulation, and an increase in hypophosphorylated pRb.
In contrast to wild-type Mel-18, RING finger mutants up-regulate Bmi-1, suggesting potential dominant negative activity (DN) of these mutants. RING finger mutants may bind to the promoter of presumptive target(s), which may be Bmi-1 itself or the other target(s) that regulate Bmi-1, and inhibit the function of nuclear Mel-18. However, if this was the case, ΔRFNLS should not have exhibited a DN activity because it lacks the nuclear localization signal. We speculate that RING finger mutants may simply up-regulate Bmi-1 by inhibiting the function of endogenous Mel-18, by binding it and sequestering it in the cytoplasm. Detailed mechanism of Bmi-1 up-regulation by RING mutants remains to be studied.
Although, Mel-18 can regulate its target genes by binding to the promoter regions, the Bmi-1 promoter does not contain presumptive Mel-18 binding sequences. However, it remains possible that Mel-18 regulates Bmi-1 expression by repressing a positive regulator of Bmi-1. Indeed, we found that the Bmi-1 promoter contains an E-box to which a positive or negative regulator of Bmi-1 can bind. Identification of an E-box in the Bmi-1 promoter is very intriguing from an oncogenesis point of view. A number of E-box binding proteins are known, some of which act as repressors, whereas others act as activators of transcription. The c-Myc family of transcription factors, which bind to the E-box, are clearly implicated in oncogenesis. The c-Myc oncogene is amplified and/or overexpressed in a variety of malignancies (see Myc Cancer Gene web site: http://www.myccancergene.org). It acts as a transcription factor and regulates the expression of a number of genes (Zeller et al., 2003; Adhikary and Eilers, 2005). However, it is still unclear what the cancer-relevant bona fide targets of c-Myc are. Here, we identified Bmi-1 oncogene as an important target of c-Myc oncoprotein. Similar to our results, a very recent report has also implicated c-Myc in regulation of Bmi-1 expression and induction of telomere-independent senescence by reduced c-Myc levels and a consequent increase in p16 (Guney et al., 2006).
c-Myc oncoprotein dimerizes with Max, which is usually in excess. Myc-Max complexes positively regulate expression of Myc target genes. Myc and Max also dimerizes with Mad1, Mxi-1, Mad3, Mad4, and Mnt (Adhikary and Eilers, 2005). Heterodimers of these proteins also bind to the E-box and often negatively regulate the expression of the target genes. It is very likely that Bmi-1 is negatively regulated by Max-Mad and Mnt-Max complexes. Thus, our studies suggest that c-Myc and other E-box binding proteins may positively or negatively regulate Bmi-1, which in turn regulates proliferation, senescence, oncogenesis, and stem cell-ness. Besides E-box binding proteins, other transcription factors may also regulate the expression of Bmi-1. Indeed, a recent report suggests that E2F 1 also regulates Bmi-1 expression (Nowak et al., 2006). Moreover, we did not find any positive correlation between Bmi-1 and c-Myc expression during quiescence, suggesting that under quiescence condition, transcription factors other than c-Myc regulate the expression of Bmi-1. Such regulators of Bmi-1 remain to be identified.
Our studies suggest that Mel-18 is a physiological regulator of Bmi-1 expression in human fibroblasts and mammary epithelial cells. On the basis of our data, we suspect that this inverse correlation between Bmi-1 and Mel-18 expression may persist with other cell types and various cancers. Indeed, our preliminary data suggest a strong negative correlation between Bmi-1 and Mel-18 expression in a significant number of breast tumors. It has been suggested that Bmi-1 may be a cancer stem cell marker (Lessard and Sauvageau, 2003; Glinsky et al., 2005); it will be interesting to explore whether Mel-18 down-regulation in certain specific cell types makes them susceptible to cancer stem cell conversion.
In summary, our studies suggest that the Mel-18-c-Myc-Bmi-1-p16-pRb pathway regulates cellular senescence and proliferation in human cells. Additionally, Mel-18 and Bmi-1 can also regulate p14ARF expression, which may contribute to the regulation of proliferation and senescence via p53-independent mechanisms. Although there has already been considerable interest in c-Myc, p16, p14ARF, and pRb, our data suggest that PcG protein Mel-18 and Bmi-1 are also valid targets for cancer therapy. For example, restoration of Mel-18 expression or ablation of Bmi-1 expression in tumors by various therapeutic approaches might help in cancer treatment. Lastly, because stem cell defect has been linked to various age-related pathologies (reviewed in Ho et al., 2005; Rosenthal, 2005), we speculate that Mel-18 may play an important role in the development of age-related ailments by virtue of down-regulating Bmi-1, a known regulator of stem cell-ness.
ACKNOWLEDGMENTS
We thank Dr. J. Campisi and Dr. M. van Lohuizen for the gift of reagents used in this study. We thank Dr. J. Campisi and the members of G.D.'s laboratory for helpful comments. We also thank Dr. C. Barry for help in performing real-time PCR analysis and Prashant Bommi for providing technical assistance. This work was supported by the grants from the National Cancer Institute (RO1CA 094150) and the US Department of Defense (DAMD17-02-1-0509) to G.D.
Footnotes
This article was published online ahead of print in MBC in Press (http://www.molbiolcell.org/cgi/doi/10.1091/mbc.E06-05-0447) on December 6, 2006.
 The online version of this article contains supplemental material at MBC Online (http://www.molbiolcell.org).
REFERENCES
- Adhikary S., Eilers M. Transcriptional regulation and transformation by Myc proteins. Nat. Rev. Mol. Cell Biol. 2005;6:635–645. doi: 10.1038/nrm1703. [DOI] [PubMed] [Google Scholar]
- Akasaka T., van Lohuizen M., van der Lugt N., Mizutani-Koseki Y., Kanno M., Taniguchi M., Vidal M., Alkema M., Berns A., Koseki H. Mice doubly deficient for the Polycomb Group genes Mel18 and Bmi1 reveal synergy and requirement for maintenance but not initiation of Hox gene expression. Development. 2001;128:1587–1597. doi: 10.1242/dev.128.9.1587. [DOI] [PubMed] [Google Scholar]
- Alkema M. J., Bronk M., Verhoeven E., Otte A., van't Veer L. J., Berns A., van Lohuizen M. Identification of Bmi1-interacting proteins as constituents of a multimeric mammalian polycomb complex. Genes Dev. 1997;11:226–240. doi: 10.1101/gad.11.2.226. [DOI] [PubMed] [Google Scholar]
- Boyer S. N., Wazer D. E., Band V. E7 protein of human papilloma virus-16 induces degradation of retinoblastoma protein through the ubiquitin-proteosome pathway. Caner Res. 1996;56:4620–4624. [PubMed] [Google Scholar]
- Bracken A. P., Pasini D., Capra M., Prosperini E., Colli E., Helin K. EZH2 is downstream of the pRB-E2F pathway, essential for proliferation and amplified in cancer. EMBO J. 2003;22:5323–5335. doi: 10.1093/emboj/cdg542. [DOI] [PMC free article] [PubMed] [Google Scholar]
- Bruggeman S. W., et al. Ink4a and Arf differentially affect cell proliferation and neural stem cell self-renewal in Bmi1-deficient mice. Genes Dev. 2005;19:1438–1443. doi: 10.1101/gad.1299305. [DOI] [PMC free article] [PubMed] [Google Scholar]
- Campisi J. Senescent cells, tumor suppression, and organismal aging: good citizens, bad neighbors. Cell. 2005;120:513–522. doi: 10.1016/j.cell.2005.02.003. [DOI] [PubMed] [Google Scholar]
- Cao R., Tsukada Y., Zhang Y. Role of Bmi-1 and Ring1A in H2A ubiquitylation and Hox gene silencing. Mol. Cell. 2005;20:845–854. doi: 10.1016/j.molcel.2005.12.002. [DOI] [PubMed] [Google Scholar]
- Dimri G. P. What has senescence got to do with cancer? Cancer Cell. 2005;7:505–512. doi: 10.1016/j.ccr.2005.05.025. [DOI] [PMC free article] [PubMed] [Google Scholar]
- Dimri G. P., Itahana K., Acosta M., Campisi J. Regulation of a senescence checkpoint response by the E2F1 transcription factor and p14(ARF) tumor suppressor. Mol. Cell. Biol. 2000;20:273–285. doi: 10.1128/mcb.20.1.273-285.2000. [DOI] [PMC free article] [PubMed] [Google Scholar]
- Dimri G. P., et al. A biomarker that identifies senescent human cells in culture and in aging skin in vivo. Proc. Natl. Acad. Sci. USA. 1995;92:9363–9367. doi: 10.1073/pnas.92.20.9363. [DOI] [PMC free article] [PubMed] [Google Scholar]
- Dimri G. P., Martinez J. L., Jacobs J. J., Keblusek P., Itahana K., van Lohuizen M., Campisi J., Wazer D. E., Band V. The Bmi-1 oncogene induces telomerase activity and immortalizes human mammary epithelial cells. Cancer Res. 2002;62:4736–4745. [PubMed] [Google Scholar]
- Gil J., Bernard D., Peters G. Role of polycomb group proteins in stem cell self-renewal and cancer. DNA Cell Biol. 2005;24:117–125. doi: 10.1089/dna.2005.24.117. [DOI] [PubMed] [Google Scholar]
- Glinsky G. V., Berezovska O., Glinskii A. B. Microarray analysis identifies a death-from-cancer signature predicting therapy failure in patients with multiple types of cancer. J. Clin. Invest. 2005;115:1503–1521. doi: 10.1172/JCI23412. [DOI] [PMC free article] [PubMed] [Google Scholar]
- Guney I., Wu S., Sedivy J. M. Reduced c-Myc signaling triggers telomere-independent senescence by regulating Bmi-1 and p16INK4a. Proc. Natl. Acad. Sci. USA. 2006;103:3645–3650. doi: 10.1073/pnas.0600069103. [DOI] [PMC free article] [PubMed] [Google Scholar]
- Ho A. D., Wagner W., Mahlknecht U. Stem cells and ageing. The potential of stem cells to overcome age-related deteriorations of the body in regenerative medicine. EMBO Rep. Jul. 2005:S35–S38. doi: 10.1038/sj.embor.7400436. 6 Spec No. [DOI] [PMC free article] [PubMed] [Google Scholar]
- Ishida A., Asano H., Hasegawa M., Koseki H., Ono T., Yoshida M. C., Taniguchi M., Kanno M. Cloning and chromosome mapping of the human Mel-18 gene which encodes a DNA-binding protein with a new ‘RING-finger’ motif. Gene. 1993;129:249–255. doi: 10.1016/0378-1119(93)90275-8. [DOI] [PubMed] [Google Scholar]
- Itahana K., Campisi J., Dimri G. P. Mechanisms of cellular senescence in human and mouse cells. Biogerontology. 2004;5:1–10. doi: 10.1023/b:bgen.0000017682.96395.10. [DOI] [PubMed] [Google Scholar]
- Itahana K., Zou Y., Itahana Y., Martinez J.-L., Beausejour C., Jacobs J.J.L., van Lohuizen M., Band V., Campisi J., Dimri G. P. Control of the replicative life span of human fibroblasts by p16 and the polycomb protein Bmi-1. Mol. Cell. Biol. 2003;23:389–401. doi: 10.1128/MCB.23.1.389-401.2003. [DOI] [PMC free article] [PubMed] [Google Scholar]
- Iwama A., et al. Enhanced self-renewal of hematopoietic stem cells mediated by the polycomb gene product Bmi-1. Immunity. 2004;21:843–851. doi: 10.1016/j.immuni.2004.11.004. [DOI] [PubMed] [Google Scholar]
- Jacobs J.J.L., Kieboom K., Marino S., DePinho R. A., van Lohuizen M. The oncogene and polycomb-group gene bmi-1 regulates cell proliferation and senescence through the ink4a locus. Nature. 1999;397:164–168. doi: 10.1038/16476. [DOI] [PubMed] [Google Scholar]
- Kajiume T., Ninomiya Y., Ishihara H., Kanno R., Kanno M. Polycomb group gene mel-18 modulates the self-renewal activity and cell cycle status of hematopoietic stem cells. Exp. Hematol. 2004;32:571–578. doi: 10.1016/j.exphem.2004.03.001. [DOI] [PubMed] [Google Scholar]
- Kanno M., Hasegawa M., Ishida A., Isono K., Taniguchi M. mel-18, a Polycomb group-related mammalian gene, encodes a transcriptional negative regulator with tumor suppressive activity. EMBO J. 1995;14:5672–5678. doi: 10.1002/j.1460-2075.1995.tb00254.x. [DOI] [PMC free article] [PubMed] [Google Scholar]
- Kim J. H., Yoon S. Y., Jeong S. H., Kim S. Y., Moon S. K., Joo J. H., Lee Y., Choe I. S., Kim J. W. Overexpression of Bmi-1 oncoprotein correlates with axillary lymph node metastases in invasive ductal breast cancer. Breast. 2004;13:383–388. doi: 10.1016/j.breast.2004.02.010. [DOI] [PubMed] [Google Scholar]
- Kleer C. G., et al. EZH2 is a marker of aggressive breast cancer and promotes neoplastic transformation of breast epithelial cells. Proc. Natl. Acad. Sci. USA. 2003;100:11606–11611. doi: 10.1073/pnas.1933744100. [DOI] [PMC free article] [PubMed] [Google Scholar]
- Lessard J., Sauvageau G. Bmi-1 determines the proliferative capacity of normal and leukemic stem cells. Nature. 2003;423:255–260. doi: 10.1038/nature01572. [DOI] [PubMed] [Google Scholar]
- Liu S., Dontu G., Mantle I. D., Patel S., Ahn N. S., Jackson K. W., Suri P., Wicha M. S. Hedgehog signaling and Bmi-1 regulate self-renewal of normal and malignant human mammary stem cells. Cancer Res. 2006;66:6063–6071. doi: 10.1158/0008-5472.CAN-06-0054. [DOI] [PMC free article] [PubMed] [Google Scholar]
- Molofsky A. V., He S., Bydon M., Morrison S. J., Pardal R. Bmi-1 promotes neural stem cell self-renewal and neural development but not mouse growth and survival by repressing the p16Ink4a and p19Arf senescence pathways. Genes Dev. 2005;19:1432–1437. doi: 10.1101/gad.1299505. [DOI] [PMC free article] [PubMed] [Google Scholar]
- Molofsky A. V., Pardal R., Iwashita T., Park I. K., Clarke M. F., Morrison S. J. Bmi-1 dependence distinguishes neural stem cell self-renewal from progenitor proliferation. Nature. 2003;425:962–967. doi: 10.1038/nature02060. [DOI] [PMC free article] [PubMed] [Google Scholar]
- Murray P. J. The primary mechanism of the IL-10-regulated antiinflammatory response is to selectively inhibit transcription. Proc. Natl. Acad. Sci. USA. 2005;102:8686–8691. doi: 10.1073/pnas.0500419102. [DOI] [PMC free article] [PubMed] [Google Scholar]
- Nowak K., Kerl K., Fehr D., Kramps C., Gessner C., Killmer K., Samans B., Berwanger B., Christiansen H., Lutz W. BMI1 is a target gene of E2F-1 and is strongly expressed in primary neuroblastomas. Nucleic Acids Res. 2006;34:1745–1754. doi: 10.1093/nar/gkl119. [DOI] [PMC free article] [PubMed] [Google Scholar]
- Park I.-K., Qian D., Kiel M., Becker M., Pihalja M., Weissman I. L., Morrison S. J., Clarke M. Bmi-1 is required for the maintenance of adult self-renewing hematopoietic stem cells. Nature. 2003;423:302–305. doi: 10.1038/nature01587. [DOI] [PubMed] [Google Scholar]
- Pickart C. M. Mechanisms underlying ubiquitination. Annu. Rev. Biochem. 2001;70:503–533. doi: 10.1146/annurev.biochem.70.1.503. [DOI] [PubMed] [Google Scholar]
- Ringrose L., Paro R. Epigenetic regulation of cellular memory by the Polycomb and Trithorax group proteins. Annu. Rev. Genet. 2004;38:413–443. doi: 10.1146/annurev.genet.38.072902.091907. [DOI] [PubMed] [Google Scholar]
- Rosenthal N. Youthful prospects for human stem-cell therapy. In another few decades, revised attitudes toward stem cells could lead to disease prevention and life extension. EMBO Rep. Jul. 2005:S30–S34. doi: 10.1038/sj.embor.7400427. 6 Spec No. [DOI] [PMC free article] [PubMed] [Google Scholar]
- Sherr C. J., Bertwistle D., Den Bestn W., Kuo M. L., Sugimoto M., Tago K., Williams R. T., Zindy F., Roussel M. F. p53-Dependent and -independent functions of the Arf tumor suppressor. Cold Spring Harb. Symp. Quant. Biol. 2005;70:129–137. doi: 10.1101/sqb.2005.70.004. [DOI] [PubMed] [Google Scholar]
- Sun L. Q., Lee D. W., Zhang Q., Xiao W., Raabe E. H., Meeker A., Miao D., Huso D. L., Arceci R. J. Growth retardation and premature aging phenotypes in mice with disruption of the SNF2-like gene, PASG. Genes Dev. 2004;18:1035–1046. doi: 10.1101/gad.1176104. [DOI] [PMC free article] [PubMed] [Google Scholar]
- Tetsu O., Ishihara H., Kanno R., Kamiyasu M., Inoue H., Tokuhisa T., Taniguchi M., Kanno M. mel-18 negatively regulates cell cycle progression upon B cell antigen receptor stimulation through a cascade leading to c-myc/cdc25. Immunity. 1998;9:439–448. doi: 10.1016/s1074-7613(00)80627-5. [DOI] [PubMed] [Google Scholar]
- Valk-Lingbeek M. E., Bruggeman S. W., van Lohuizen M. Stem cells and cancer: the polycomb connection. Cell. 2004;118:409–418. doi: 10.1016/j.cell.2004.08.005. [DOI] [PubMed] [Google Scholar]
- Varambally S., et al. The polycomb group protein EZH2 is involved in progression of prostate cancer. Nature. 2002;419:624–629. doi: 10.1038/nature01075. [DOI] [PubMed] [Google Scholar]
- Waters C. M., Littlewood T. D., Hancock D. C., Moore J. P., Evan G. I. c-myc protein expression in untransformed fibroblasts. Oncogene. 1991;6:797–805. [PubMed] [Google Scholar]
- Zeller K. I., Jegga A. G., Aronow B. J., O'Donnell K. A., Dang C. V. An integrated database of genes responsive to the Myc oncogenic transcription factor: identification of direct genomic targets. Genome Biol. 2003;4:R69. doi: 10.1186/gb-2003-4-10-r69. [DOI] [PMC free article] [PubMed] [Google Scholar]


