

Abstract
Mitochondria generate ATP and participate in signal transduction and cellular pathology and/or cell death. TCDD (2,3,7,8-tetrachlorodibenzo-p-dioxin) decreases hepatic ATP levels and generates mitochondrial oxidative DNA damage, which is exacerbated by increasing mitochondrial glutathione redox state and by inner-membrane hyperpolarization. This study identifies mitochondrial targets of TCDD that initiate and sustain reactive oxygen production and decreased ATP levels. One week after treating mice with TCDD, liver ubiquinone (Q) levels were significantly decreased, while rates of succinoxidase and Q-cytochrome c oxidoreductase activities were increased. However, the expected increase in Q reduction state following TCDD treatment did not occur; instead, Q was more oxidized. These results could be explained by an ATP synthase defect, a premise supported by the unusual finding that TCDD lowers ATP/O ratios without concomitant changes in respiratory control ratios. Such results suggest either a futile cycle in ATP synthesis, or hydrolysis of newly-synthesized ATP prior to release. The TCDD-mediated decrease in Q, concomitant with an increase in respiration, increases complex 3 redox-cycling. This acts in concert with glutathione to increase membrane potential and reactive oxygen production. The proposed defect in ATP synthase explains both the greater respiratory rates and the lower tissue ATP levels.
Keywords: ATP, complex 3, energy coupling, F0F1-ATP synthase, mouse liver, mitochondria, oxidative stress, reactive oxygen, redox-cycling, respiration, TCDD, ubiquinone, UCP2
Abbreviations: COX - Cytochrome c oxidase; G6P - Glucose-6-phosphate; HMG-CoA - 3-hydroxy-3-methylglutaryl-CoA; ISP - Iron sulfur protein; KPi - 0.1 M potassium phosphate buffer- pH 7.25; KCl-RB - Potassium chloride respiratory buffer; Q - Ubiquinone (Coenzymes Q9 and Q10); QCR - Ubiquinol cytochrome c reductase; RCR - Respiratory control ratio; SCR - Succinate cytochrome c reductase; SDH - Succinate dehydrogenase; SOX - Succinoxidase; Succinate-dependent oxygen consumption; SQR - Succinate ubiquinol reductase; TCDD - 2,3,7,8-Tetrachlorodibenzo-p-dioxin
Introduction
All living cells conduct reduction-oxidation (redox) activities that are essential to cellular function. Many such processes, such as mitochondrial respiration, mono-oxygenase and oxidase activities, activate molecular oxygen by chemical reduction, forming reactive oxygen. Rapid or chronic production of reactive oxygen can overwhelm antioxidant defenses, leading to oxidative stress-related processes that may contribute to the development of aging, as well as several diseases, including cardiovascular disease, neurodegenerative disorders, alcohol-related diseases, and cancer (Ames et al., 1993; Cadenas et al., 2000). Mitochondria are the major source of reactive oxygen in most mammalian cell types, as well as a major target organelle for oxidative damage (Chance et al., 1979; Chomyn et al., 2003). It has been estimated that 1–2% of oxygen consumed systemically is converted to reactive oxygen by mitochondria (Cadenas and Davies, 2000). Mitochondrial superoxide and H2O2 can cause direct damage to mitochondrial proteins (Lenaz, 1998), result in nuclear and mitochondrial genotoxicity (Shen et al., 2005; Richter, 1995; Esposito et al., 1999), and initiate apoptosis (Bossy-Wetzel et al., 1999;Polster et al., 2004; Gulbins et al., 2003). In addition to mediating cytotoxicity, reactive oxygen also alters cellular signal transduction, involving homeostatic growth factors and cytokines that can modify the cell cycle and regulate mitosis (Sundaresan et al., 1995; Lo et al., 1996).
Since mitochondrial reactive oxygen is involved in regulating pathologic and homeostatic cellular events, it is important to understand the pathways involved in the generation of mitochondrial reactive oxygen under normal and pathological conditions, and during exposure to environmental chemicals, including the environmental toxicant 2,3,7,8-tetrachlorodibenzo-p-dioxin (TCDD). TCDD is a persistent and ubiquitous environmental contaminant and toxicant (Grassman et al., 1998). TCDD is also a very potent tumor promoter in mice, about 10,000 times more potent than the commonly studied tumor promoter 12-O-tetradecanoylphorbol-13-acetate (TPA) (Poland et al., 1982). Like TPA, TCDD generates reactive oxygen which may be important to its action as a tumor promoter. Most biological activities of TPA and TCDD are signaled through gene regulation involving DNA response elements, the TPA response element (TRE) and the aryl hydrocarbon receptor response element (AHRE), respectively.
We have previously shown that TCDD elicits sustained hepatic oxidative conditions that require several days to develop and persist for at least 8 weeks following a low dose administration of TCDD (Shertzer et al., 1998; Senft et al., 2002a). Reactive oxygen production is dependent on the AHR but not on the AHR monooxygenase target genes, Cyp1a1 and Cyp1a2 (Senft et al., 2002b). Although TCDD increases microsomal reactive oxygen production (Shertzer et al., 2004b; Shertzer et al., 2004a), reactive oxygen derived from mitochondria (Senft et al., 2002a; Senft et al., 2002b) appears to be more biologically relevant, since TCDD induces preferential oxidative damage to mitochondrial DNA over nuclear DNA (Shen et al., 2005). In response to TCDD-induced oxidative stress, reduced glutathione (GSH) levels increase in both cytosol and mitochondria (Senft et al., 2002a; Senft et al., 2002b; Shen et al., 2005). GSH functions as an efficient one-electron and two-electron radical scavenger (Dalton et al., 2004), and in addition reduces H2O2 to water via glutathione peroxidase (GPX). The de novo synthesis of GSH is regulated by glutamate cysteine ligase (Gcl), a gene under the control of electrophile response elements (Dalton et al., 2004). The scavenging and metabolic functions of GSH are especially important in mitochondria which contain GPX1, since catalase, which also degrades H2O2, is absent in the mitochondria of most animal cells (Esworthy et al., 1997). Thus, higher levels of mitochondrial GSH would result in less H2O2 release to the cytosol.
In addition to simply elevating levels of GSH, TCDD also produces an increase in the chemical reduction state of glutathione, as measured by the GSSG/2GSH redox couple (Shen et al., 2005). Manipulation of this redox couple in isolated mitochondria increased reactive oxygen production proportional to the increase in reduction potential. The GSSG/2GSH-driven increase in reactive oxygen production by TCDD appeared to be driven by mitochondrial membrane hyperpolarization under ADP-limited state 4 conditions. It therefore appeared that TCDD initiated a positive feedback loop, where the additional reactive oxygen produced by TCDD could be explained by the change in chemical reduction potential of GSSG/2GSH and the resulting membrane hyperpolarization, and the increase in GSH could be explained by the TCDD-induced production of reactive oxygen. The argument is circular, and it remains to be determined how TCDD initiates and sustains this cycle of events.
In order to answer this question, we examined our previous observations that TCDD treatment lowered hepatic levels of ATP, and increased the consumption of O2 in respiratory states 3 and 4 (Senft et al., 2002a; Senft et al., 2002b; Shen et al., 2005). This paper presents new findings regarding alterations in complex 3 and in F0F1-ATPase (ATP synthase) that allow us to explain the changes in respiration and ATP levels, in the context of TCDD-mediated reactive oxygen production. A comprehensive model is proposed which is consistent with known results regarding the changes in liver mitochondria by TCDD.
Methods
Chemicals
TCDD was purchased from Accustandard (New Haven, CT). All other chemicals and reagents were obtained from Sigma-Aldrich Chemical Company (St. Louis, MO) as the highest available grades.
Animals and treatment
Experiments involving mice were performed according to the National Institutes of Health standards for care and use of experimental animals and the University of Cincinnati Institutional Animal Care and Use Committee. Animals were group-housed, maintained on a 12-h light/dark cycle, and had access to standard rodent chow and water ad libitum. C57BL/6J inbred male mice (8–12 weeks of age) were purchased from The Jackson Laboratories (Bar Harbor, ME).
Mice were administered a single dose of TCDD (5 μg/kg body weight) in corn oil by intraperitoneal injection; controls were given equivalent volumes of corn oil. At 7 days following treatment, the mice were killed by carbon dioxide asphyxiation. The liver was excised and washed in ice-cold 0.9% NaCl. A 10% whole homogenate was prepared in 250 mM sucrose, 1 mM EDTA, and 1 mM EGTA, 0.1% defatted and recrystallized bovine serum albumin, 10 mM HEPES, pH 7.2, using a motor-driven (500 rpm) Potter-Elvehjem homogenizer. A mitochondrial fraction was prepared as described previously (Senft et al., 2002b), and suspended in a potassium chloride respiratory buffer (KCl-RB), consisting of 140 mM KCl, 0.1 mM EDTA, 2.5 mM KH2PO4, 2.5 mM MgCl2 and 0.05% bovine serum albumin, in 5 mM HEPES, pH 7.4.
Mitochondrial respiration and energy coupling
Mitochondrial oxygen consumption was measured polarographically with a computer-controlled Clark-type oxygen electrode (Hansatech Instruments; Norfolk, England). The respiratory mixture consisting of 0.5 ml of KCl-RB, 20 mM glucose, 100 U hexokinase and 100 μg of mitochondrial protein was equilibrated at 37°C with stirring. Succinate-stimulated state 4 respiration (ADP-limited) was determined after adding 6 mM succinate. The rate of state 3 respiration was then determined following the addition of 0.25 mM ADP. The respiratory control ratio (RCR) was calculated as the ratio of state 3 to state 4 respiration. In order to determine ATP synthesis, a 400 μl aliquot of respiratory mixture was mixed with 400 μl ethanol containing 15 μl concentrated formic acid. After centrifugation, the supernatants were dried under a stream of argon gas. ATP production was determined as glucose-6-phosphate (G6P) generated in the respiratory mixture by the ATP-dependent hexokinase reaction. Following the G6P-dependent reduction of NADP+ by G6P dehydrogenase, NADPH was quantified using a luciferase-based luminescence assay (Jungling et al., 1996). Standards for G6P were produced by adding known amounts of ATP directly to the respiratory mixture.
Reactive oxygen assays
H2O2 production was monitored in freshly-prepared mitochondria as catalase-inhibited luminol (5-amino-2,3-dihydro-1,4-phthalazinedione) chemiluminescence (Senft et al., 2002a; Senft et al., 2002b). The reaction mixture consisted of 5 μM luminol, 2.5 U/ml horseradish peroxidase, 50 μg of mitochondrial protein and KCl-RB, in a final volume of 1.0 ml, and the reaction was initiated by the addition of 6 mM sodium succinate, and monitored at 37°C. The H2O2 luminescence signal was completely quenched by 500 U catalase/ml.
Mitochondrial membrane potential and membrane fluidity
The mitochondrial inner membrane potential was quantified using the cationic lipophilic dye JC-1 (5,5’,6,6’-tetrachloro-1,1’,3,3’-tetraethylbenzimidazolylcarbocyanine iodide) (Reers et al., 1995; Cossarizza et al., 1993). Mitochondrial protein (10 μg) was incubated with 0.05 nmol JC-1 in 1.0 ml KCl-RB. Fluorescence ratios were determined at 37°C, using our experimentally determined wavelength pairs, as the ratio of red (Ex = 488 nm; Em = 595 minus 620 nm) to green fluorescence (Ex = 488 nm; Em = 535 minus 510 nm). The fluorescence ratios were standardized to membrane potential by applying known concentration gradients of potassium in the presence of valinomycin across the membrane and applying the Nernst equation to calculate potassium diffusion potentials, as previously described (Shen et al., 2005).
The fluorescence probes 1,6-diphenyl-1,3,5-hexatriene (DPH) and 1-(4-trimethylammoniumphenyl)-6-phenyl- 1,3,5-hexatriene p-toluenesulfonate (TMA-DPH) were used to probe membrane fluidity at the interior and surface of mitochondrial membranes, respectively (Azzi, 1974; Shinitzky et al., 1978). Briefly, 1 μM final probe concentration was added to 1 mg mitochondrial protein/ml, and fluorescence intensity measurements were determined at 25°C with excitation (357 nm) and emission (428 nm) polarization filters in the parallel and perpendicular orientations. Fluorescence polarization anisotropy was calculated as an r value (Shertzer et al., 1991), where lower values correspond to greater membrane fluidity.
Western blot for UCP2
Western blot analysis for uncoupling protein-2 (UCP2) was performed by separating 40 μg of mitochondrial protein on a denaturing 10% polyacrylamide gel and transferring proteins to nitrocellulose. After verification of equivalent loading using Ponceau S, the membrane was blocked with 3% bovine serum albumin in 10 mM phosphate buffer (pH 7.4) containing 0.9% saline and 0.1% Tween 20 (PBST). Primary anti-UCP2 antibody (Alpha Diagnostic International, San Antonio, TX) was applied at 1:500 dilution in PBST at 4°C overnight. After washes in PBST, horseradish peroxidase-conjugated anti-rabbit secondary was applied at a dilution of 1:1000 for 30 min at room temperature. After PBST washes, the membrane was incubated in enhanced chemiluminescence reagent (ECL; Amersham) and exposed to x-ray film.
Ubiquinones
Reduced and oxidized Q9 (ubiquinol 9/ubiquinone 9; coenzyme Q9) and Q10 (ubiquinol 10/ubiquinone 10; coenzyme Q10) were extracted and quantified by a modification of the described HPLC procedure (Takada et al., 1984; Takada, 1989). A freshly prepared mitochondrial suspension (2.5 mg in 500 μl) was extracted with 3.5 ml of ethanol:hexane (2:5), which had been flushed with argon. After centrifuging at 1000g for 3 min, the upper hexane layer was transferred to a clean borosilicate glass test tube. The extraction was repeated three times, flushing with argon after each extraction, and the combined hexane layer was dried under a stream of argon. The resulting residue was dissolved in 100 μl of argon-flushed ethanol for HPLC analysis. A Waters 3.9 mm X 150 mm (4 Å) NovaPak C18 reverse phase column was used with isocratic conditions with solvents A:B (40:60). Solvent A was 95% methanol. Solvent B was ethanol:methanol:water:trifluoroacetic acid (55:40:4.9:0.1). The detection wavelength was 283 nm, a wavelength that yields about 85% maximal absorbance for both reduced Q9 and reduced Q10. The sample injection volume was 30 μl with a solvent flow rate of 1.0 ml/min. Chemically reduced Q9 and Q10 standards were produced by treating oxidized Q with NaBH4 (Takada, 1989). The time from preparation of mitochondria to completion of HPLC was under 6 h.
Other assays
Cytochrome c oxidase (COX) (Schneider et al., 1972), succinic dehydrogenase (SDH) (Ackrell et al., 1978), and ubiquinol-cytochrome c reductase (QCR) (Gutierrez-Cirlos et al., 2002) were assayed as described. Succinate-cytochrome c reductase (SCR) was measured in 20 mM Tris-SO4 buffer (pH 7.5) containing 10 μM ferricytochrome c, 0.5 mM KCN and 150 μg mitochondrial protein. The reaction was initiated by the addition of 40 mM sodium succinate, maintained at 37°C, monitored at 550 nm, and quantified using EM550 nm = 18,500 M−1cm−1 (Trumpower et al., 1979). Succinate-ubiquinol reductase (SQR) was assayed under conditions similar to SCR, but without cytochrome c in the reaction buffer. After adding succinate, the reaction was monitored at 283 nm. The experimentally-determined extinction coefficient, assuming equal reduction of Q9 and Q10 is EM283 nm = 10,400 M−1cm−1. Protein was measured by the bicinchoninic acid method (Pierce Chemical Co.; Rockford, IL), according to details provided by the manufacturer.
Statistics
Statistical significance of the differences between group sample mean values were determined as indicated in the legends to the tables and figures. Statistics were performed using SigmaStat Statistical Analysis software (SPSS Inc., Chicago, IL).
Biohazard precaution
TCDD is highly toxic and a likely human carcinogen. All personnel were instructed in safe handling procedures. Lab coats, gloves and masks were worn at all times, and contaminated materials were collected separately for disposal by the Hazardous Waste Unit or by independent contractors. TCDD-treated mice were housed separately, and their carcasses were treated as contaminated biological materials.
Results
We showed previously that mitochondria isolated from livers of mice exposed to low dosages of TCDD showed an increase in succinate-generated mitochondrial membrane potential, an effect apparently exacerbated by GSH-mediated closure of the mitochondrial permeability transition pore (MPTP) (Shen et al., 2005). We have not previously considered the likely possibility that a decrease in uncoupling protein 2 (UCP2, the sole UCP in liver), or modified UCP2 function, might contribute to the increased membrane potential following TCDD exposure. The Western immunoblots (Fig. 1) do not show differences in levels of UCP2 protein between mice treated with TCDD and vehicle control mice. We also determined the functional activity of UCP2 on H2O2 production and membrane potential (parameters of UCP2 function). We found that the UCP2 allosteric fatty acid activator oleic acid decreased H2O2 production and membrane potential in a dose-dependent manner in mitochondria from both control and from TCDD-treated mice (Fig. 1). In addition, the UCP2 allosteric nucleotide phosphate inhibitor GDP increased H2O2 production and membrane potential in a dose-dependent manner in mitochondria from both control and from TCDD-treated mice. A two-way ANOVA revealed that treatment with TCDD modified H2O2 production and membrane potential in a manner that was dependent on the concentration of oleate (in the absence of GDP), but not dependent on the concentration of GDP (in the absence of oleate). That is, there was a statistically significant interaction between TCDD and oleate, at the P<0.001 level. Such results should be expected, since the hyperpolarized mitochondrial membrane generated by TCDD would be depolarized by oleate, which in turn would minimize the ability of mitochondria to generate H2O2. A three-way ANOVA was then used to evaluate the combined effects of oleate (0, 25, 50, and 200 μM) and GDP (0, 25, 50, and 200 μM) on the effects of TCDD treatment on H2O2 production and membrane potential (data shown in part in Fig. 1). The results showed that the level of GDP did not alter the effect of TCDD on H2O2 production or membrane potential at any level of oleate. Stating this in mechanistic terms, the ability of oleate to increase membrane permeability (open the permeability transition pore and uncouple) is dominant over the ability of GDP to decrease membrane permeability (closing the permeability transition pore), both with and without TCDD treatment. We conclude that there are no major changes in the amount of protein or the allosteric regulation of UCP2 in TCDD-treated mice.
Fig. 1. UCP2 expression and function.

Mitochondria were prepared from mouse liver, 7 days after treatment with corn oil (open circles) or TCDD (closed circles). A Western immunoblot using a UCP2 antibody was performed using mitochondrial protein from 3 corn oil-treated mice (the left 3 blots) and from 3 TCDD-treated mice (the right 3 blots). The influence of effectors of UCP2 on H2O2 production was estimated using luminol chemiluminescence (center row, expressed as luminescence units X 10−3 min−1mg−1). The fatty acid oleate activates UCP2, while the purine nucleotide GDP inhibits. The influence of effectors of UCP2 on mitochondrial membrane potential was determined using JC-1 fluorescence ratios (lower row). A fluorescence ratio of 4 is approximately the equivalent of –180 mV.
Data are presented as the mean value ± S.E. (n = 3). Data were evaluated statistically using a two-way ANOVA, with the factors being TCDD and GDP concentration (left panels), and TCDD and oleate concentration (right panels). A three-way ANOVA was also performed and discussed in the Results section, with factors being oleate concentration, GDP concentration and TCDD treatment.
*P<0.05 versus 0 μM oleate (left panels), and versus 0 μM GDP (right panels), using Student-Newman-Keuls test for pairwise comparison.
We next began experiments designed to explain how TCDD increased respiration and decreased ATP synthesis, in the context of the increase in reactive oxygen production. We have reported previously the absence of major changes in cytochromes b, c+c1 or a+a3 following TCDD exposure (Senft et al., 2002a). In order to localize the site(s) responsible for TCDD-stimulated increased succinate-dependent respiration activity, we assayed activities of specific regions within succinoxidase (SOX, complexes 2, 3 and 4). We assayed activities of succinic dehydrogenase (SDH, complex 2), succinate ubiquinol reductase (SQR, complex 2), succinate-cytochrome c reductase (SCR, complexes 2 and 3), ubiquinone cytochrome c reductase (QCR, complex 3), and cytochrome c oxidase (COX, complex 4). While SDH and SQR activities were not changed by TCDD treatment, and COX was slightly decreased, SCR and QCR activities were higher, suggesting that complex 3 is rate limiting for state 4 succinate-dependent respiration (Fig 2).
Fig. 2. Mitochondrial enzyme activities after TCDD treatment.

Electron transport activities for different regions of the respiratory chain were determined in liver mitochondria prepared from corn oil-treated (open bars) or TCDD-treated (closed bars) mice. Activities are expressed as nmol min−1 mg protein−1 for SOX (succinoxidase), SCR (succinate cytochrome c reductase), SDH (succinate dehydrogenase), SQR (succinate ubiquinol reductase) and QCR (ubiquinol cytochrome c reductase). Activity is expressed as a first order rate constant [s−1 mg protein−1] for COX (cytochrome oxidase). Data are presented as the mean value ± S.E. (n = 6). A t-test was used to evaluate statistical significance of differences between group sample mean values.
*P<0.05 versus vehicle-treated mice.
A major component of complex 3 is ubiquinol/ubiquinone (Q; 2,3-dimethoxy-5-methyl-6-polyprenyl-1,4-benzoquininone), where the polyprenylated side chain is about 85% 9 units long (Q9) in rodents, with the rest 10 units long (Q10) (Huertas et al., 1991). Since Q is involved in both respiration via the proton-motive Q cycle, and reactive oxygen production via redox-cycling, we assayed for mitochondrial levels of reduced and oxidized Q9 and Q10. We found that the concentrations of both forms of Q to be substantially diminished in liver mitochondria following TCDD treatment (Fig. 3). If Q9 and Q10 were a homogeneous pool, then the reduction states for both forms should be similar, and a diminution of Q levels should increase the reduction state of Q. This was not the case. First, Q9 and Q10 had very different reduction states, with Q9 being primarily oxidized and Q10 primarily reduced. The greater reduction state of Q10 over Q9 has been observed previously (Takada et al., 1984), although to a lesser extent. Second, Q9 and Q10 behaved as separate pools, with Q10 essentially unchanged in reduction state, while Q9 was significantly less reduced following TCDD treatment.
Fig. 3. Effects of TCDD treatment on mitochondrial ubiquinones Q9 and Q10.

Liver mitochondria were prepared from corn oil-treated (open bars) or TCDD-treated (closed bars) mice. The levels of mitochondrial oxidized and reduced Q9 and Q10 were determined by HPLC (left panel), and the percent reduced Q (right panel) were calculated. Data are presented as the mean value ± S.E. (n = 6). A t-test was used to evaluate statistical significance of differences between group sample mean values.
*P<0.05 versus vehicle-treated mice.
Although lower levels of Q in association with greater oxygen consumption would produce higher rates of Q redox-cycling and higher levels of reactive oxygen production, the forces driving the increase in respiration under both state 3 and state 4 conditions remained obscure. We speculated that Q could cycle more rapidly if Q diffusion rate within the mitochondrial membrane were to increase, such as in an environment of greater membrane fluidity. Such fluidity changes would be expected under conditions of reactive oxygen production and resulting lipid peroxidation that would decrease the chain length of fatty acyl moieties. Fig. 4 shows that TCDD treatment leads to an increase in membrane fluidity (decrease in fluorescence polarization anisotropy, or r value), both in the more hydrophobic interior (using the fluorescence probe DPH), as well as at the membrane surface (using the fluorescence probe TMA-DPH). A greater increase in fluidity occurred at the membrane surface, which would be expected as a result of greater exposure of the membrane surface to reactive oxygen.
Fig. 4. Effect of TCDD treatment on mitochondrial membrane fluidity.

Mitochondria were prepared from mouse liver 7 days after treatment with corn oil (open bars) or TCDD (closed bars). Mitochondrial membrane fluidity was calculated as the fluorescence polarization anisotropy, determined using the fluorescence probes 1,6-diphenyl-1,3,5-hexatriene (DPH) and 1-(4-trimethylammoniumphenyl)-6-phenyl- 1,3,5-hexatriene p-toluenesulfonate (TMA-DPH), to probe the hydrophobic lipid interior, and the membrane surface, respectively. Data are presented as the mean value ± S.E. (n = 6). A t-test was used to evaluate statistical significance of differences between group sample mean values.
*P<0.05 versus vehicle-treated mice.
Although an increase in membrane fluidity would be sufficient to stimulate respiration, it could not explain an increase in Q oxidation state. We reasoned that Q could redox cycle more rapidly and also increase in oxidation state, if a site rate-limiting for respiration were to be relieved downstream. Since the rate constant for COX decreases following TCDD treatment, it is not likely that COX activity changes could explain the increase in respiration and the increase in Q oxidation state. We therefore considered a second candidate site, the F0F1-ATP synthase, complex 5. Under state 4 conditions, complex 5 is the major rate-limiting factor in respiration, and even under state 3 conditions, respiratory uncouplers such as carbonyl cyanide 4-(trifluoromethoxy)phenylhydrazone (FCCP) or calcium stimulate O2 consumption. It should be remembered that states 4 and 3 represent extreme conditions of external ADP deficiency and saturation, respectively. In vivo, mitochondria spend most of their time somewhere between the two extremes.
We examined the possibility of a defect in complex 5 under state 3 (not ADP-limited) conditions (Table 1). The rate of ATP production in mitochondria from TCDD-treated mice was about 60% of control rates, while mitochondrial O2 consumption nearly doubled. As a result, TCDD treatment generated ATP/O ratios that were only a third of control values. The resulting deficit in mitochondrial ATP production is consistent with a tissue phenotype of significantly diminished levels of ATP (Table 1). It should be noted that when limiting amounts of ADP were added to state 4 (ADP-limited) mitochondria from either control or TCDD-treated mice, there was no burst of increased respiration, and following the utilization of ADP in state 3, mitochondria returned to state 4 respiratory rates. Such a result indicates that the F0F1-ATP synthase was not simply catalyzing a rapid futile cycle of ATP synthesis and hydrolysis, supported by trace levels of adenine nucleotides.
Table 1.
Parameters related to mitochondrial ATP production (state 3 conditions).
| Animal treatment | ||
|---|---|---|
| Parameter | Corn oil | TCDD |
| H2O2 production | 57 ± 12 | 37 ± 18 |
| O2 utilization | 324 ± 27 | 586 ± 45* |
| RCR | 4.3 ± 0.4 | 3.9 ± 0.5 |
| Membrane potential | 1.7 ± 0.2 | 1.6 ± 0.1 |
| ATP production | 469 ± 37 | 281.3 ± 18* |
| ATP/O ratio | 1.45 ± 0.15 | 0.48 ± 0.11* |
| Hepatic ATP | 6.2 ± 0.4 | 3.4 ± 0.3* |
Liver mitochondria were prepared one week after treating male C57BL/6J mice with one dose of TCDD (5 μg/kg) or with corn oil vehicle. The units are: H2O2 production, pmol min−1 mg protein−1; O2 utilization, nmol min−1 mg protein−1; RCR (respiratory control ratio), unitless; Membrane potential (JC-1 fluorescence ratio), unitless; ATP production, nmol min−1 mg protein−1; Hepatic ATP, nmol mg tissue−1.
Data are presented as mean values ± S.E. (n = 6). A t-test was used to evaluate data.
P<0.05 versus vehicle-treated mice.
Under state 3 conditions, H2O2 production is low as expected (Table 1), since the membrane potential is at a low steady-state level, with positive pressure due to proton translocation linked to electron transport, and proton-motive force collapse due to proton flux through complex 5 linked to ATP synthesis. The extreme dependence of H2O2 production on membrane potential is shown in Fig. 5. As mitochondria become more uncoupled, H2O2 production decreases much more rapidly than RCR or membrane potential, such that a reduction in state 4 succinate-dependent membrane potential by 50% nearly abolishes the production of H2O2.
Fig. 5. Relationship between mitochondrial respiration, membrane potential and H2O2 production.

Mitochondria were partially uncoupled by exposure to increasing concentrations of free Ca++. The concentration of free Ca++ was controlled using EGTA buffer in respiratory buffer (KCl-RB), and free Ca++ was calculated assuming a Ca++-EGTA Kd = 327 nM.
Data were evaluated statistically using two-way ANOVAs, with the factors being [Ca++] and JC-1 fluorescence, and [Ca++] and RCR.
*P<0.05 versus either JC-1 fluorescence or RCR at the same [Ca++], using Student-Newman-Keuls test for pairwise comparison.
We (Senft et al., 2002a) and others (Nohl et al., 1989) have shown that high concentrations of TCDD, in the range of 1000 pmol TCDD/mg mitochondrial protein, can affect respiration directly. We therefore further examined the potential for TCDD to have a direct effect in lowering ATP/O ratios. At a low concentration of 100 pmol/mg protein, TCDD stimulated respiration, but did not alter the RCR (Table 2). However, ATP synthesis was significantly decreased by TCDD, with a resulting decrease in the ATP/O ratio to less than half the control value. At a high concentration of 1000 pmol/mg protein, TCDD inhibited respiration, but did not affect the RCR. ATP production was more severely inhibited than at the low concentration of TCDD, due presumably to inhibition of respiration at the level of complex 3 (Senft et al., 2002a; Nohl et al., 1989). Clearly, different mechanisms are in play at low or at high concentrations of TCDD. We do not consider the results obtained using the high concentration as toxicologically relevant, and focus the discussion on the results obtained using the lower concentration.
Table 2.
Direct effect of TCDD on the function of liver mitochondria from untreated mice.
| pmol TCDD/mg mitochondrial protein | |||
|---|---|---|---|
| Parameter | 0 | 100 | 1000 |
| state 4 respiration | 82 ± 15 | 146 ± 12* | 48 ± 13* |
| state 3 respiration | 303 ± 25 | 572 ± 41* | 187 ± 21* |
| RCR | 3.70 ± 0.4 | 3.92 ± 0.5 | 3.9 ± 0.4 |
| ATP production | 436 ± 38 | 381 ± 34 | 114 ± 13* |
| ATP/O ratio | 1.44 ± 0.16 | 0.67 ± 0.08* | 0.61 ± 0.09* |
Mitochondria were prepared from C57BL/6J untreated mice. To 0.6 ml KCl-RB containing 0.2 mg mitochondrial protein was added 2 μl DMSO or TCDD in DMSO at a concentration of 10 or 100 μM (to produce final concentrations of 0, 100, or 1000 pmol TCDD/mg mitochondrial protein, respectively). The units are: Respiratory rates, nmol min−1 mg protein−1; ATP production, nmol min−1 mg protein−1.
Data are presented as mean values ± S.E. (n = 6). Data were analyzed by a one-way ANOVA, followed by the Student-Newman-Kuels test for pair-wise comparison of means.
P<0.05 versus vehicle-treated mice.
Discussion
One week after TCDD treatment of mice, a number of hepatic alterations are observed, including a decrease in tissue ATP, and increases in mitochondrial succinate-dependent respiration, reactive oxygen production, GSH levels and membrane potential (Shertzer et al., 1998; Senft et al., 2002a; Senft et al., 2002b; Shen et al., 2005). The mitochondrial electrochemical membrane potential is generated primarily via proton separation across the inner membrane at coupling sites in complexes 1, 3 and 4. We previously showed that in mice treated with 5 μg TCDD/kg body weight (the same dosage used in the present study), TCDD generates an increase in mitochondrial reactive oxygen production and membrane potential though a mechanism involving an elevated reduction state of glutathione. GSH then prevents mitochondrial permeability transition pore (MPTP) opening and diminishes MPTP flicker (Shen et al., 2005). Most importantly, TCDD generated 2-fold and 4-fold increases in formamidopyrimidine DNA N-glycosylase (FPG)-sensitive cleavage sites in hepatic nuclear and mitochondrial DNA, respectively (Shen et al., 2005). These results suggest strongly that TCDD not only increases the production of reactive oxygen, but actually generates an oxidative stress response, in that the antioxidant defense systems of the cell have been sufficiently overwhelmed to allow oxidative DNA damage.
Besides the MPTP, a major pathway for regulating membrane potential involves mitochondrial uncoupling proteins (UCPs). Although UCP2 is expressed in almost all tissues (Tu et al., 1999; Yamada et al., 1998), it is the major UCP expressed in liver, where levels can be modified by physiological conditions and inducing agents (Grav et al., 2003; Ribeiro et al., 2004). In addition, UCP2 is regulated allosterically by metabolic intermediates, including fatty acid activators such as oleate, and the purine nucleotide inhibitors such as GDP (Jaburek et al., 1999). Since UCP2 has been shown to be induced under conditions of oxidative stress (Pecqueur et al., 2001), it was a surprise to find that TCDD did not alter the expression levels of UCP2 protein. Neither did TCDD modify the inhibition by oleate or stimulation by GDP on either mitochondrial membrane potential or the succinate-dependent production of H2O2. Thus, UCP2 is not of major importance in the TCDD-induced mitochondrial oxidative stress response. The lack of UCP2 induction under oxidative stress conditions may be the result of the increased mitochondrial thiol reduction state (Shen et al., 2005), which may serve to suppress transcriptional activation of UCP2.
Since the TCDD-induced mitochondrial membrane hyperpolarization is not relieved through UCP2 or the MPTP, then thermodynamic considerations predict an increase in the energy required to generate a proton electrochemical gradient. This would increase the reduction state of components of complex 3, thereby increasing redox-cycling and reactive oxygen production (Senft et al., 2002b). Contrary to these expectations, we found that hepatic mitochondrial Q was in a lower reduction state following TCDD treatment. It was important to explain this finding in relationship to our previously reported TCDD-mediated increase in oxygen consumption without a change in RCR (Senft et al., 2002a; Senft et al., 2002b).
This study showed that by adding TCDD to liver mitochondria from untreated mice, we could produce a respiratory phenotype similar to that observed in mitochondria from TCDD-treated mice. Thus, TCDD may have a direct effect in vivo in uncoupling respiration from net ATP synthesis, by generating a futile cycle at the level of F1. Although this is uncoupling in the truest sense of the term (Skulachev, 1998), the RCR is not changed by TCDD. RCR is often used as an indicator of the degree of mitochondrial coupling; in fact, it is only valid to the extent that it represents the dependency of respiration on the presence of ADP. It does not necessarily, however, represent the dependency of respiration on ATP synthesis and release. Our data shows that following TCDD treatment, respiration remains dependent on ADP (no change in RCR), but ATP synthesis sharply decreases (decrease ATP/O ratio). A precedent for such effects may occur with the inhibitor BMS-199264, which inhibits ATP hydrolysis without affecting ATP synthesis (Grover et al., 2004). BMS-199264 is a 5-ring heterocycle with some structural resemblance to TCDD. The direct effect of TCDD in decreasing ATP/O ratio without a change in RCR may be explained by a direct interaction of TCDD within complex 5, specifically with the β subunit of the mitochondrial F0F1-ATPase (ATP synthase) (Papa et al., 2000), or with inhibitor protein IF-1 that is bound to the β subunit (Ichikawa et al., 2005). The current notion of ATP synthesis at the inner membrane involves a highly hydrophobic proton channel (F0) that binds a proton-driven rotor, OSCP and several other proteins (Devenish et al., 2000), which in turn rotates within the α and β subunits of F1 (Papa et al., 2000). The β subunits are the sites of ATP synthesis, and can exist in 3, or possibly 4, major configurations, depending on its orientation relative to the rotating shaft (Fig. 6) (Bianchet et al., 2000). Since there is no change in RCR, the dependency of respiration on ADP is unchanged by TCDD, suggesting that TCDD is not acting on the open configuration or the loose (ADP + Pi)-binding configuration. TCDD, a highly hydrophobic molecule, is proposed to act at the level of the nucleotide tight-binding site, which is shielded from the medium. There the effective ATP concentration is low, and ADP + Pi concentrations are high, resulting in ATP formation, driven by a negative free energy of formation due to a low mass action ratio of [ATP][H2O]/[ADP][Pi]. TCDD may change the conformation of the tight-binding site, such that shielding from the medium is less complete and the mass action ratio increases to make the free energy of ATP formation less negative. Such a situation would reduce the probability of ATP formation with each turn of the rotating shaft, such that net ATP formation is reduced, but not eliminated.
Fig. 6. Models for proposed electron transfer and F0F1-ATP synthase pathways.
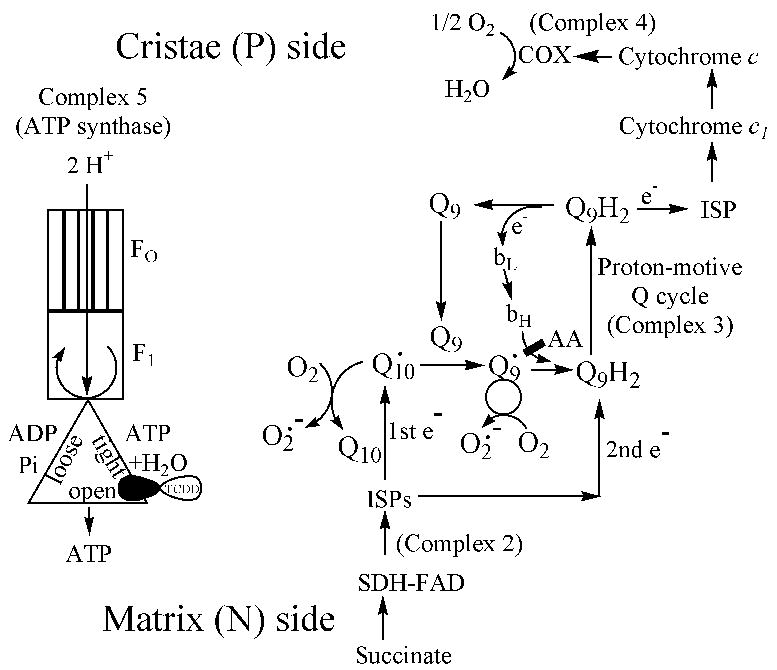
TCDD is proposed to decrease the efficiency of ATP formation catalyzed by the β subunit of F1 within the F0F1-ATP synthase complex. Respiration would still depend on ADP, and RCR would remain unchanged. However, ATP/O ratio would decrease due to uncoupling. Electrons from complex 2 feed into complex 3, primarily utilizing Q10, from which electrons flow to Q9 and enter the proton-motive Q cycle. An oxidation state crossover point exists within complex 3, somewhere between Q10 and Q9.
Abbreviations: AA, antimycin-A; bL and bH, respectively, low energy and high energy forms of cytochrome b; ISPs, iron-sulfur proteins; SDH, succinate dehydrogenase.
An alternative mechanism to explain the decrease in ATP/O ratio observed in liver mitochondria from TCDD-treated mice is a decrease in the number of protons pumped per O consumed. The argument against this mechanism is the expectation that a decrease in protons pumped per O would result in a lower membrane potential under state 3 conditions, whereas we observed no change in membrane potential. Therefore, we consider this a viable but minor contributing mechanism. Another possible mechanism for the decrease in ATP/O ratios is a rapid futile cycling of ATP synthesis and hydrolysis, catalyzed by F0F1-ATP synthase and supported by trace levels of adenine nucleotides. If this were the case, then it would be expected that trace or limiting amounts of ADP added to mitochondria under state 4 conditions would produce a burst of increased respiration, and mitochondria would not return to state 4 respiration following the depletion of ADP. In fact, neither of these events occurred.
A second striking data set resulting from these studies is effects of TCDD on liver mitochondrial Q. Although Q9 and Q10 are both decreased in concentration following TCDD treatment, Q9 appears to exhibit a greater degree of decrease, as well as a diminution in chemical reduction state. Q10 does not show such a decrease in chemical reduction state following TCDD treatment, but is present at a much higher level of chemical reduction than is Q9. These data suggest that Q9 and Q10 are distinct, yet probably overlapping, functional pools of Q in the mitochondria.
Q appears to have multiple functions in the mitochondrial inner membrane. Q is the only lipid-soluble chain-breaking antioxidant that is synthesized endogenously, being formed from intermediates in the cholesterol metabolic pathway (James et al., 2004; Genova et al., 2003). Q also has antiapoptotic properties, but these seem to be independent of its ability to act as an antioxidant (Papucci et al., 2003). Most importantly in the context of the current study, Q is an integral component of respiration as a major constituent in the proton-motive Q cycle (Mitchell, 1975). Furthermore, Q is involved in regulating the MPTP by preventing MPTP opening, since it was shown in a recent study that Q10 is able to counteract mitochondrial membrane depolarization, ATP depletion, cytochrome c release, caspase-9 activation and DNA fragmentation, in keratinocytes upon apoptotic stimuli (Turunen et al., 2004; Papucci et al., 2003). This mechanism does not appear to be operative for TCDD-induced oxidative stress, since Q level decreases while membrane potential increases following TCDD treatment. It has also been reported that an association with oxidized Q may be required for activation of UCPs to enhance proton transport, an association that would tend to dissociate this Q pool from those participating in the proton-motive Q cycle or from Q acting as antioxidant (Echtay et al., 2000). However, this property of Q in acting as a cofactor for UCP has been called into question (Jaburek et al., 2003; Esteves et al., 2004).
With such diverse functions, it seems improbable that Q exists as a single homogeneous pool of metabolite. Although Q is synthesized in all mammalian tissues at a rate sufficient to supply its diverse cellular needs (Turunen et al., 2004; Dallner et al., 2003), the regulation of Q metabolite pool levels is not fully understood. Biosynthesis of the isoprenoid moiety of Q (Szkopinska, 2000) is regulated in part by nuclear receptors, including the 9-cis-retinoic acid receptor (RXRα) and the peroxisome proliferator-activated receptor (PPARα). In RXRα-deficient mice, the hepatic Q content was only half that of wild-type liver, a decrease related to a constitutive lower rate of biosynthesis (Bentinger et al., 2003). RXR is a transcriptional dimerization partner with a number of other receptors, such as all-trans-retinoic acid receptor (RAR), liver X receptor (LXR), and farnesoid X receptor (FXR). Both LXR and FXR are related to lipid metabolism associated with the mevalonate pathway, a biosynthetic pathway from acetyl CoA to farnesyl pyrophosphate, the substrate for the biosynthesis of Q, cholesterol, dolichol and isoprenylated proteins (Dallner et al., 2003; Turunen et al., 2002). The ligand-activated PPAR-RXR heterodimeric transcription factor binds the peroxisome proliferator response element (PPRE), which in turn upregulates the downstream mitochondrial HMG-CoA synthase gene (Rodriguez et al., 1994; Hegardt, 1999). Under in vivo conditions, the different nuclear receptors compete for binding with RXR, bringing about a mechanism for cross-talk. TCDD is clearly involved in these retinoid signaling pathways, since all-trans-retinoic acid (a ligand for RAR) is increased, while 9-cis-retinoic acid (a ligand for RXRα) is decreased, as a result of exposure to TCDD (Schmidt et al., 2003). In addition, data from AHR null mice suggest the AHR is directly involved in the retinoid signaling pathway by TCDD (Andreola et al., 1997; Puga et al., 2005). Enzymes involved in such signaling include retinaldehyde dehydrogenase, CYP1A1, CYP1A2, CYP2S1 and CYP2C39 (Saarikoski et al., 2005; Puga et al., 2005). Moreover, the amount of Q in liver is regulated by dietary vitamin A (retinol), with vitamin A deficiency increasing Q, and vitamin A administration decreasing Q (Sohlenius-Sternbeck et al., 2000). Vitamin A is the precursor of all-trans-retinoic acid. So, it is likely that reduction of the amount of Q in liver mitochondria after TCDD treatment is mediated by increased levels of all-trans-retinoic acid, and concomitant decreases in 9-cis-retinoic acid, regulated by TCDD through the AHR. These pathways are depicted in Fig. 7.
Fig. 7. Proposed mechanism for the TCDD-mediated decrease in Q levels.
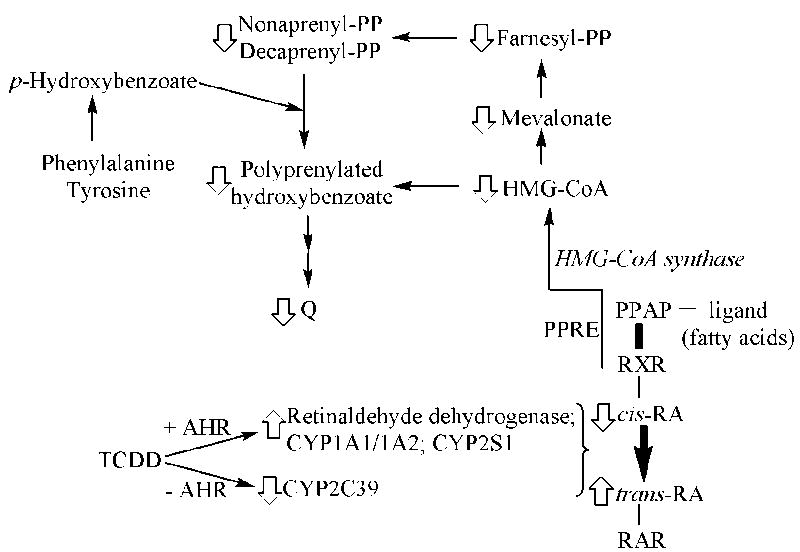
TCDD regulates the expression level for several genes encoding enzymes involved in retinoic acid (RA) metabolism. The resultant increase in trans-RA and decrease in cis-RA activate the trans-retinoic acid receptor (RAR) and inhibit activation of the cis-retinoic acid receptor (RXR), resulting in the inhibition of the rate of synthesis for HMG-CoA, a precursor for Q.
An alternative mechanism for the reduction in mitochondrial Q levels is based on our previous observation that plasma cholesterol levels increased following TCDD treatment (Dalton et al., 2001). If farnesyl pyrophosphate is rate-limiting in concentration and represents a regulated branch point in metabolism (Szkopinska, 2000), then it might be expected that TCDD increases the synthesis of steroids at the expense of Q. This possibility is speculative, especially since inhibition of squalene synthase by squalestatin did not increase the synthesis of Q, suggesting that the pathway to Q synthesis is saturated with respect to farnesyl pyrophosphate (Hartmann et al., 2000).
In addition to the decrease in the content of mitochondrial Q, our data indicate a marked difference in chemical reduction state between Q10 (75–80% reduced) and Q9 (15–20% reduced). Such data suggests the presence of an oxidation state crossover point, reflective of one or more rate-limiting sites located between the more oxidized and the more reduced redox couples in the pathway. In the case of complex 3, the rate-limiting steps are likely to be the electron transfers between Rieske iron-sulfur proteins (ISPs) and Q, determined primarily by the differences between the midpoint potentials of the ISP clusters and the Q/QH2 redox couple (Denke et al., 1998). Fig. 6 shows a model where Q10 is located more proximate to substrate than Q9, and would be the primary form of Q to accept electrons from complexes 1 and 2. By this model, Q10 would transfer electrons to Q9 which in turn would enter into the proton-motive Q cycle. This argument is thermodynamically reasonable, to the extent that Q9 has a more positive standard midpoint reduction potential than Q10 by approximately 35 mV (Tang et al., 2004). However, in order to postulate that complexes 1 and 2 do not reduce Q9 directly, kinetic or structural (as opposed to thermodynamic) restrictions must apply. We propose that Q9 and Q10 can remain as separate pools if Q9 is the essential semi-bound ubiquinone component of complex 3, and the ability of Q9 to accept electrons from complexes 1 or 3 is thereby limited. In this respect Q9 would be expected to be somewhat better than Q10 in membrane diffusion, an essential requirement for proton-motive Q cycle function (Hunte et al., 2003). In contrast, Q10 is the primary electron acceptor from complexes 1 and 2 (Fig. 6). Although Q is depicted as the component that redox cycles with O2 to generate superoxide, it is difficult to distinguish Q from ISPs in this regard. For example, in Q-depleted bovine heart mitochondria, the redox-active centers supporting NADH-dependent superoxide production are ISPs in complex 1, rather than Q (Genova et al., 2001). The scheme presented in Fig. 6 is also applicable to NADH-supported respiration, since even in the presence of complex 1 substrates, complex 3 appears to be the major site for reactive oxygen production (Chen et al., 2003).
A second possibility for the different reduction states for Q9 and Q10 is that reduction state reflects different primary functions. For example, a portion of the Q9 pool may serve more as an antioxidant, absorbing oxidative hits that would render it in a relatively more oxidized state. Q10 may exist in a more chemically reduced state by virtue of its relatively greater role in electron transport, relative to electron scavenging (antioxidation). Such differences in function of Q9 and Q10 are suggested by recent studies regarding the synthesis of endogenous Q. In eukaryotes, the nuclear gene products for Q synthesis are transported to the inner mitochondrial membrane, the site of Q biosynthesis (Johnson et al., 2005). Although synthesized and dietary Q may be utilized for supporting complex 3 respiration (Santos-Ocana et al., 2002), they are not identical metabolite pools. Recent studies indicate that enzymes involved in Q biosynthesis may exist as a structural complex which may be stabilized by a Q synthetic intermediate (Gin et al., 2005). We speculate that such an endogenously synthesized Q, consisting in mouse of primarily Q9, would be a different functional pool than that derived from dietary Q, consisting primarily of Q10.
Regardless of the rationale, it is clear that Q9 and Q10 exist as separate pools with perhaps overlapping functions. Analogous distinct pools of Q are likely to exist in humans, but would be difficult to discern because almost all of the ubiquinone exists as Q10 (Takada et al., 1984). Q is unlikely to exist as a single pool dispersed in a homogeneous manner throughout the membrane, as sometimes depicted [Model A in (Lenaz, 2001)]. Rather, functional evidence supports the notion of a respirasome, or non-random assembly of respiratory components, including Q [Model B in (Lenaz, 2001)]. A relatively nonmobile Q pool (primarily Q10 in mice) may accept electrons from the iron-sulfur clusters of complexes 1 and 2, then transfer the electrons to either oxygen (redox-cycling) or a separate pool of Q associated with complex 3 (primarily Q9 in mice, and also able to redox cycle). The binding of Q to respiratory proteins may be an important factor determining superoxide production (Lass et al., 1999). An aging-related impaired binding of Q to complex 3 in rat heart mitochondria is associated with an electron leak and the production of more reactive oxygen (Moghaddas et al., 2003).
Recent studies suggest that the content of Q may not be rate-limiting for respiration (Lenaz, 2001). Even a large decrease of the Q content by 60–70% in C. elegans does not reduce the rate of mitochondrial electron transport (Asencio et al., 2003). These observations are consistent with our findings that even though complex 3 is often rate-limiting for respiration, factors other than Q concentration regulate the rate of electron flow, including membrane fluidity and functional activities of complex 4 (COX) and complex 5 (F0F1-ATP synthase). Furthermore, the TCDD-mediated decrease in Q concomitant with an increase in respiration would result in an increase in complex 3 Q redox-cycling, which may explain the TCDD-mediated increase in membrane potential and the associated increase in reactive oxygen production.
In summary, the mitochondrial alterations generated by TCDD that elicit the oxidative stress response are complicated. The primary changes consist of an increase in reduction state of glutathione that permits inner membrane state 4 hyperpolarization, a decrease in Q associated with complex 3, and a defect in ATP synthesis that increases respiration but decreases tissue ATP levels. The resulting increase in Q redox-cycling drives reactive oxygen synthesis that increases mitochondrial membrane fluidity and mitochondrial DNA damage.
Acknowledgments
This work was supported in part by National Institutes of Health grants R01 ES10133 (HGS), R01 ES08147 (DWN), R01 ES12463 (TPD), and NIEHS center grant P30 ES06096. We also thank Dr. Bernard L. Trumpower for a critical reading of the manuscript. Dr. Mario Medvedovic was immensely helpful regarding statistical evaluation of the data.
References
- 1.Ackrell BAC, Kearney EB, Singer TP. Mammalian succinate dehydrogenase. Methods in Enzymology. 1978;53:466–483. doi: 10.1016/s0076-6879(78)53050-4. [DOI] [PubMed] [Google Scholar]
- 2.Ames BN, Shigenaga MK, Hagen TM. Oxidants, antioxidants, and the degenerative diseases of aging. Proc Natl Acad Sci USA. 1993;90:7915–7922. doi: 10.1073/pnas.90.17.7915. [DOI] [PMC free article] [PubMed] [Google Scholar]
- 3.Andreola F, Fernandez-Salguero PM, Chiantore MV, Petkovich MP, Gonzalez FJ, De Luca LM. Aryl hydrocarbon receptor knockout mice (AHR-/-) exhibit liver retinoid accumulation and reduced retinoic acid metabolism. Cancer Res. 1997;57:2835–2838. [PubMed] [Google Scholar]
- 4.Asencio C, Rodriguez-Aguilera JC, Ruiz-Ferrer M, Vela J, Navas P. Silencing of ubiquinone biosynthesis genes extends life span in Caenorhabditis elegans. FASEB J. 2003;17:1135–1137. doi: 10.1096/fj.02-1022fje. [DOI] [PubMed] [Google Scholar]
- 5.Azzi A. The use of fluorescent probes for the study of membranes. Methods in Enzymology. 1974;32 (Part B):234–246. doi: 10.1016/0076-6879(74)32024-1. [DOI] [PubMed] [Google Scholar]
- 6.Bentinger M, Turunen M, Zhang XX, Wan YJ, Dallner G. Involvement of retinoid X receptor alpha in coenzyme Q metabolism. J Mol Biol. 2003;326:795–803. doi: 10.1016/s0022-2836(02)01447-x. [DOI] [PubMed] [Google Scholar]
- 7.Bianchet MA, Pedersen PL, Amzel LM. Notes on the mechanism of ATP synthesis. J Bioenerg Biomembr. 2000;32:517–521. doi: 10.1023/a:1005673209883. [DOI] [PubMed] [Google Scholar]
- 8.Bossy-Wetzel E, Green DR. Apoptosis: checkpoint at the mitochondrial frontier. Mutat Res. 1999;434:243–251. doi: 10.1016/s0921-8777(99)00032-4. [DOI] [PubMed] [Google Scholar]
- 9.Cadenas E, Davies KJ. Mitochondrial free radical generation, oxidative stress, and aging. Journal of Free Radicals in Biology and Medicine. 2000;29:222–230. doi: 10.1016/s0891-5849(00)00317-8. [DOI] [PubMed] [Google Scholar]
- 10.Chance B, Sies H, Boveris A. Hydroperoxide metabolism in mammalian organs. Physiological Reviews. 1979;59:527–605. doi: 10.1152/physrev.1979.59.3.527. [DOI] [PubMed] [Google Scholar]
- 11.Chen Q, Vazquez EJ, Moghaddas S, Hoppel CL, Lesnefsky EJ. Production of Reactive Oxygen Species by Mitochondria: CENTRAL ROLE OF COMPLEX III. J Biol Chem. 2003;278:36027–36031. doi: 10.1074/jbc.M304854200. [DOI] [PubMed] [Google Scholar]
- 12.Chomyn A, Attardi G. MtDNA mutations in aging and apoptosis. Biochem Biophys Res Commun. 2003;304:519–529. doi: 10.1016/s0006-291x(03)00625-9. [DOI] [PubMed] [Google Scholar]
- 13.Cossarizza A, Baccarani-Contri M, Kalashnikova G, Franceschi C. A new method for the cytofluorimetric analysis of mitochondrial membrane potential using the J-aggregate forming lipophilic cation 5,5',6,6'-tetrachloro-1,1',3,3'-tetraethylbenzimidazolcarbocyanine iodide (JC-1) Biochem Biophys Res Commun. 1993;197:40–45. doi: 10.1006/bbrc.1993.2438. [DOI] [PubMed] [Google Scholar]
- 14.Dallner G, Brismar K, Chojnacki T, Swiezewska E. Regulation of coenzyme Q biosynthesis and breakdown. Biofactors. 2003;18:11–22. doi: 10.1002/biof.5520180203. [DOI] [PubMed] [Google Scholar]
- 15.Dalton TP, Chen Y, Schneider SN, Nebert DW, Shertzer HG. Genetically altered mice to evaluate glutathione homeostasis in health and disease. Journal of Free Radicals in Biology and Medicine. 2004;37:1511–1526. doi: 10.1016/j.freeradbiomed.2004.06.040. [DOI] [PubMed] [Google Scholar]
- 16.Dalton TP, Kerzee JK, Wang B, Miller M, Dieter MZ, Lorenz JN, Shertzer HG, Nerbert DW, Puga A. Dioxin exposure is an environmental risk factor for ischemic heart disease. Cardiovasc Toxicol. 2001;1:285–298. doi: 10.1385/ct:1:4:285. [DOI] [PubMed] [Google Scholar]
- 17.Denke E, Merbitz-Zahradnik T, Hatzfeld OM, Snyder CH, Link TA, Trumpower BL. Alteration of the midpoint potential and catalytic activity of the rieske iron-sulfur protein by changes of amino acids forming hydrogen bonds to the iron-sulfur cluster. J Biol Chem. 1998;273:9085–9093. doi: 10.1074/jbc.273.15.9085. [DOI] [PubMed] [Google Scholar]
- 18.Devenish RJ, Prescott M, Boyle GM, Nagley P. The Oligomycin Axis of Mitochondrial ATP Synthase: OSCP and the Proton Channel. J Bioenerg Biomembr. 2000;32:507–515. doi: 10.1023/a:1005621125812. [DOI] [PubMed] [Google Scholar]
- 19.Echtay KS, Winkler E, Klingenberg M. Coenzyme Q is an obligatory cofactor for uncoupling protein function. Nature. 2000;408:609–613. doi: 10.1038/35046114. [DOI] [PubMed] [Google Scholar]
- 20.Esposito LA, Melov S, Panov A, Cottrell BA, Wallace DC. Mitochondrial disease in mouse results in increased oxidative stress. Proc Natl Acad Sci. 1999;96:4820–4825. doi: 10.1073/pnas.96.9.4820. [DOI] [PMC free article] [PubMed] [Google Scholar]
- 21.Esteves TC, Echtay KS, Jonassen T, Clarke CF, Brand MD. Ubiquinone is not required for proton conductance by uncoupling protein 1 in yeast mitochondria. Biochem J. 2004;379:309–315. doi: 10.1042/BJ20031682. [DOI] [PMC free article] [PubMed] [Google Scholar]
- 22.Esworthy RS, Ho YS, Chu FF. The Gpx1 gene encodes mitochondrial glutathione peroxidase in the mouse liver. Arch Biochem Biophys. 1997;340:59–63. doi: 10.1006/abbi.1997.9901. [DOI] [PubMed] [Google Scholar]
- 23.Genova ML, Pich MM, Biondi A, Bernacchia A, Falasca A, Bovina C, Formiggini G, Castelli GP, Lenaz G. Mitochondrial production of oxygen radical species and the role of Coenzyme Q as an antioxidant. Exp Biol Med (Maywood) 2003;228:506–513. doi: 10.1177/15353702-0322805-14. [DOI] [PubMed] [Google Scholar]
- 24.Genova ML, Ventura B, Giuliano G, Bovina C, Formiggini G, Parenti CG, Lenaz G. The site of production of superoxide radical in mitochondrial Complex I is not a bound ubisemiquinone but presumably iron-sulfur cluster N2. FEBS Lett. 2001;505:364–368. doi: 10.1016/s0014-5793(01)02850-2. [DOI] [PubMed] [Google Scholar]
- 25.Gin P, Clarke CF. Genetic evidence for a multi-subunit complex in coenzyme Q biosynthesis in yeast and the role of the Coq1 hexaprenyl diphosphate synthase. J Biol Chem. 2005;280:2676–2681. doi: 10.1074/jbc.M411527200. [DOI] [PubMed] [Google Scholar]
- 26.Grassman JA, Masten SA, Walker NJ, Lucier GW. Animal models of human response to dioxins. Environ Health Perspect. 1998;106 Suppl 2:761–775. doi: 10.1289/ehp.98106761. [DOI] [PMC free article] [PubMed] [Google Scholar]
- 27.Grav HJ, Tronstad KJ, Gudbrandsen OA, Berge K, Fladmark KE, Martinsen TC, Waldum H, Wergedahl H, Berge RK. Changed energy state and increased mitochondrial beta-oxidation rate in liver of rats associated with lowered proton electrochemical potential and stimulated uncoupling protein 2 (UCP-2) expression: evidence for peroxisome proliferator-activated receptor-alpha independent induction of UCP-2 expression. J Biol Chem. 2003;278:30525–30533. doi: 10.1074/jbc.M303382200. [DOI] [PubMed] [Google Scholar]
- 28.Grover GJ, Atwal KS, Sleph PG, Wang FL, Monshizadegan H, Monticello T, Green DW. Excessive ATP hydrolysis in ischemic myocardium by mitochondrial F1F0-ATPase: effect of selective pharmacological inhibition of mitochondrial ATPase hydrolase activity. Am J Physiol Heart Circ Physiol. 2004;287:H1747–H1755. doi: 10.1152/ajpheart.01019.2003. [DOI] [PubMed] [Google Scholar]
- 29.Gulbins E, Dreschers S, Bock J. Role of mitochondria in apoptosis. Exp Physiol. 2003;88:85–90. doi: 10.1113/eph8802503. [DOI] [PubMed] [Google Scholar]
- 30.Gutierrez-Cirlos EB, Trumpower BL. Inhibitory analogs of ubiquinol act anti-cooperatively on the Yeast cytochrome bc1 complex. Evidence for an alternating, half-of-the-sites mechanism of ubiquinol oxidation. J Biol Chem. 2002;277:1195–1202. doi: 10.1074/jbc.M109097200. [DOI] [PubMed] [Google Scholar]
- 31.Hartmann MA, Wentzinger L, Hemmerlin A, Bach TJ. Metabolism of farnesyl diphosphate in tobacco BY-2 cells treated with squalestatin. Biochem Soc Trans. 2000;28:794–796. [PubMed] [Google Scholar]
- 32.Hegardt FG. Mitochondrial 3-hydroxy-3-methylglutaryl-CoA synthase: a control enzyme in ketogenesis. Biochem J. 1999;338(Pt 3):569–582. [PMC free article] [PubMed] [Google Scholar]
- 33.Huertas JR, Battino M, Lenaz G, Mataix FJ. Changes in mitochondrial and microsomal rat liver coenzyme Q9 and Q10 content induced by dietary fat and endogenous lipid peroxidation. FEBS Lett. 1991;287:89–92. doi: 10.1016/0014-5793(91)80022-u. [DOI] [PubMed] [Google Scholar]
- 34.Hunte C, Palsdottir H, Trumpower BL. Protonmotive pathways and mechanisms in the cytochrome bc1 complex. FEBS Lett. 2003;545:39–46. doi: 10.1016/s0014-5793(03)00391-0. [DOI] [PubMed] [Google Scholar]
- 35.Ichikawa N, Chisuwa N, Tanase M, Nakamura M. Mitochondrial ATP synthase residue betaarginine-408, which interacts with the inhibitory site of regulatory protein IF1, is essential for the function of the enzyme. J Biochem (Tokyo) 2005;138:201–207. doi: 10.1093/jb/mvi116. [DOI] [PubMed] [Google Scholar]
- 36.Jaburek M, Garlid KD. Reconstitution of recombinant uncoupling proteins: UCP1, -2, and -3 have similar affinities for ATP and are unaffected by coenzyme Q10. J Biol Chem. 2003;278:25825–25831. doi: 10.1074/jbc.M302126200. [DOI] [PubMed] [Google Scholar]
- 37.Jaburek M, Varecha M, Gimeno RE, Dembski M, Jezek P, Zhang M, Burn P, Tartaglia LA, Garlid KD. Transport function and regulation of mitochondrial uncoupling proteins 2 and 3. J Biol Chem. 1999;274:26003–26007. doi: 10.1074/jbc.274.37.26003. [DOI] [PubMed] [Google Scholar]
- 38.James AM, Smith RA, Murphy MP. Antioxidant and prooxidant properties of mitochondrial Coenzyme Q. Arch Biochem Biophys. 2004;423:47–56. doi: 10.1016/j.abb.2003.12.025. [DOI] [PubMed] [Google Scholar]
- 39.Johnson A, Gin P, Marbois BN, Hsieh EJ, Wu M, Barros MH, Clarke CF, Tzagoloff A. COQ9, a new gene required for the biosynthesis of coenzyme Q in Saccharomyces cerevisiae. J Biol Chem. 2005;280:31397–31404. doi: 10.1074/jbc.M503277200. [DOI] [PubMed] [Google Scholar]
- 40.Jungling E, Timmerman M, Ionescu AA, Mertens M, Loken C, Kammermeier H, Fischer Y. Luminometric measurement of subnanomole amounts of key metabolites in extracts from isolated heart muscle cells. Analytical Biochemistry. 1996;239:41–46. doi: 10.1006/abio.1996.0288. [DOI] [PubMed] [Google Scholar]
- 41.Lass A, Sohal RS. Comparisons of coenzyme Q bound to mitochondrial membrane proteins among different mammalian species. Journal of Free Radicals in Biology and Medicine. 1999;27:220–226. doi: 10.1016/s0891-5849(99)00085-4. [DOI] [PubMed] [Google Scholar]
- 42.Lenaz G. Role of mitochondria in oxidative stress and ageing. Biochim Biophys Acta. 1998;1366:53–67. doi: 10.1016/s0005-2728(98)00120-0. [DOI] [PubMed] [Google Scholar]
- 43.Lenaz G. A critical appraisal of the mitochondrial coenzyme Q pool. FEBS Lett. 2001;509:151–155. doi: 10.1016/s0014-5793(01)03172-6. [DOI] [PubMed] [Google Scholar]
- 44.Lo YY, Wong JM, Cruz TF. Reactive oxygen species mediate cytokine activation of c-Jun NH2-terminal kinases. J Biol Chem. 1996;271:15703–15707. doi: 10.1074/jbc.271.26.15703. [DOI] [PubMed] [Google Scholar]
- 45.Mitchell P. Protonmotive redox mechanism of the cytochrome b-c1 complex in the respiratory chain: protonmotive ubiquinone cycle. FEBS Lett. 1975;56:1–6. doi: 10.1016/0014-5793(75)80098-6. [DOI] [PubMed] [Google Scholar]
- 46.Moghaddas S, Hoppel CL, Lesnefsky EJ. Aging defect at the QO site of complex III augments oxyradical production in rat heart interfibrillar mitochondria. Arch Biochem Biophys. 2003;414:59–66. doi: 10.1016/s0003-9861(03)00166-8. [DOI] [PubMed] [Google Scholar]
- 47.Nohl H, de Silva D, Summer KH. 2,3,7,8, tetrachlorodibenzo-p-dioxin induces oxygen activation associated with cell respiration. Journal of Free Radicals in Biology and Medicine. 1989;6:369–374. doi: 10.1016/0891-5849(89)90081-6. [DOI] [PubMed] [Google Scholar]
- 48.Papa S, Zanotti F, Gaballo A. The structural and functional connection between the catalytic and proton translocating sectors of the mitochondrial F1F0-ATP synthase. J Bioenerg Biomembr. 2000;32:401–411. doi: 10.1023/a:1005584221456. [DOI] [PubMed] [Google Scholar]
- 49.Papucci L, Schiavone N, Witort E, Donnini M, Lapucci A, Tempestini A, Formigli L, Zecchi-Orlandini S, Orlandini G, Carella G, Brancato R, Capaccioli S. Coenzyme Q10 prevents apoptosis by inhibiting mitochondrial depolarization independently of its free radical scavenging property. J Biol Chem. 2003;278:28220–28228. doi: 10.1074/jbc.M302297200. [DOI] [PubMed] [Google Scholar]
- 50.Pecqueur C, Alves-Guerra MC, Gelly C, Levi-Meyrueis C, Couplan E, Collins S, Ricquier D, Bouillaud F, Miroux B. Uncoupling protein 2, in vivo distribution, induction upon oxidative stress, and evidence for translational regulation. J Biol Chem. 2001;276:8705–8712. doi: 10.1074/jbc.M006938200. [DOI] [PubMed] [Google Scholar]
- 51.Poland A, Palen D, Glover E. Tumour promotion by TCDD in skin of HRS/J hairless mice. Nature. 1982;300:271–273. doi: 10.1038/300271a0. [DOI] [PubMed] [Google Scholar]
- 52.Polster BM, Fiskum G. Mitochondrial mechanisms of neural cell apoptosis. J Neurochem. 2004;90:1281–1289. doi: 10.1111/j.1471-4159.2004.02572.x. [DOI] [PubMed] [Google Scholar]
- 53.Puga A, Tomlinson CR, Xia Y. Ah receptor signals cross-talk with multiple developmental pathways. Biochem Pharmacol. 2005;69:199–207. doi: 10.1016/j.bcp.2004.06.043. [DOI] [PubMed] [Google Scholar]
- 54.Reers M, Smiley ST, Mottola-Hartshorn C, Chen A, Lin M, Chen LB. Mitochondrial membrane potential monitored by JC-1 dye. Methods in Enzymology. 1995;260:406–417. doi: 10.1016/0076-6879(95)60154-6. [DOI] [PubMed] [Google Scholar]
- 55.Ribeiro PS, Cortez-Pinto H, Sola S, Castro RE, Ramalho RM, Baptista A, Moura MC, Camilo ME, Rodrigues CM. Hepatocyte apoptosis, expression of death receptors, and activation of NF-kappaB in the liver of nonalcoholic and alcoholic steatohepatitis patients. Am J Gastroenterol. 2004;99:1708–1717. doi: 10.1111/j.1572-0241.2004.40009.x. [DOI] [PubMed] [Google Scholar]
- 56.Richter C. Oxidative damage to mitochondrial DNA and its relationship to ageing. [Review] International Journal of Biochemistry & Cell Biology. 1995;27:647–653. doi: 10.1016/1357-2725(95)00025-k. [DOI] [PubMed] [Google Scholar]
- 57.Rodriguez JC, Gil-Gomez G, Hegardt FG, Haro D. Peroxisome proliferator-activated receptor mediates induction of the mitochondrial 3-hydroxy-3-methylglutaryl-CoA synthase gene by fatty acids. J Biol Chem. 1994;269:18767–18772. [PubMed] [Google Scholar]
- 58.Saarikoski ST, Rivera SP, Hankinson O, Husgafvel-Pursiainen K. CYP2S1: A short review. Toxicol Appl Pharmacol. 2005;207:62–69. doi: 10.1016/j.taap.2004.12.027. [DOI] [PubMed] [Google Scholar]
- 59.Santos-Ocana C, Do TQ, Padilla S, Navas P, Clarke CF. Uptake of Exogenous Coenzyme Q and Transport to Mitochondria Is Required for bc1 Complex Stability in Yeast coq Mutants. J Biol Chem. 2002;277:10973–10981. doi: 10.1074/jbc.M112222200. [DOI] [PubMed] [Google Scholar]
- 60.Schmidt CK, Hoegberg P, Fletcher N, Nilsson CB, Trossvik C, Hakansson H, Nau H. 2,3,7,8-tetrachlorodibenzo-p-dioxin (TCDD) alters the endogenous metabolism of all-trans-retinoic acid in the rat. Arch Toxicol. 2003;77:371–383. doi: 10.1007/s00204-003-0457-8. [DOI] [PubMed] [Google Scholar]
- 61.Schneider DL, Kagawa Y, Racker E. Chemical modification of the inner mitochondrial membrane. J Biol Chem. 1972;247:4074–4079. [PubMed] [Google Scholar]
- 62.Senft AP, Dalton TP, Nebert DW, Genter MB, Hutchinson RJ, Shertzer HG. Dioxin increases reactive oxygen production in mouse liver mitochondria. Toxicol Appl Pharmacol. 2002a;178:15–21. doi: 10.1006/taap.2001.9314. [DOI] [PubMed] [Google Scholar]
- 63.Senft AP, Dalton TP, Nebert DW, Genter MB, Puga A, Hutchinson RJ, Kerzee JK, Uno S, Shertzer HG. Mitochondrial reactive oxygen production is dependent on the aromatic hydrocarbon receptor. Journal of Free Radicals in Biology and Medicine. 2002b;33:1268–1278. doi: 10.1016/s0891-5849(02)01014-6. [DOI] [PubMed] [Google Scholar]
- 64.Shen D, Dalton TP, Nebert DW, Shertzer HG. Glutathione redox state regulates mitochondrial reactive oxygen production. J Biol Chem. 2005;280:25305–25312. doi: 10.1074/jbc.M500095200. [DOI] [PubMed] [Google Scholar]
- 65.Shertzer HG, Bannenberg GL, Rundgren M, Moldeus P. Relationship of membrane fluidity, chemoprotection, and the intrinsic toxicity of butylated hydroxytoluene. Biochem Pharmacol. 1991;42:1587–1593. doi: 10.1016/0006-2952(91)90428-8. [DOI] [PubMed] [Google Scholar]
- 66.Shertzer HG, Clay CD, Genter MB, Chames MC, Schneider SN, Oakley GG, Nebert DW, Dalton TP. Uncoupling-mediated generation of reactive oxygen by halogenated aromatic hydrocarbons in mouse liver microsomes. Journal of Free Radicals in Biology and Medicine. 2004a;36:618–631. doi: 10.1016/j.freeradbiomed.2003.11.014. [DOI] [PubMed] [Google Scholar]
- 67.Shertzer HG, Clay CD, Genter MB, Schneider SN, Nebert DW, Dalton TP. Cyp1a2 protects against reactive oxygen production in mouse liver microsomes. Journal of Free Radicals in Biology and Medicine. 2004b;36:605–617. doi: 10.1016/j.freeradbiomed.2003.11.013. [DOI] [PubMed] [Google Scholar]
- 68.Shertzer HG, Nebert DW, Puga A, Ary M, Sonntag D, Dixon K, Robinson LJ, Cianciolo E, Dalton TP. Dioxin causes a sustained oxidative stress response in the mouse. Biochemical and Biophysical Research Communications. 1998;253:44–48. doi: 10.1006/bbrc.1998.9753. [DOI] [PubMed] [Google Scholar]
- 69.Shinitzky M, Barenholz Y. Fluidity parameters of lipid regions determined by fluorescence polarization. Biochim Biophys Acta. 1978;515:367–394. doi: 10.1016/0304-4157(78)90010-2. [DOI] [PubMed] [Google Scholar]
- 70.Skulachev VP. Uncoupling: new approaches to an old problem of bioenergetics. Biochim Biophys Acta. 1998;1363:100–124. doi: 10.1016/s0005-2728(97)00091-1. [DOI] [PubMed] [Google Scholar]
- 71.Sohlenius-Sternbeck AK, Appelkvist EL, DePierre JW. Effects of vitamin A deficiency on selected xenobiotic-metabolizing enzymes and defenses against oxidative stress in mouse liver. Biochem Pharmacol. 2000;59:377–383. doi: 10.1016/s0006-2952(99)00337-8. [DOI] [PubMed] [Google Scholar]
- 72.Sundaresan M, Yu ZX, Ferrans VJ, Irani K, Finkel T. Requirement for generation of H2O2 for platelet-derived growth factor signal transduction. Science. 1995;270:296–299. doi: 10.1126/science.270.5234.296. [DOI] [PubMed] [Google Scholar]
- 73.Szkopinska A. Ubiquinone. Biosynthesis of quinone ring and its isoprenoid side chain Intracellular localization. Acta Biochim Pol. 2000;47:469–480. [PubMed] [Google Scholar]
- 74.Takada M. Determination of reduced and oxidized ubiquinones. In: Miquel J, Quintanilha AT, Weber H, editors. Handbook of Free Radicals and Antioxidants in Medicine. CRC Press; Boca Raton, FL: 1989. pp. 257–263. [Google Scholar]
- 75.Takada M, Ikenoya S, Yuzuriha T, Katayama K. Simultaneous determination of reduced and oxidized ubiquinones. Methods Enzymol. 1984;105:147–155. doi: 10.1016/s0076-6879(84)05020-5. [DOI] [PubMed] [Google Scholar]
- 76.Tang PH, Miles MV, Miles L, Quinlan J, Wong B, Wenisch A, Bove K. Measurement of reduced and oxidized coenzyme Q9 and coenzyme Q10 levels in mouse tissues by HPLC with coulometric detection. Clin Chim Acta. 2004;341:173–184. doi: 10.1016/j.cccn.2003.12.002. [DOI] [PubMed] [Google Scholar]
- 77.Trumpower BL, Edwards CA. Purification of a reconstitutively active iron-sulfur protein (oxidation factor) from succinate . cytochrome c reductase complex of bovine heart mitochondria. J Biol Chem. 1979;254:8697–8706. [PubMed] [Google Scholar]
- 78.Tu N, Chen H, Winnikes U, Reinert I, Marmann G, Pirke KM, Lentes KU. Molecular cloning and functional characterization of the promoter region of the human uncoupling protein-2 gene. Biochem Biophys Res Commun. 1999;265:326–334. doi: 10.1006/bbrc.1999.1663. [DOI] [PubMed] [Google Scholar]
- 79.Turunen M, Olsson J, Dallner G. Metabolism and function of coenzyme Q. Biochim Biophys Acta. 2004;1660:171–199. doi: 10.1016/j.bbamem.2003.11.012. [DOI] [PubMed] [Google Scholar]
- 80.Turunen M, Swiezewska E, Chojnacki T, Sindelar P, Dallner G. Regulatory aspects of coenzyme Q metabolism. Free Radic Res. 2002;36:437–443. doi: 10.1080/10715760290021298. [DOI] [PubMed] [Google Scholar]
- 81.Yamada M, Hashida T, Shibusawa N, Iwasaki T, Murakami M, Monden T, Satoh T, Mori M. Genomic organization and promoter function of the mouse uncoupling protein 2 (UCP2) gene. FEBS Lett. 1998;432:65–69. doi: 10.1016/s0014-5793(98)00835-7. [DOI] [PubMed] [Google Scholar]