

Abstract
Sensitivity to spoken language is an integral part of infants’ formative development, yet relatively little is known about the neural mechanisms that underlie the emerging ability to perceive and process speech. This is in large part because there are a limited number of non-invasive techniques available to measure brain functioning in human infants. Near-infrared spectroscopy (NIRS), an optical imaging technique that estimates changes in neuronal activity by measuring changes in total hemoglobin concentration and oxygenation, may be a viable procedure for assessing the relation between speech processing and brain function in human infants. While auditory processing data have been gathered from newborn and preterm infants using NIRS, such data have not been collected from older infants. Many behavioral measures used to establish linguistic sensitivity in this population are accompanied by visual stimuli; however, it is unclear how coupling of auditory and visual stimuli influences neural processing. Here we studied cortical activity in infants aged 6-9 months, as measured by NIRS, during exposure to linguistic stimuli paired with visual stimuli and compared this to the activity observed in the same regions during exposure to visual stimuli alone. Results dissociate infants’ hemodynamic responses to multimodal and unimodal stimuli, demonstrating the utility of NIRS for studying perceptual development in infants. In particular, these findings support the utility of NIRS for studying the neurobiology of language development in older infants, a task that is difficult to accomplish without the use of attention-getting visual stimuli.
Infants’ ability to perceive speech begins in the womb, and progresses dramatically during the first year of life (DeCasper and Fifer, 1980;Werker and Tees, 1984). Research indicates that during the last trimester in-utero (Mehler et al., 1988), and in the first twelve months of life post-natally (Jusczyk, 1997), infants become aware of and adjust to regularities in their native language. By using various cues found in adult speech, infants gradually come to understand and use their native language. For example, between 6 and 9 months of age, infants become sensitive to patterns within their native language, such as prosodic cues (Cutler, 1990; Morgan, 1996), phonotactic cues (Hohne and Jusczyk, 1994; Jusczyk et al., 1994), and allophonic variation (Hohne and Jusczyk, 1994). Investigating and understanding the mechanisms of the trajectory of such advances is a difficult task, and researchers have advanced the study of infant speech perception largely based on clever behavioral paradigms (e.g., Eimas et al., 1971; Trehub, 1973; Jusczyk et al., 1993; Saffran et al., 1996).
The behavioral methods used to understand language development across infants’ first year are typically chosen based on the specific age group being studied and the particular question being asked. For example, with infants four months of age and younger, a useful method employs a pacifier to record changes in infant sucking patterns typically linked to discrimination of stimuli (Siqueland and DeLucia, 1969). Subsequent variations of this method focus on contingency sucking, where presentation of stimuli is dependent on the infant achieving a high, predetermined level of pacifier manipulation (Gottlieb and Krasnegor, 1985). Behavioral paradigms used with infants four months and older generally track head or eye movements, and record duration of orientation time (Jusczyk, 1997). Like the pacifier method used for younger infants, such methods use a contingency dynamic where the infant receives additional stimuli in response to sustained looking time in a particular direction. Some paradigms use auditory stimuli alone, measuring duration of head-turns oriented towards the source of the stimuli (e.g., Kemler-Nelson et al., 1995), while others use both linguistic and visual stimuli, measuring duration of looking towards consistent and inconsistent pairings (e.g., Stager and Werker, 1997). Visual stimuli can also be used to maintain infants’ attention, either between or during presentation of linguistic stimuli (e.g., Cooper et al., 1997). Results obtained from such behavioral methods are effective in that they yield consistent response patterns that researchers have used to suggest models of infant development, and results based on these methods have revealed remarkable cognitive advances within infants’ first twelve months.
Recent investigations have increasingly used methods that assess neurological and hemodynamic parameters of infant perception and cognition (de Haan and Johnson, 2003). These methods show promise for providing insight on the neurobiological basis for infants’ responses to stimuli. Direct measures of neural activity, such as event-related potentials, have provided information about both the timing and localization of neural responses to perceptual input. Hemodynamic indicators of neural activity offer exciting new and useful means for investigating infant development (e.g., Dehaene-Lambertz et al., 2002). While these neuroimaging techniques are allowing researchers to begin asking different questions about infants’ development, they also have limitations. Methods such as positron emission topography (PET) and functional magnetic resonance imaging (fMRI) are generally considered impractical or unsafe for use with healthy infants (but see Dehaene-Lambertz et al., 2002). PET is more appropriate for clinical applications because it requires the injection of radioactive materials that are unsafe for repeated use. A technology for estimating hemodynamic changes that to some degree operates outside these limitations is near-infrared spectroscopy (NIRS). NIRS has several advantages over other hemodynamic-based techniques, in particular when investigations call for testing awake, behaving infants, as with language development. Although infants’ movement must be somewhat reduced to control motion artifacts, it is a problem that is manageable with proper design and use of the equipment, as well as with good experimental design.
In NIRS, near-infrared light is projected through the scalp and skull into the brain, and the intensity of light diffusely reflected is recorded. The modulation of the recorded intensity by localized changes in the optical properties of the brain is used as an estimate of neural activation. The NIRS technique used in the present research utilizes changes in blood volume and hemoglobin oxygenation (i.e., hemodynamics) as an index of neural activation (see Meek, 2002; Grinvald et al., 1991; Strangman et al., 2002a; Villringer and Chance, 1997; Villringer and Dirnagl, 1995). This technique has been used with medically at-risk infants in the clinical setting (Chen et al., 2000; Hintz et al., 2001; Meek et al., 1999b; Meek et al., 1998; Meek et al., 1999a; Sakatani et al., 1999; Soul and du Plessis, 1999; Zaramella et al., 2001) and, more recently, its applicability in the experimental setting has been explored (Baird et al., 2002; Peña et al., 2003); Taga et al., 2003; Wilcox et al., 2005). The rationale for this approach rests on the concept that neural activation in response to a stimulus results in increased energy demands in the area activated. In response to the demand for energy, cerebral blood flow (CBF) increases to the activated brain areas, bringing both oxygen and glucose. Changes in blood flow lead to an increase in blood volume and can be assessed by measuring local concentrations of oxyhemoglobin (oxygenated blood) and deoxyhemoglobin (deoxygenated blood).
Typically, during cortical activation local concentrations of oxyhemoglobin (HbO2) increase, whereas concentrations of deoxyhemoglobin (HbR) decrease (Bartocci et al., 2000; Hoshi and Tamura, 1993; Jasdzewski et al., 2003; Obrig et al., 1996; Strangman et al., 2003). From the summated changes in HbR and HbO2, total hemoglobin (HbT) can be computed and is found to increase following brain activation. To capitalize on these changes, the low tissue absorption of near-infrared light between approximately 650 and 950 nm is utilized. At these wavelengths, light is differentially absorbed by oxygenated and deoxygenated blood (Gratton et al., 2000; Villringer and Chance, 1997). Measuring the light intensity modulation during stimulus presentation, and comparing it to the light intensity during a baseline event in which no stimulus is presented, provides important information about the hemodynamic response to brain activation (i.e., relative concentrations of HbO2 and HbR). Evidence that there is a relationship between hemodynamics and neural activity (Gratton et al., 2001), and that NIRS produces results consistent with other imaging techniques (fMRI and PET) used simultaneously (Kleinschmidt et al., 1996; Strangman et al., 2002b; Villringer et al., 1997), provides converging evidence that NIRS can provide a reliable estimate of brain activity. Occasionally, researchers find an increase, rather than a decrease, in HbR (Bartocci et al., 2001; Chen et al., 2002; Hoshi and Tamura, 1993; Jasdzewski et al., 2003; Kato et al., 1993; Sakatani et al.,1999; Strangman et al., 2003) in targeted cortical areas. Although it is not entirely clear why an increase in HbR is sometimes observed, in infants it is assumed to be a less mature hemodynamic response.
The application of methods for tracking hemodynamic correlates of brain activity, such as NIRS, is allowing further examination of the neural basis of perceptual and cognitive development. For example, recent experiments using NIRS (Peña et al., 2003), and fMRI (Dehaene-Lambertz et al., 2002) have indicated that the underlying neurological substrate necessary for language processing may already be present in very young infants. Results from both studies demonstrated significantly more activation in the left temporal cortex in response to forward speech, when compared to a corresponding location in the right hemisphere. Dehaene-Lambertz and colleagues (2002) tested 3 month-old infants using fMRI and observed increased activation in the left hemisphere relative to the right in response to forward playing speech relative to reversed speech. Similarly, Peña and colleagues (2003) tested neonates for hemispheric dominance using forward speech, reversed speech, and silence. Using a 24-channel NIRS imaging system, these researchers found that 2-5 day old infants exhibited left hemisphere dominance for processing forward, infant-directed speech relative and not for reversed speech. These two studies highlight the left temporal region as a primary area of interest for understanding the neurobiology of language development. However, since the second half of the first year is the period of time during which infants begin to display a wealth of important perceptual abilities with regard to their native language, it is important to extend this research to older infants who are actively engaged with and attending to the experimental stimuli in question. While researchers appreciate that this subsequent stage of language development is important to document both behaviorally and neurophysiologically, research in the latter domain has been limited by the available technology. In light of its flexibility, NIRS provides an ideal mechanism by which to measure hemodynamic responses to linguistic stimuli in awake, behaving older infants
The present study aimed to extend to an older age group the small body of findings that exist on the hemodynamic underpinnings of language processing in very young infants. Neural activation, as estimated based on relative changes in cerebral blood flow, was assessed in infants during exposure to speech coupled with visual stimuli (audiovisual condition) and compared to measurements taken during exposure to visual stimuli alone (visual only condition). Regions of interest were both the primary visual cortex and the left temporal cortex. We expected to observe a dissociation between cortical activity in the temporal region during the audiovisual condition from that observed in that region during the visual only condition. Conversely, we expected to observe comparable levels of neural activity in the primary visual cortex during exposure to both the audiovisual and visual only conditions.
Methods
Participants.
Participants were 35 infants between the ages of 6 and 9 months, 20 male and 15 female (M age = 7 months, 14 days, range = 6 months, 3 days to 9 months, 0 days). Five additional infants were tested but eliminated from the sample because of large artifacts in the optical signal throughout the experimental run due to motion or hair obstruction (N = 3), and failure to obtain more than one useable block of trials (N = 2). Infants’ names were obtained from birth announcements in the local newspaper and commercially produced lists. Parents were contacted by letter and follow-up phone calls. Infants and parents were offered a new toy as compensation for their participation. Informed consent was obtained from the parents before testing began.
Apparatus.
During the experiment, each infant sat on a parent’s or caretaker’s lap in a testing booth. Infants were positioned facing a 53-cm flat panel computer monitor (Macintosh G4) 76 cm away (28.1° visual angle at infants’ viewing distance based on a 36 cm wide screen). The monitor was positioned on a shelf, immediately under which audio speakers and a low-light video camera were positioned, orients towards infants. The monitor was framed by a façade that functioned to conceal the rest of the equipment. The façade was made of three sections. The upper third was a dark black curtain that covered the wall from side to side, and dropped down 84 cm from the ceiling. The middle section, measuring 152 cm (wall to wall horizontally) x 69 cm high, was constructed of plywood and covered with dark black cloth. The plywood had a rectangular hole cut out of its center that coincided with the size of the viewing surface of computer monitor (48 cm diagonal). A dark curtain hung from the bottom edge of the section to the floor. The testing area was separated by a curtain from a control area, where an experimenter controlled the NIRS instrument out of the infant’s view. Fiber optic cables (15 m each) extended from the instrument to the testing booth and into a custom headband on the infant’s head (Figure 1). The cables were bundled into a single strand secured on the wall just over the parent’s right shoulder.
Figure 1.
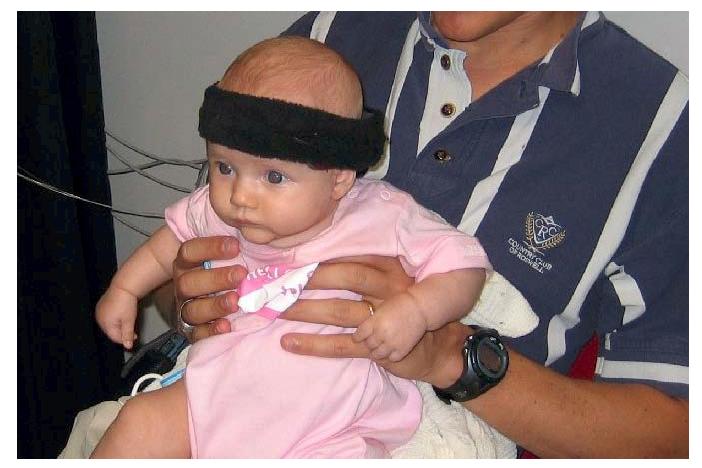
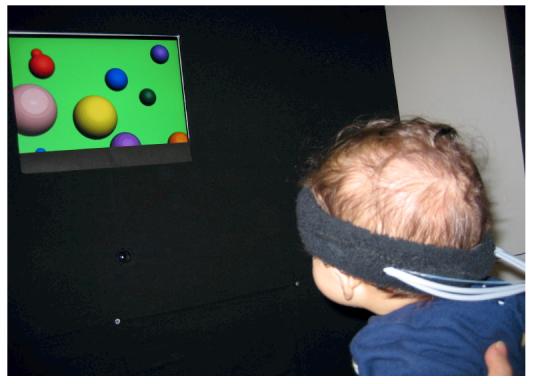
Infant fitted with the NIRS probe (a); infant oriented towards visual stimuli in the testing booth (b).
The NIRS instrument consisted of three major components: (1) two fiber optic cables that delivered near-infrared light to the scalp of the participant (i.e., emitters); (2) four fiber optic cables that detected the diffusely reflected light at the scalp and transmitted it to the receiver (i.e., detectors); and (3) an electronic control box that served both as the source of the near-infrared light and the receiver of the refracted light. The signals received by the electronic control box were processed and relayed to a DELL Inspiron 7000™ laptop computer. A custom computer program recorded and analyzed the signal.
The imaging device used in these studies produced light at 680 and 830 nm wavelengths with two laser-emitting diodes (Boas et al., 2002, TechEn Inc.). Laser power emitted from the end of the fiber was 4 mW. Light was square wave modulated at audio frequencies of approximately 4 to 12 kHz. Each laser had a unique frequency so that synchronous detection could uniquely identify each laser source from the photodetector signal. Any ambient illumination that occurred during the experiment (e.g., from the visual stimuli) did not interfere with the laser signals because environmental light sources modulate at a significantly different frequency. No detector saturation occurred during the experiment.
The light was delivered via fiber optic cables, each 1 mm in diameter and 15 m in length. These originated at the imaging device and terminated in the headband that was placed on the infant’s head. The headband was made of elastic terry-cloth and was fitted with the two light-emitting and four light-detecting emitters and detectors. These were grouped into two emitter/detector sets, each containing two detectors placed at 2 cm distance on either side from the central emitter. One set delivered light to the temporal region at approximately position T3 according to the International 10-20 system, and the other set delivered light to the occipital region between positions O1 and O2 according to the International 10-20 system (see Figure 2).
Figure 2.


Probe design for two regions of interest (a); localization of the probe over T3 (for left temporal measurements) and over O1 and O2 (for occipital measurements) was guided by International 10-20 EEG electrode position classification system (b).
Stimuli and Design.
The stimuli consisted of speech recordings and visual animations. Infants first saw a blank (dark) screen for 20 seconds before stimulus presentation began. Stimulus presentation proceeded as follows: 20 seconds of visual animation, 10 seconds of silence with a blank screen, 20 seconds of speech with visual animation, 10 seconds of silence with a blank screen. This sequence repeated five times over the course of the experiment. The initial visual trial and the baseline period preceding it served to familiarize the infant with the procedure and were not included in analyses. Likewise, the final audiovisual trial and baseline period were excluded. This design resulted in four, 60-second blocks per infant, with each block consisting of an audiovisual trial (20 s), the subsequent baseline interval (10 s), a visual trial (20 s), and the subsequent baseline interval (10 s).
The content of each speech segment was different, but all contained speech from the same speaker with the same general intonation variation and affective tone. The voice recordings were made by a female speaker relaying a children’s story using highly animated, infant-directed speech. Recordings were made using a Sony digital camcorder, and then converted to .wav sound files using Sound Forge 6.0™ audio editing software. The visual stimuli were distinct across trials, but each consisted of animations that were similar in color contrast and motion parameters. They consisted of simple, 3-dimensional objects (e.g., spirals, circles, and rectangles) that rotated and moved slowly in front of a high-contrast, colored background. The animations were produced using 3-D Studio Max™ computer graphics software. The auditory and animated digital files were combined using Adobe Premier 6.5™ video editing software, which produced .avi movie files that were then recorded onto a blank DVD. The recorded DVD was then played for through the computer monitor and speakers. The hidden speakers were 82 cm from infants, facing them and producing audio stimuli at 75 decibels when measured from the approximate location of the infant.
Procedure.
After the parent and infant were seated, a head circumference measurement was taken from the infant using a standard cloth tape measure. Each parent was instructed to refrain from talking and interacting with the infant during the course of the experiment, and to hold the infant up so that they were able to comfortably view the screen. Parents were also asked to guide infants’ hands down and away from the headband if they began to reach up during the experiment. The experimenter then placed the NIRS headband on the infant. Following the 10-20 system, the occipital set was placed first on the nasion/inion center line of the scalp, about 1-2 cm above the inion, between O1 and O2 positions. The temporal set was then adjusted over the left temporal area, above and slightly anterior to the T3 position. The experimenter moved to the control area. The room lights in both the experimental and control areas were turned off, leaving only a low intensity light to sufficiently illuminate the experimental area, and light from the computer monitor to light the control area. The emitter source lights of the imaging device were turned on, and optical recordings began. At this time, stimulus presentation began as well. Infants were video recorded for the duration of the experimental session for off-line coding of looking-times.
Results
Looking time data.
The length of time infants spent towards the audiovisual and visual events was coded by two observers. Looking times were calculated for each 20-second trial, and a grand average was computed for visual and audiovisual conditions. Looking times during baseline periods were not calculated. The average looking time during the visual only condition was 17.8 seconds (SD = 1.3). The average looking time during the audiovisual condition was 18.3 (SD = 1.7). Interobserver agreement was measured for all infants and averaged 95% per test trial per infant. Because infants’ failure to visually attend to the event could result in a decrease in hemodynamic response in the primary visual and/or temporal cortex, we rejected data blocks in which the infant (a) cumulated less than 10 s total looking time per trial or (b) looked away from the display for more than 5 consecutive seconds. No infants who completed the experiment met these behavioral criteria and therefore no trials were excluded for any of the infants based on looking times.
Optical data.
NIRS data collected from the two regions of interest for each of the two stimulus conditions were analyzed the same way. The two detectors located over each cortical region recorded the raw optical signals for subsequent digitization at 200 Hz for each of the four channels. The NIRS apparatus converted the signals to optical density units, which were digitally low-pass filtered at 10.0 Hz for noise reduction, and decimated to 20 samples per second. The control computer then converted the data to relative concentrations of oxygenated (HbO2) and deoxygenated (HbR) hemoglobin using the modified Beer-Lambert law (Strangman et al., 2002a), which calculates the relationship between light absorbance and concentration of particles within a medium. HbO2 and HbR were first plotted across the four 60 s time blocks composed of the following components: the entire 20 s audiovisual trial, the 10 s baseline period, the entire 20 s visual only trial, and the 10 s baseline period. Artifacts originating in infant physiology and movement were spatially filtered using a principle components analysis (PCA) of the signals across the four channels (Zhang et al., 2005; Wilcox et al., 2005). This approach is based on the assumption that systemic components of interference are spatially global and have higher energy than the signal changes evoked by the perceptual stimuli themeselves (Zhang et al., 2005). Further filtering was conducted to eliminate “motion artifacts,” objectively defined as a signal change greater than 5% in a tenth of second. This second filtering step resulted in the removal of a total of 29 blocks (of 140 possible) for an average of 3.17 useable blocks per infant, with all infants providing at least two. Optical signals were averaged across blocks for each infant, and then grand averaged across infants. Concentration changes were then calculated to allow for statistical comparison of the average response to each stimulus condition (audiovisual and visual) in each cortical region (occipital and temporal).
Hemodynamic response functions and analyses.
Figure 3 shows data collected from the left temporal and bilateral occipital regions of one infant across the entire experimental run. This figure illustrates optical density data across the experimental run and concentration conversions averaged across 60-s blocks within the run. On the left side of Figure 3 are two horizontal illustrations showing the 4-block design flanked by the initial and final trials (not included in analyses) spanning 300 seconds (x-axis). Occipital and temporal regions each had one light emitter (emitting the two wavelengths of light) and two light detectors, as indicated by the y-axis on the far left of the figures. The top left graph plots optical density changes in the infant’s occipital region, while the bottom data plots optical density changes in the infant’s temporal region. The red bars indicate each 20-s audiovisual trial and the pink bars indicate each 20-s visual trial. No-stimulus baseline periods (10 s) follow each trial and are not marked.
Figure 3.

An individual infant’s data. The top left graph shows optical density changes from baseline in the occipital region over 300 seconds for 830 nm (HbO2) and 690 nm (HbR). The bottom left graph shows optical density changes in the temporal region. Onset of each 20 s audiovisual trial is indicated by a red bar; onset of each 20 s visual trial is indicated by a pink bar. These alternate with 10 s no-stimulus baseline intervals (not marked). Graphs on the right reflect conversion of optical density to relative concentrations of oxygenated and deoxygenated hemoglobin, averaged across a maximum of four 60 s blocks (20 s audiovisual trial + 10 s baseline interval + 20 s visual trial + 10 s baseline interval). The top right graph shows the bilateral occipital response; the bottom right graph shows the left temporal response. The y-axes of both graphs indicate relative changes in concentration (micromolar) of HbO2 and HbR.
The graphs on the right of Figure 3 display the optical data once converted into relative concentrations of oxygenated and deoxygenated hemoglobin and averaged across each of the four blocks for this infant. The y-axis of each graph on the right indicates relative concentration changes of HbO2 (in red, based on the 830 nm wavelength) and HbR (in blue, based on the 690 nm wavelength). The solid red bar indicates audiovisual trials and the solid pink bar indicates visual trials. Both occipital and temporal regions show an increase in HbO2 during audiovisual trials, while only the occipital region shows an increase in HbO2 during the visual trials. Interestingly, the hemodynamic response in the temporal region during the audiovisual condition shows a delayed return to baseline, such that HbO2 remains elevated beyond the no-stimulus baseline, only recovering during the subsequent (visual only) condition. The basis for this late recovery will be addressed in the general discussion.
Since there was no indication that one channel was preferentially activated over another in either cortical region, and because there remains some uncertainty about the relationship between the 10-20 coordinates and underlying brain coordinates, optical data were summed across the two channels per region. Figure 4 illustrates the hemodynamic response function across the 60-s blocks for each region across infants. These functions are based on the average response across the two channels of data collected within each region for each infant. The overall hemodynamic response during the audiovisual segments (initial 20 s) is indicated by the solid red bar. This response was pronounced for both the occipital and the temporal regions, with a marked increase in HbO2. The overall hemodynamic response during the visual segments is indicated by the solid pink bar (onset at time 30 s), following the unmarked 10 s baseline. Notably, only the occipital region shows an increase in HbO2 during this condition, consistent with that seen in both regions during the audiovisual trials. The temporal region shows no such response during the visual only condition. It is worth noting that while the hemodynamic response in the occipital region completely returns to baseline prior to the onset of the subsequent (audiovisual) condition, the hemodynamic activity in the temporal region evoked during the audiovisual trials fails to completely recover during the baseline period and only does so during the subsequent visual trials. We will return to this issue in the general discussion.
Figure 4.

Grand average hemodynamic (HbO2, HbR, and HbT) response curves across 60-s blocks by cortical region. Audiovisual segments are indicated by the solid red bar (onset at time 0 s); visual segments are indicated by the solid pink bar (onset at time 30 s). Each trial was followed by a 10 s (no-stimulus) baseline interval. The y-axis indicates relative changes in concentration (micromolar) of the different chromophores.
Statistical analyses were performed on average changes in concentration of HbO2 within a cortical region, as this chromophore provided the most robust contrast-to-noise ratio across infants. Because changes in concentration began manifesting 2-3 seconds after stimulus onset and showed signs of abating near the stimulus offset, concentration change was calculated by measuring the average relative HbO2 concentration during the 10-20 second period for each stimulus trial and comparing it the relative HbO2 concentration at time -2 to 0 seconds (baseline) prior to the trial. A 2 (cortical region) x 2 (stimulus condition) within-subjects ANOVA revealed significant changes in concentration of HbO2 by region, F(1, 34) = 6.49, p <.05, and by stimulus condition, F(1,34) = 6.74, p <.05. There was also a significant interaction between region of interest and stimulus condition, F(1,34) = 27.71, p <.01. Figure 5 shows the average HbO2 concentration change in the two regions (temporal and occipital cortex) given the two stimulus conditions (audiovisual and visual stimuli) relative to the no-stimulus baseline. Paired t-tests (two-tailed) were conducted to compare changes in HbO2 concentration by region and by condition. A paired comparison revealed a significant difference in concentration change between the occipital and temporal regions during the visual only condition t(34) = 4.49, p <.001, as well as within the temporal region during the two different stimulus conditions t(34) = 4.50, p <.001. Together, these results demonstrate a dissociation of regions in the infant brain given changes in processing modality.
Figure 5.

Bar graph illustrates average change (and standard error) in HbO2 concentration (micromolar) from time -2 to 0 seconds (baseline) to 10-20 seconds (second half of trial) for each stimulus condition and cortical region.
Discussion
Results from the present study support the feasibility of NIRS as a tool for tracking neural activity in awake, behaving infants. Results demonstrate robust and reliable patterns of activation in the left temporal and primary visual regions of the neocortex during exposure to sensory specific material. Significant increases in HbO2 were observed in the left temporal region during exposure to continuous speech (e.g., in the audiovisual condition) relative to baseline periods (e.g., periods during which neither audio nor visual stimuli were presented), as well as relative to the hemodynamic changes observed during exposure to visual stimuli alone. The left temporal region is well established as a primary area for language processing in adults. The current investigation confirms recent findings with very young infants (e.g., Dehaene-Lambertz et al., 2002; Peña et al., 2003) that exposure to linguistic stimuli also results in increases in hemodynamic activity in the temporal region and that NIRS technology can be used to track the activity with this population. Our current findings extend the application of the technology to older infants. Furthermore, we have demonstrated a dissociation of sensory processing in two specific cortical regions, the temporal and occipital areas. By extending the application of NIRS to the processing of multiple modalities, we have demonstrated the utility of this technology for establishing the nature of the neurophysiological processes underlying a variety of perceptual abilities.
Data from the current study demonstrate local concentrations of oxyhemoglobin (HbO2) increasing in dedicated processing regions, a finding that is consistent with our previous work using this technology (e.g., Wilcox et al., 2005). This pattern of hemodynamic activity is consistent with other research on the relationship between neural activity and cerebral hemodynamics (Bartocci et al., 2000; Hoshi and Tamura, 1993; Jasdzewski et al., 2003; Obrig et al., 1996; Strangman et al., 2003). As was noted, however, researchers occasionally observe an increase, rather than a decrease, in HbR (e.g., Strangman et al., 2003). When seen in infants, such a result is generally attributed to their immature developmental status, and thus, immature hemodynamic responses in particular cortical regions. Such a pattern emerges in the current data. Specifically, the hemodynamic response in infants’ temporal region during exposure to audiovisual stimuli shows a late recovery. This manifests as HbO2 returning to baseline only during the subsequent stimulus condition, while at the same time HbR appears to increase. The appropriate characterization of this pattern of responses remains unclear. The delayed return to baseline may reflect infants’ reduced ability to switch focused attention from one modality to another, resulting in continued neural activity in the temporal cortex despite the cessation of the linguistic component of the stimuli. On the other hand, the apparent increase in HbR may be due to immature neurovascular coupling, whereby heightened demand for visual processing directs the supply of HbO2 away from the temporal cortex and towards the visual cortex (the so-called plumbing problem). Such issues currently remain unresolved and highlight the importance of additional research to elucidate the nature of infant hemodynamics.
Another piece of information that emerges from the current findings is the importance of specific methodological manipulations to capture various stages of hemodynamic activity in the immature brain. Here we focused on two cortical regions, the left temporal and the primary visual areas. Incorporating two distinct stimulus conditions within a single experimental run allowed us to dissociate activity in these two cortical regions within the same group of infants. Given the problems inherent in making comparisons between groups of participants in this kind of research, this is an important methodological advancement. Furthermore, since visual stimuli are frequently used to maintain infants’ attention in developmental research, understanding the interplay of different perceptual modalities, both attentionally and hemodynamically, is fundamental. While the current study is the first to dissociate hemodynamic activity in infants during exposure to both audiovisual and visual stimuli, future research will need to identify differences in patterns of activity given exposure to auditory stimuli with and without accompanying visual stimuli. Additional issues may also influence the hemodynamics of multimodal processing in infants, such as the perceptual coherence of the stimuli (e.g., Calvert, 2001).
The findings presented here raise important questions about the selection of cortical regions of interest in infants, given the specific perceptual questions being asked. In the current study, we aimed to establish the differential effects of visual stimuli with and without auditory stimuli on infant hemodynamics, and we were able to dissociate hemodynamic changes induced by exposure to linguistic stimuli from those induced by unrelated visual stimuli in the infant brain. This is an important first step in our examination of the neurobiology of perceptual development, in general, and language development, in particular. Further research with NIRS will be needed to examine other important issues, such as whether there is varying lateralization of auditory processing across the first year of life. Nonetheless, the current study demonstrates the wealth of information available through the application of this technology to the study of infant perception and cognition.
Acknowledgements
This research was supported by grants from the James S. McDonnell Foundation 21st Century Research Award, Bridging Brain, Mind, and Behavior and from HD046533 to Heather Bortfeld and P41-RR14075 to David Boas. We would like to thank the undergraduate assistants in the Lil‘ Aggies’ Language Learning Laboratory at Texas A&M University for their help with data collection and the parents who so graciously agreed to have their infants participate in the research.
References
- Baird AA, Kagan J, Gaudette T, Walz KA, Hershlag N, Boas DA. Frontal lobe activation during object permanence: Data from near-infrared spectroscopy. NeuroImage. 2002;16:1120–1126. doi: 10.1006/nimg.2002.1170. [DOI] [PubMed] [Google Scholar]
- Bartocci M, Winberg J, Ruggiero C, Bergqvist LL, Serra G, Lagercrantz H. Activation of olfactory cortex in newborn infants after odor stimulation: A functional near-infrared spectroscopy study. Pediatric Research. 2000;48:18–23. doi: 10.1203/00006450-200007000-00006. [DOI] [PubMed] [Google Scholar]
- Bartocci M, Winberg J, Papendieck G, Mustica T, Serra G, Lagercrantz H. Cerebral hemodynamic response to unpleasant odors in the preterm newborn measured by near-infrared spectroscopy. Pediatric Research. 2001;50:324–330. doi: 10.1203/00006450-200109000-00006. [DOI] [PubMed] [Google Scholar]
- Boas DA, Franceschini MA, Dunn AK, Strangman G. Noninvasive imaging of cerebral activation with diffuse optical tomography. In: Frostig RD, editor. In Vivo Optical Imaging of Brain Function. CRC Press; Boca Raton: 2002. pp. 193–221. [PubMed] [Google Scholar]
- Calvert GA. Crossmodal processing in the human brain: Insights from functional neuroimaging studies. Cerebral Cortex. 2001;11:1110–1123. doi: 10.1093/cercor/11.12.1110. [DOI] [PubMed] [Google Scholar]
- Chen S, Sakatani K, Lichty W, Ning P, Zhao S, Zuo H. Auditory-evoked cerebral oxygenation changes in hypoxic-ischemic encephalopathy of newborn infants monitored by near infrared spectroscopy. Early Human Development. 2002;67:113–121. doi: 10.1016/s0378-3782(02)00004-x. [DOI] [PubMed] [Google Scholar]
- Chen Y, Zhou S, Xie C, Nioka S, Delivoria-Papadopoulos M, Anday EB. Preliminary evaluation of dual wavelength phased array imaging on neonatal brain function. Journal of Biomedical Optics. 2000;5:194–200. doi: 10.1117/1.429986. [DOI] [PubMed] [Google Scholar]
- Cooper PR, Abraham J, Berman S, Staska M. The development of infant preference for motherese. Infant Behavior and Development. 1997;20:477–488. [Google Scholar]
- Cutler A. Exploiting prosodic probabilities in speech segmentation. In: Altmann GTM, editor. Cognitive models of speech processing: Psycholinguistic and computational perspectives. MIT Press; Cambridge, MA: 1990. pp. 105–121. [Google Scholar]
- de Haan M, Johnson MH. The Cognitive Neuroscience of Development. Psychology Press; 2003. [Google Scholar]
- DeCasper AJ, Fifer WP. Of human bonding: Newborns prefer their mothers’ voices. Nature. 1980;208:1174–1176. doi: 10.1126/science.7375928. [DOI] [PubMed] [Google Scholar]
- Dehaene-Lambertz G, Dehaene S, Hertz-Pannier L. Functional neuroimaging of speech perception in infants. Science. 2002;298:2013–2015. doi: 10.1126/science.1077066. [DOI] [PubMed] [Google Scholar]
- Eimas PD, Siqueland ER, Jusczyk P, Vigorito J. Speech perception in infants. Science. 1971;171:303–306. doi: 10.1126/science.171.3968.303. [DOI] [PubMed] [Google Scholar]
- Gottlieb G, Krasnegor N, editors. Measurement of Audition and Vision During the First Year of Postnatal Life: A Methodological Overview. Ablex; Norwood, NJ: 1985. [Google Scholar]
- Gratton G, Goodman-Wood MR, Fabiani M. Comparison of neuronal and hemodynamic measures of the brain response to visual stimulation: An optical imaging study. Human Brain Mapping. 2001;13:13–25. doi: 10.1002/hbm.1021. [DOI] [PMC free article] [PubMed] [Google Scholar]
- Gratton G, Sarno A, Maclin E, Corballis PM, Fabiani M. Toward noninvasive 3-D imaging of the time course of cortical activity: Investigation of the depth of the event-related optical signal. NeuroImage. 2000;11:491–504. doi: 10.1006/nimg.2000.0565. [DOI] [PubMed] [Google Scholar]
- Grinvald A, Bonhoeffer T, Malonek D, Shoham D, Bartfeld E, Arieli A, Hildesheim R, Ratzlaff E. Optical imaging of architecture and function in the living brain. In: Grinvald A, Bonhoeffer T, Malonek D, editors. Oxford University Press; New York: 1991. pp. 49–85. [Google Scholar]
- Hintz SR, Benaron DA, Siegel AM, Zourabian A, Stevenson DK, Boas DA. Bedside functional imaging of the premature infant brain during passive motor activation. Journal Perinatal Medicine. 2001;29:335–343. doi: 10.1515/JPM.2001.048. [DOI] [PubMed] [Google Scholar]
- Hohne EA, Jusczyk PW. Two-month-old infants’ sensitivity to allophonic differences. Perception and Psychophysics. 1994;56:613–623. doi: 10.3758/bf03208355. [DOI] [PubMed] [Google Scholar]
- Hoshi Y, Tamura M. Dynamic multichannel near-infrared optical imaging of human brain activity. Journal of Applied Physiology. 1993;75:1842–1846. doi: 10.1152/jappl.1993.75.4.1842. [DOI] [PubMed] [Google Scholar]
- Jasdzewski G, Strangman G, Wagner J, Kwong KK, Poldrack RA, Boas DA. Differences in the hemodynamic response to event-related motor and visual paradigms as measured by near-infrared spectroscopy. NeuroImage. 2003;20:479–488. doi: 10.1016/s1053-8119(03)00311-2. [DOI] [PubMed] [Google Scholar]
- Jusczyk PW. The discovery of spoken language. MIT Press; Cambridge, MA: 1997. [Google Scholar]
- Jusczyk PW, Cutler A, Redanz NJ. Infants’ preference for the predominant stress patterns of English words. Child Development. 1993;64:675–687. [PubMed] [Google Scholar]
- Jusczyk PW, Luce PA, Charles-Luce J. Infants’ sensitivity to phonotactic patterns in the native language. Journal of Memory and Language. 1994;33:630–645. [Google Scholar]
- Kato T, Kamei A, Takashima S, Ozaki T. Human visual cortical function during photic stimulation monitoring by means of near-infrared spectroscopy. Journal of Cerebral Blood Flow and Metabolism. 1993;13:516–520. doi: 10.1038/jcbfm.1993.66. [DOI] [PubMed] [Google Scholar]
- Kemler-Nelson DG, Jusczyk PW, Mandel DR, Myers J, Turk A, Gerken L. The headturn preference procedure for testing auditory perception. Infant Behavior and Development. 1995;18:111–116. [Google Scholar]
- Kleinschmidt A, Obrig H, Requardt M, Merboldt KD, Dirnagl U, Villringer A, Frahm J. Simultaneous recording of cerebral blood oxygenation changes during human brain activation by magnetic resonance imaging and near-infrared spectroscopy. Journal of Cerebral Blood Flow and Metabolism. 1996;16:817–826. doi: 10.1097/00004647-199609000-00006. [DOI] [PubMed] [Google Scholar]
- Meek JH. Basic principles of optical imaging and application to the study of infant development. Developmental Science. 2002;5:371–380. [Google Scholar]
- Meek JH, Noone M, Elwell CE, Wyatt JS. Visually evoked haemodynamic responses in infants with cerebral pathology. Pediatric Research. 1999a;45:909. [Google Scholar]
- Meek JH, Firbank M, Elwell CE, Atkinson J, Braddick O, Wyatt JS. Regional hemodynamic responses to visual stimulation in awake infants. Pediatric Research. 1998;43:840–843. doi: 10.1203/00006450-199806000-00019. [DOI] [PubMed] [Google Scholar]
- Meek JH, Elwell CE, McCormick DC, Edwards AD, Townsend JP, Steward AL, Wyatt JS. Abnormal cerebral haemodynamics in perinatally asphyxiated neonates related to outcome. Archives of Disease in Childhood. 1999b;81:F110–F115. doi: 10.1136/fn.81.2.f110. [DOI] [PMC free article] [PubMed] [Google Scholar]
- Mehler J, Jusczyk PW, Lambertz G, Halsted G, Bertoncini J, Amiel-Tison C. A precursor of language acquisition in young infants. Cognition. 1988;29:143–178. doi: 10.1016/0010-0277(88)90035-2. [DOI] [PubMed] [Google Scholar]
- Morgan JL. A rythmic bias in preverbal speech segmentation. Journal of Memory and Language. 1996;35:666–688. [Google Scholar]
- Obrig H, Wolf T, Döge C, Hülsing JJ, Dirnagl U, Villringer A. Cerebral oxygen changes duringmotor and somatosensory stimulation in humans, as measured by near-infrared spectroscopy. Advances in Experimental Medicine and Biology. 1996;388:219–224. doi: 10.1007/978-1-4613-0333-6_27. [DOI] [PubMed] [Google Scholar]
- Peña M, Maki A, Kovacić D, Dehaene-Lambertz G, Koizumi H, Bouquet F, Mehler J. Sounds and silence: an optical topography study of language recognition at birth. Proceedings of the National Academy of Sciences of the United States of America. 2003;100:11702–11705. doi: 10.1073/pnas.1934290100. [DOI] [PMC free article] [PubMed] [Google Scholar]
- Saffran JR, Aslin RN, Newport EL. Statistical learning by 8-month-old infants. Science. 1996;274:1926–1928. doi: 10.1126/science.274.5294.1926. [DOI] [PubMed] [Google Scholar]
- Sakatani K, Chen S, Lichty W, Zuo H, Wang Y. Cerebral blood oxygenation changes induced by auditory stimulation in newborn infants measured by near infrared spectroscopy. Early Human Development. 1999;55:229–236. doi: 10.1016/s0378-3782(99)00019-5. [DOI] [PubMed] [Google Scholar]
- Siqueland ER, DeLucia CA. Visual reinforcement of nonnutritive sucking in human infants. Science. 1969;165:1144–1146. doi: 10.1126/science.165.3898.1144. [DOI] [PubMed] [Google Scholar]
- Soul JS, du Plessis AJ. New technologies in pediatric neurology: Near-infrared spectroscopy. Seminars in Pediatric Neurology. 1999;6:101–110. doi: 10.1016/s1071-9091(99)80036-9. [DOI] [PubMed] [Google Scholar]
- Stager CL, Werker JF. Infants listen for more phonetic detail in speech perception than in word-learning tasks. Nature. 1997;388:381–382. doi: 10.1038/41102. [DOI] [PubMed] [Google Scholar]
- Strangman G, Boas DA, Sutton JP. Non-invasive neuroimaging using near-infrared light. Biological Psychiatry. 2002a;52:679–693. doi: 10.1016/s0006-3223(02)01550-0. [DOI] [PubMed] [Google Scholar]
- Strangman G, Franceschini MA, Boas DA. Factors affecting the accuracy of near-infrared spectroscopy concentration calculations for focal changes in oxygenation parameters. NeuroImage. 2003;18:865–879. doi: 10.1016/s1053-8119(03)00021-1. [DOI] [PubMed] [Google Scholar]
- Strangman G, Culver JP, Thompson JH, Boas DA. A quantitative comparison of simultaneous BOLD fMRI and NIRS recordings during function brain activation. NeuroImage. 2002b;17:719–731. [PubMed] [Google Scholar]
- Taga G, Asakawa K, Maki A, Konishi Y, Koizumi H. Brain imaging in awake infants by near-infrared optical topography. Proceedings of the National Academy of Sciences of the United States of America. 2003;100:10722–10727. doi: 10.1073/pnas.1932552100. [DOI] [PMC free article] [PubMed] [Google Scholar]
- Trehub SE. Infants’ sensitivity to vowel and tonal contrasts. Developmental Psychology. 1973;9:91–96. [Google Scholar]
- Villringer A, Dirnagl U. Coupling of brain activity and cerebral blood flow: Basis of functional imaging. Cerebrovascular and Brain Metabolism Reviews. 1995;7:240–276. [PubMed] [Google Scholar]
- Villringer A, Chance B. Non-invasive optical spectroscopy and imaging of human brain function. Trends in Neuroscience. 1997;20:435–442. doi: 10.1016/s0166-2236(97)01132-6. [DOI] [PubMed] [Google Scholar]
- Villringer A, Minoshima S, Hock C, Obrig H, Ziegler S, Dirnagl U, et al. Assessment of local brain activation. A simultaneous PET and near-infrared spectroscopy study. Advance in Experimental Medical Biology. 1997;413:149–153. [PubMed] [Google Scholar]
- Werker J, Tees RC. Cross-language speech perception: Evidence for perceptual reorganization during the first year of life. Infant Behavior and Development. 1984;7:49–63. [Google Scholar]
- Wilcox T, Bortfeld H, Woods R, Wruck E, Boas DA. Using near-infrared spectroscopy to assess neural activation during object processing in infants. Journal of Biomedical Optics. 2005;10 doi: 10.1117/1.1852551. [DOI] [PMC free article] [PubMed] [Google Scholar]
- Zaramella P, Freato F, Amigoni A, Salvadori S, Marangoni P, Suppjei A, Schiavo B, Lino C. Brain auditory activation measured by near-infrared spectroscopy (NIRS) in neonates. Pediatric Research. 2001;49:213–219. doi: 10.1203/00006450-200102000-00014. [DOI] [PubMed] [Google Scholar]
- Zhang Y, Brooks DH, Franceschini MA, Boas DA. Eigenvector-based spatial filtering for reduction of physiological interference in diffuse optical imaging. Journal of Biomedical Optics. 2005;10 doi: 10.1117/1.1852552. [DOI] [PubMed] [Google Scholar]