Abstract
To explore the role of the brush-like proteoglycan, aggrecan, in the shear behavior of cartilage tissue, we measured the lateral resistance to deformation of a monolayer of chemically end-attached cartilage aggrecan on a microcontact printed surface in aqueous NaCl solutions via lateral force microscopy. The effects of bath ionic strength (IS, 0.001–1.0 M) and lateral displacement rate (∼1–100 μm/s) were studied using probe tips functionalized with neutral hydroxyl-terminated self-assembled alkanethiol monolayers. Probe tips having two different end-radii (R ∼50 nm and 2.5 μm) enabled access to different length-scales of interactions (nano and micro). The measured lateral force was observed to depend linearly on the applied normal force, and the lateral force to normal force proportionality constant, μ, was calculated. The value μ increased (from 0.03 ± 0.01 to 0.11 ± 0.01) with increasing bath IS (0.001–1.0 M) for experiments using the microsized tip due to the larger compressive strain of aggrecan that resulted from increased IS at constant compressive force. With the nanosized tip, μ also increased with IS but by a smaller amount due to the fewer number of aggrecan involved in shear deformation. The variations in lateral force as a function of applied compressive strain ɛn and changes in bath IS suggested that both electrostatic and nonelectrostatic interactions contributed significantly to the shear deformational behavior of the aggrecan layers. While lateral force did not vary with lateral displacement rate at low IS, where elastic-like electrostatic interactions between aggrecan dominated, lateral force increased significantly with displacement rate at physiological and higher IS, suggestive of additional viscoelastic and/or poroelastic interactions within the aggrecan layer. These data provide insights into molecular-level deformation of aggrecan macromolecules that are important to the understanding of cartilage behavior.
INTRODUCTION
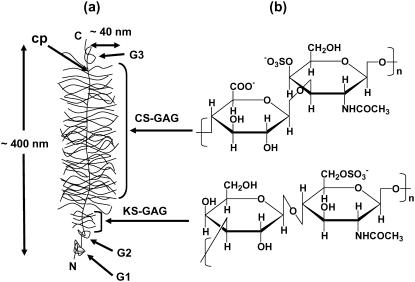
Articular cartilage is a specialized connective tissue found at the surfaces of bones in synovial joints. Cartilage macromolecular composition and structure (1) is optimized to sustain a complex combination of compressive, shear, and tensile loads that exist during joint motion (2,3). The major extracellular matrix proteoglycan, aggrecan, which comprises 30–35% of the tissue dry weight, is thought to play a critical role in proper biomechanical functioning of cartilage in response to compressive (4) and shear (5) loads. Aggrecan is a polyelectrolyte having a bottle-brush structure (Fig. 1), consisting of a core protein (contour length ∼400 nm) with ∼100 covalently bound chondroitin sulfate glycosaminoglycan (CS-GAG) chains (contour length ∼40 nm) that are closely spaced (2–4 nm) and negatively charged, along with smaller keratan sulfate GAGs and oligosaccharides (6,7). Within cartilage tissue, aggrecan is bound noncovalently at its G1 globular domain to the higher molecular weight GAG chain, hyaluronan (HA), stabilized by link protein (8).
FIGURE 1.
(a) Schematic representation of the structure of aggrecan (contour length ∼400 nm), illustrating the core protein backbone (cp) and its three globular domains (G1, G2, G3), and the grafted chondroitin sulfate (CS) and keratan sulfate (KS) glycosaminoglycan (GAG) side chains. CS-GAG contour length ∼40 nm, intermolecular spacing ∼2–4 nm; N = N-terminal; C = C-terminal. (b) Disaccharide constituents of chondroitin-4-sulfate GAG and KS-GAG.
Nanomechanical studies of cartilage and its extracellular matrix components have shown the potential to link molecular structure and interactions to tissue-level biomechanical properties. Recently, we reported the use of atomic force microscope (AFM)-based instruments to quantify the compressive nanoscale deformation between opposing chemically end-grafted monolayers of CS-GAGs (9,10) and aggrecan (11,12). These biomimetic model systems demonstrated highly nonlinear nanomechanical behavior, with the aggrecan layer stiffness increasing more rapidly with strain than that of CS-GAG layer. The contribution of electrostatic interactions to the compressive stiffness of the CS-GAG (10) and aggrecan (12) layers was well described by a Poisson-Boltzmann-based model representing GAG chains as finite length charged rods (13). In other related studies, nanoindentation of intact porcine cartilage was performed using microsized colloidal probe tips to measure the tissue's aggregate dynamic compressive modulus (∼2.6 MPa), while the use of sharp pyramidal nanosized probe tips gave values ∼100-fold lower (∼0.02 MPa) and were thought to be more indicative of molecular fine structure (14,15). Nanoindentation was also used to detect changes in tissue-level properties after enzymatic digestion of collagen and proteoglycan moieties (14), during the process of osteoarthritis degradation (16), and cartilage tissue repair (14,15). Single molecule force-extension measurements on HA (17,18) and CS-GAG (18) have been performed using optical tweezers (17) and AFM (18), respectively, giving estimates of the persistence length in near-physiological aqueous solution conditions. With the goal of providing insights into joint lubrication mechanisms (19), the frictional properties of HA have been quantified using the surface force apparatus (SFA) via covalent attachment of HA to lipid bilayers on mica (20) and electrostatic adsorption of HA on quaternized poly(4-vinylpyridine) (21) or lipid bilayers (22) on mica. AFM using microscale probe tips has also been used to measure the frictional coefficient of the surface of bovine articular cartilage in the presence and absence of the superficial zone (23), and found that it was similar to macroscale results (23,24).
While the compressive and tensile stiffness of cartilage extracellular matrix constituents have been studied at the molecular level, the molecular contributions to cartilage shear properties have received less attention. It is recognized from tissue-level biomechanical studies that aggrecan and GAG intermolecular interactions play an important role in resisting shear deformation of cartilage (5,25,26), given the high density of aggrecan within the tissue (20–80 mg/mL (27)). In addition, the known ionic strength dependence of the torsional shear modulus of cartilage disks was well predicted by a Poisson-Boltzmann-based unit cell model of GAG-GAG electrostatic interactions (5). Hence, the objective of this study was to quantify the nanoscale lateral deformation behavior of chemically end-grafted aggrecan monolayers to better understand the origins of tissue-level shear behavior (as opposed to surface lubrication).
Toward this end, lateral force microscopy (LFM) was carried out on microcontact printed planar substrates (28) of chemically end-grafted fetal bovine cartilage aggrecan prepared at high physiological densities with surface molecular separation distances ∼25 nm (12). Nanosized (end-radius, R ∼ 50 nm) and microsized (R ∼ 2.5 μm) probe tips functionalized with neutral hydroxyl-terminated self-assembled monolayers (OH-SAMs) were employed to study lateral nanomechanics at different length scales where the interactions involved either a few or a large ensemble (∼103) of aggrecan molecules (12). Lateral force was measured as a function of normal compressive force (∼0–80 nN), enabling the determination of the lateral proportionality constant, μ, in NaCl solutions of varied ionic strength (0.001–1.0 M, pH ∼5.6). The use of microcontact printed surfaces enabled the simultaneous measurement of aggrecan height (and hence, conformation and compressive normal strain) with lateral and normal force. Results using probe tips having differing surface chemistries suggested that the contribution of interfacial adhesion between the aggrecan layer and probe tip to the measured lateral force were very small compared to the effects of aggrecan deformation. To help isolate the effects of electrostatic and nonelectrostatic interactions on the resistance of aggrecan to lateral deformation, lateral forces were measured as a function of aggrecan height at different bath ionic strengths. Height was then converted to effective normal strain, ɛn, and the measured lateral force was estimated as a function of the ratio of the average GAG-GAG spacing to the characteristic electrical Debye length at each ionic strength. (Electrostatic interactions become relatively more important as this ratio becomes smaller.) The underlying time-independent (elastic-like) and time-dependent (e.g., visco/poroelastic) deformation mechanisms were also explored by comparing the lateral forces measured at different probe tip displacement rates.
METHODS
Sample and probe tip preparation and characterization
Purified fetal bovine epiphyseal A1A1D1D1 aggrecan, MW ∼3 MDa (7) was chemically functionalized with thiol-groups, as described previously (11). Microcontact printed (28) samples were prepared where aggrecan was chemically end-grafted within hexagonal patterns (10-μm side length), and a hydroxyl-terminated self-assembled monolayer (OH-SAM, 11-mercaptoundecanol, HS(CH2)11OH, Aldrich, St. Louis, MO), was functionalized outside the hexagonal patterns, as described previously (11). The aggrecan packing density was one monomer per ∼25 nm × 25 nm square (measured using the dimethylmethylene blue dye binding assay (29)). Samples were characterized using contact mode AFM imaging in NaCl solutions at different ionic strengths to visualize the height differences between the aggrecan-OH-SAM pattern using both the OH-SAM functionalized nanosized and microsized probe tips (11,12). Patterned control substrates of carboxyl- and amine-terminated SAMs (COOH-SAM and NH2-SAM) were prepared in a similar fashion via microcontact printing using 3 mM 11-mercaptoundecanoic acid, HS(CH2)10COOH (Aldrich), and 2-aminoethanethiol hydrochloride, HS(CH2)2NH2·HCl (Aldrich, 24 h incubation), both in ethanol. These control samples were imaged by lateral force microscopy in 0.01 M NaCl at pH ∼2.4 and 10.3 (pH values were adjusted using HCl and NaOH) to measure the lateral forces between the probe tip and the samples (for reviews of measuring friction forces on SAMs via LFM, see (30–33)).
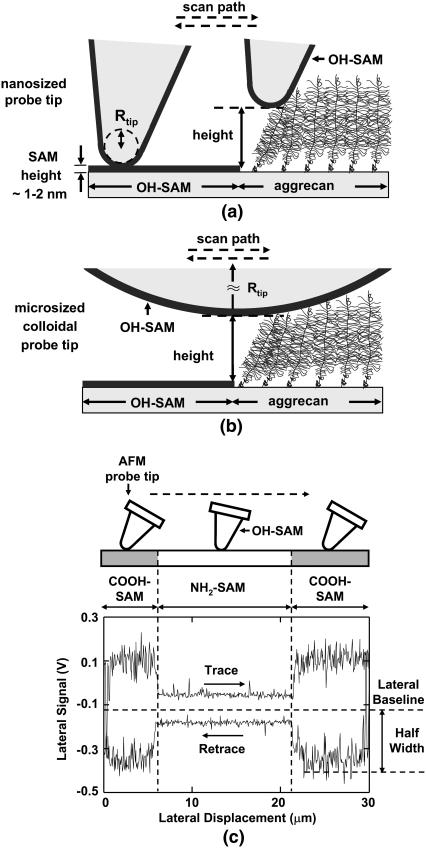
Both standard nanosized AFM probe tips (R ∼50 nm as measured by scanning electron microscopy, NP tip D, silicon nitride, V-shaped cantilever, nominal spring constant k ∼0.06 N/m, Veeco, Santa Barbara, CA) and microsized colloidal probe tips (R ∼2.5 μm, silicon nitride, V-shaped cantilever, nominal spring constant k ∼0.12 N/m, Bioforce Nanosciences, Ames, IA) were used. Both were coated with 2 nm of Cr and 50 nm of Au, and then functionalized with neutral OH-SAMs by immersion for 24 h in 3 mM HS(CH2)11OH ethanol solution, to minimize the electrostatic and hydrophobic interactions between the tip and aggrecan layer. A hydrophobic methyl-functionalized microsized probe tip was also prepared by immersion for 24 h in 3mM ethanethiol, HSCH2CH3 (Aldrich), ethanol solution. Based on the surface interaction area calculated from the measured probe tip radii and the known aggrecan packing density, the nanosized tips (Fig. 2 a) were estimated to interact directly with <10 aggrecan on the surface, while the microsized tips (Fig. 2 b) interacted with ∼103 aggrecan (12).
FIGURE 2.
Illustrations of AFM contact mode imaging on aggrecan and OH-terminated SAM patterned substrate on which the spacing between adjacent core proteins of the aggrecan molecules are ∼25 nm apart; (a) nanosized probe tip with an end-radius, R ∼50 nm; (b) microsized colloidal probe tip, R ∼2.5 μm. (c) Schematic of one lateral signal loop from a single line scan crossing a COOH-NH2 self-assembled monolayer (SAM) pattern using an OH-SAM functionalized nanosized probe tip (R ∼50 nm, nominal cantilever spring constant, k ∼0.06 N/m) in 0.01M NaCl solution at pH ∼10.3, adjusted by adding NaOH (not drawn on scale).
Shear nanomechanics of aggrecan via lateral force microscopy
A Multimode Nanoscope IV AFM (Veeco) was used with a PicoForce piezo for the lateral force microscopy experiments. The scan direction was parallel to the base of the V-shaped cantilever, i.e., a 90° scan angle. As the cantilever scans across the surface under a constant applied normal force (Fig. 2 c), it twists in the scanning (lateral) direction, resulting in a horizontal deflection of the laser spot on a quadrant position-sensitive photodiode that outputs a lateral deflection signal (Volts). Simultaneously, the cantilever bends in the normal direction and results in a separate output as the normal deflection signal (Volts) on the same photodiode. The normal deflection signal is of a greater magnitude and the cross talk, or interference of the normal to the lateral signal, is typically an order-of-magnitude larger than the actual lateral deflection signal caused by the cantilever twisting (34). To account for this, both forward (trace) and reverse (retrace) line scans (lateral signal loops) were performed. The magnitude of the lateral force was calculated from the average of the lateral deflection signal (i.e., one-half the trace minus retrace signal, or half-width, Fig. 2 c). Calibration of the lateral sensitivity α (nN/V) was conducted using an extension of the “wedge method” (34,35), thus enabling quantification of the lateral force in nN (see Appendix). The normal deflection sensitivity β (nN/V) was determined by calibrating the normal cantilever spring constant via the thermal oscillation method (36). Based on these methods, lateral force scans were measured at eight locations on each hexagon as a function of the applied normal force, probe tip displacement rate, and bath ionic strength (0.001–1.0 M NaCl solutions, pH ∼5.6). The proportionality coefficient between lateral force and applied normal force, μ, which characterizes the resistance of the aggrecan layer to lateral deformation at given applied normal forces, was estimated via linear regression on the data pooled from all eight scan positions and reported as the mean (least-squares estimator) ±95% confidence interval for each lateral versus normal force curve. The validity of pooling the data was tested using the one-way analysis of variance test (ANOVA) followed by the Tukey-Kramer post-hoc multicomparison test; there were no significant differences in the means between each of the eight scan lines at any given ionic strength (IS) or pH, suggesting that the properties of the aggrecan across the hexagon were relatively homogeneous.
During lateral force microscopy scans, the height difference between the aggrecan and OH-SAM regions was recorded simultaneously (Fig. 2, a and b), which equals the aggrecan layer height as the height of OH-SAM layer is negligibly small (∼1–2 nm) (11). Hence, simultaneous assessment of aggrecan height (and hence, conformation and compressive normal strain) with lateral and normal force was obtained, as previously described (11,12). Lateral force was plotted versus aggrecan height and compressive normal strain, ɛn, which was calculated as the aggrecan height normalized by the equilibrium aggrecan height at approximately zero applied normal force (12). A 30-μm scan size and 1-Hz scan frequency were employed at a lateral scan rate 60 μm/s. In an additional series of experiments, a range of lateral scan rates from ∼1 to 100 μm/s was employed. For each individual scan line, 256 data points were recorded on each trace and retrace line. Ten data points at the beginning and end of the loop (the tip reversal region), and 10 data points corresponding to each pattern edge were excluded. Lateral force microscopy images of individual aggrecan-functionalized hexagons, demonstrating the lateral cantilever deflection signal at each scan location (proportional to the absolute value of lateral force), were also created to directly visualize the lateral force contrast between the inside and outside of the hexagonal patterned areas of the microcontact printed surfaces.
RESULTS
Control experiments—friction between nanosized OH-SAM probe tip versus COOH-NH2 SAM microcontact printed surface
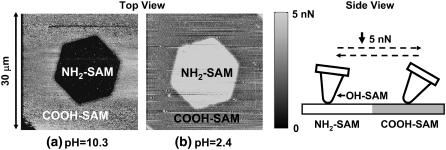
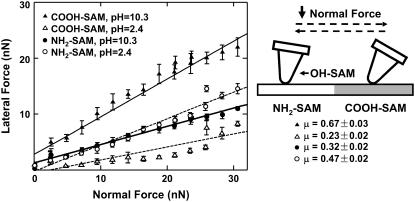
A hexagonal microcontact printed COOH- and NH2-SAM functionalized substrate (where the COOH-SAM was outside and the NH2-SAM was inside the hexagons) was imaged with an OH-SAM nanosized probe tip in 0.01 M NaCl at pH ∼10.3 and 2.4, with an applied normal force ∼5 nN. Thirty-micrometer lateral force-scan images (Fig. 3) were constructed from the half-width of the lateral signal loop (Fig. 2 c). At pH ∼10.3, the negatively charged COO−-SAM exhibited a higher lateral force than the NH2-SAM, corresponding to the brighter area outside of the hexagon in Fig. 3 a, and the larger half-width in the lateral signal loop (Fig. 2 c) compared to that of the NH2-SAM. The COO−-SAM also exhibited larger lateral signal fluctuations due to stick-slip phenomena (Fig. 2 c) (37). In contrast, the NH2-SAM showed higher lateral force at pH ∼2.4 (Fig. 3 b). Lateral forces showed a positive linear dependence with increasing normal force for both the NH2-SAM and COOH-SAM versus the OH-SAM functionalized probe tip at pH ∼10.3 and 2.4 (Fig. 4). The lateral proportionality coefficient, μ, between carboxyl and hydroxyl, markedly decreased from 0.67 ± 0.03 to 0.23 ± 0.02, while that between amino and hydroxyl increased from 0.32 ± 0.02 to 0.47 ± 0.02, as the pH was decreased from 10.3 to 2.4 (Fig. 4). Visualization of the pattern reversal at different pH (Fig. 3) and the linear dependence of lateral on applied normal force (Fig. 4) verified the lateral force microscopy methodology by reproducing results reported previously in the literature (38).
FIGURE 3.
Lateral force images of a COOH-NH2 SAM patterned substrate taken with an OH-functionalized nanosized probe tip probe tip (R ∼50 nm, nominal cantilever spring constant, k ∼0.06 N/m) under ∼5 nN applied normal force in 0.01 M NaCl solutions at pH ∼10.3 and 2.4 (pH was adjusted by adding HCl or NaOH; COOH-SAM was outside the hexagon, NH2-SAM inside).
FIGURE 4.
Lateral force as a function of normal force on a COOH-NH2 SAM patterned substrate in 0.01M NaCl at different pH values, using an OH-functionalized nanosized probe tip (R ∼50 nm, nominal cantilever spring constant, k ∼0.06 N/m). Each data point represents the mean (±SD) of lateral signal loops at eight different locations across one hexagon pattern, where each loop consists of up to 256 data points. The value μ (mean ±95% confidence interval), the proportionality coefficient between lateral and normal force, was calculated here and in subsequent figures via linear regression on the data pooled from all eight locations.
Aggrecan shear using a nanosized probe tip
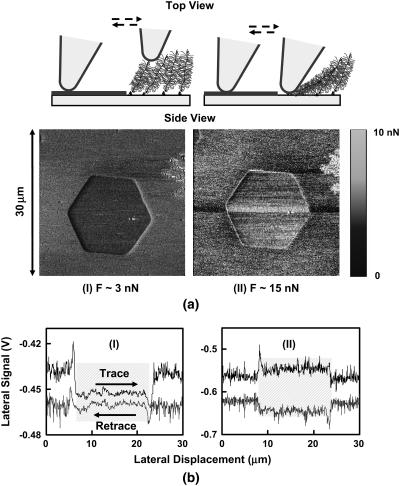
Lateral force images for a microcontact printed surface of chemically end-grafted aggrecan (inside the hexagon) and an OH-SAM (outside the hexagon) were taken with a nanosized OH-SAM functionalized probe tip in 0.1 M NaCl at pH ∼5.6 (Fig. 5 a). Lateral force data from this experiment were obtained at low (∼3 nN) and high (∼15 nN) normal imaging forces, as seen in two typical signal loops of Fig. 5 b, with a 30-μm line scan. The half-width of the lateral signal and, hence, the magnitude of the lateral resistance, was much smaller for the aggrecan compared to the OH-SAM at the low applied normal force (Fig. 5 a), and increased with increasing normal force (Fig. 6) (34). (Note that a shift in the baseline of the lateral signal loop was observed at the edge of the hexagonal pattern due to the increase in aggrecan height, but this did not affect the magnitude of the measured lateral force given the linear response of the position-sensitive photo diode. This cross talk came from the interference of cantilever normal deformation with the lateral deflection signal, which was deconvoluted by analyzing the trace-retrace scan loop, as mentioned in Methods.)
FIGURE 5.
(a) Lateral force images of aggrecan-OH SAM patterned substrate in 0.1 M NaCl solution at pH 5.6, with an OH-SAM functionalized nanosized probe tip (R ∼50 nm, nominal cantilever spring constant, k ∼0.06 N/m). (The left hand layer in the schematic represents OH-SAMs, as in Fig. 2, a and b.) (b) Corresponding lateral force loop signals across a full pattern of the aggrecan-OH-SAM region; the shaded regions in the lateral signal loops are the regions representing the aggrecan brushes. (I) normal force, F ∼3 nN; (II) F ∼15 nN.
FIGURE 6.
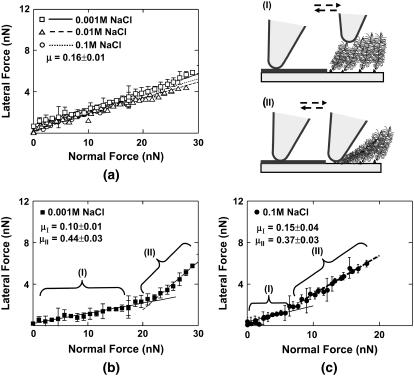
Lateral force versus applied normal force for an aggrecan-OH SAM patterned surface with an OH-SAM functionalized nanosized probe tip (R ∼50 nm) in NaCl solutions, pH ∼5.6. (a) OH versus OH. (b) OH versus aggrecan at 0.001 M IS. (c) OH versus aggrecan at 0.1 M IS. At 0.01 M IS, lateral linearity ratio μ is measured to be μI = 0.10 ± 0.01 and μII = 0.35 ± 0.03 in region (I) and (II), respectively (data not shown). Each data point represents the mean (±SD) of at eight different locations across one hexagon pattern at a fixed applied normal force.
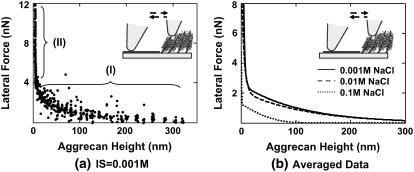
Fig. 6 illustrates the dependence of lateral force on normal force for this same sample; each data point represents eight line-scans at different sample locations for a 30-μm scan size. Data in the OH-SAM region (Fig. 6 a) yielded a linear dependence of lateral force on normal force with μ = 0.16 ± 0.01, which was independent of ionic strength in the range of 0.001–0.1 M, as expected for neutral SAMs. For the aggrecan-functionalized region, two linear regimes were observed: one at lower forces (region I) and one at higher forces (region II, Fig. 6, b and c). In region I, μ was found to be μI = 0.10 ± 0.01 at 0.001 and 0.1 M IS and μI = 0.15 ± 0.04 at 0.1 M IS. In region II, μ increased to μII = 0.44 ± 0.03, 0.35 ± 0.03 and 0.37 ± 0.03 at 0.001, 0.01, and 0.1 M IS, respectively. The applied normal force at which this transition occurred was found to decrease with increasing ionic strength (e.g., Fig. 6, b and c). It should be noted that scanning under high force in region II produced damage to the aggrecan layer causing irreversible changes in the measured height and lateral force. Lateral force also depended markedly on aggrecan height (Fig. 7). In the low force region of constant lateral linearity (region I), the aggrecan layer was not fully compressed (Fig. 7 a); in the higher force region II, the aggrecan layer was compressed to <5 nm. The lateral force in both regimes depended on ionic strength (Fig. 7 b): at any given aggrecan layer height, the lateral force increased with decreasing ionic strength.
FIGURE 7.
Aggrecan lateral force versus height in NaCl solutions, pH ∼5.6 using a nanosized OH-SAM functional tip (R ∼50 nm, nominal cantilever spring constant, k ∼0.06 N/m). (a) IS = 0.001 M; each data point represents one lateral signal loop, and the aggrecan brush height is recorded simultaneously. Region I: lower normal forces (<20 nN), where aggrecan molecules are not highly compressed and lateral forces are expected to originate from molecular shear, rotation, and bending. Region II: higher normal forces (>20 nN), where aggrecan molecules are highly compressed and stick-slip mechanisms are observed in the lateral signal loops. (b) Averaged aggrecan lateral force versus height curves at different IS; 0.001 M data correspond to that shown in panel a.
Aggrecan shear using a microsized probe tip
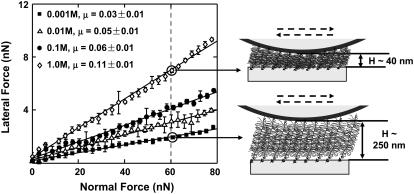
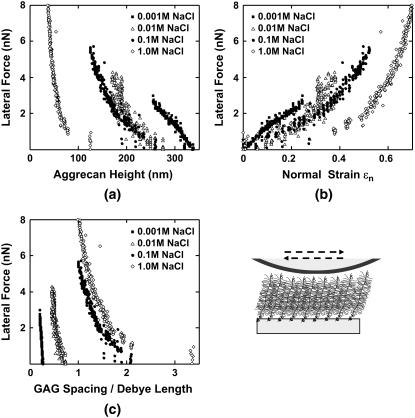
Lateral forces between aggrecan and an OH-SAM microsized probe tip (R ∼2.5 μm) were measured over a range of applied normal force between 0 and 80 nN. It is known that in this force range, the aggrecan layer is never fully compressed (12). Lateral force was observed to vary linearly with normal force throughout the entire range of applied normal force (Fig. 8). The value μ was found to be independent of loading history for several loading and unloading cycles in the range of applied normal force (data not shown), indicating a lack of damage to the aggrecan layer during scanning. A marked increase of μ with increasing ionic strength was observed, ranging from μ = 0.03 ± 0.01 at 0.001 M to 0.11 ± 0.01 at 1.0 M (Fig. 8). The same sample was tested using the CH3-SAM tip at 0.1 M and 1.0 M, and no significant differences in the values of μ were observed compared to the OH-SAM tip (data not shown). As shown in Fig. 9 a, the initial aggrecan layer height was greater at lower ionic strength; at any measured height, the lateral force was larger at lower ionic strength. When these same data were plotted as a function of compressive strain ɛn (aggrecan height normalized to initial height at approximately zero normal force), the lateral force was found to decrease with increasing ionic strength at constant strain (Fig. 9 b). To aid in the interpretation of these results (see Discussion), the lateral force data of Fig. 9 b were replotted versus the estimated ratio of the GAG spacing divided by Debye length, the characteristic electrostatic interaction length, at different ionic strengths, to distinguish between electrostatic and nonelectrostatic interactions (Fig. 9 c). The estimated average GAG spacing corresponding to varying amounts of aggrecan compression was calculated as
 |
where the GAG spacing along core protein is 3.2 ± 0.8 nm, and the contour length is 398 ± 57 nm for fetal epiphyseal aggrecan, as measured via tapping mode AFM imaging (7). The value of GAG spacing under compression divided by Debye length is <1 at lower IS (0.001 and 0.01 M) and >1 at higher IS (0.1 and 1.0 M) in the range of measured lateral forces.
FIGURE 8.
Lateral force versus normal force for aggrecan brush using an OH-functionalized microsized probe tip (R ∼2.5 μm) in NaCl solutions, pH ∼5.6. Each data point represents the mean (±SD) of lateral signal loops at eight different locations across one hexagon pattern. Higher lateral force was measured at higher IS for the same normal force, as aggrecan layer height became smaller.
FIGURE 9.
Lateral force versus (a) aggrecan layer height, (b) normal strain ɛn, and (c) GAG spacing normalized to the Debye length, using an OH-functionalized microsized tip (R ∼2.5 μm) in NaCl solutions, pH ∼5.6. Each data point represents one lateral signal loop. Normal strain ɛn was calculated as the compressed aggrecan layer height normalized to its uncompressed height (12).
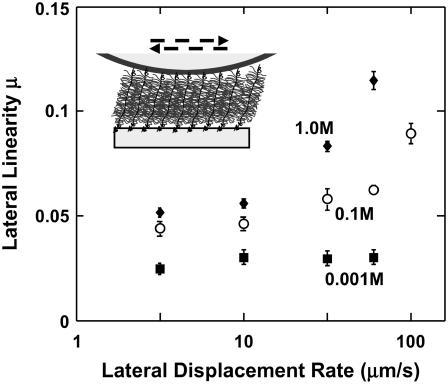
The lateral proportionality coefficient μ varied with the tip displacement rate in the range ∼1–100 μm/s (Fig. 10) in a manner that depended on ionic strength. At higher IS (0.1 and 1.0 M), μ increased significantly with tip displacement rate (confirmed by one-way ANOVA test at each ionic strength, Fig. 10). In contrast, at IS = 0.001 M, μ did not change significantly with tip displacement rate. The trends reported in this study were found to be reproducible using at least three different microcontact-printed samples for each experiment. The variability of the data are most likely associated with the local grafting density of the aggrecan layer within a hexagonal pattern and the previously quantified degree of aggrecan polydispersity (7). Variations between hexagons were found to be less important.
FIGURE 10.
Lateral proportionality coefficient μ as a function of lateral tip displacement rate (from 3.16 to 100 μm/s) in NaCl solutions, pH ∼5.6, calculated as the least-squares estimator ±95% confidence interval from eight series of applied normal forces at the same IS and lateral displacement rate. The μ varied significantly with displacement rate at 0.1 M and 1.0 M IS (one-way ANOVA, p < 0.0001); no significant effect of rate was found at 0.001 M. The value μ was found to vary significantly with IS and rate (two-way ANOVA test, followed by Tukey-Kramer post-hoc multicomparison test, p < 0.0001).
DISCUSSION
Control experiments—friction between nanosized OH-SAM probe tip versus COOH and NH2-SAM micro contact printed substrates
The inversion of the lateral force image pattern on the COOH-SAM compared to the NH2-SAM sample (Fig. 3, a and b) is consistent with the ionization state of the end-functional groups at different pH, as previously reported (38). At pH ∼2.4, the COOH-SAM is fully protonated ( ) while
  -SAMs are fully ionized (
 ) (40). At this pH, greater lateral force was measured between the OH-SAM tip and
  -SAM due to intermolecular hydrogen bonds between -
 and -OH that are stronger than those between -COOH and -OH. At pH ∼10.3, the NH2-SAM is nearly neutral while the COO−-SAM is completely ionized and, thus, there is a stronger adhesion force between the COO− and OH functional groups due to stronger hydrogen bonds (38). The stick-slip behavior and linear dependence of lateral force on applied normal force is consistent with previous results on SAM systems (30), and is known to correlate with adhesion of the end-functional groups (37). The magnitude of the lateral proportionality coefficient μ may depend on many experimental factors including surface roughness, contact area, sliding speed, temperature, etc. (41), but relative trends, such as the effect of pH, are accurately assessed. The greater pH dependence of μ in the carboxyl SAM region can be attributed to the larger increase of electronegativity of the carboxyl groups by ionization, and hence the larger magnitude change of the hydrogen bonding energy (30), and thus adhesions, between hydroxyl and carboxyl SAMs from the protonated to the charged state.
Molecular origins of the aggrecan shear response using the microsized tip
The radius of curvature of the microsized tip is an order-of-magnitude larger than aggrecan height, aggrecan-aggrecan surface separation distance, and the interaction distance between the aggrecan layer and the probe tip. Thus, the ensemble of aggrecan molecules located within the tip-substrate contact area are subjected to a more uniform deformation compared to that produced by the nanosized tip, which may penetrate into the aggrecan layer. The finding that the lateral force was independent of loading history over many loading-unloading cycles suggests that the aggrecan(thiol)-gold end-grafting was stable for the experimental conditions used (∼2 h for each ionic strength condition). The μ-values measured in the lateral force experiments presented here may have two possible origins: through-thickness molecular-molecular interactions and/or surface interactions between the OH-SAM probe tip and the chain segments of the aggrecan in physical contact with the probe tip. Surface interactions are expected to be minimal, since it was observed that there was negligible adhesion between the aggrecan and OH-SAM tip for normal force measurements under the same conditions tested (12). This hypothesis is further supported by the fact that no marked difference was observed between μ measured with tips having varied surface chemistry. Hence, through-thickness molecular-molecular interactions are expected to dominate and may include electrostatic repulsion, nonelectrostatic repulsion (e.g., entropic, steric, excluded volume, bending, etc.), and/or molecular entanglements.
An electrostatic contribution to the shear resistance is evident in Fig. 9 a, where it is observed that at any constant aggrecan layer height, the lateral force increases with decreasing IS. At the same time, clear differences in the lateral force are observed with ionic strength at constant values of the ratio of GAG spacing to Debye length (Fig. 9 c), which supports the hypothesis that nonelectrostatic interactions also contribute to aggrecan shear resistance. Theoretical studies on polymer compression have suggested that more compacted configurations have higher nonelectrostatic interactions, e.g., excluded volume effect (42). Hence, the reduction in lateral force at a given strain ɛn with increasing ionic strength (Fig. 9 b) is likely due to the decrease in electrostatic repulsion interactions. This finding is also consistent with the observation that at constant normal force, greater lateral force was measured at higher IS (Fig. 8), which would result in higher compaction of the aggrecan layer due to increased screening of electrostatic interactions.
Aggrecan shear response using the nanosized probe tip
For the microsized probe tip, a constant proportionality ratio μ was observed in the range of applied normal force in all tested IS (Fig. 8). By comparison, the nanosized probe tip highlighted the existence of two different regimes of linearity in the response with applied normal force (Fig. 6, b and c). Higher normal force resulted in full compression or penetration of the tip through the aggrecan layer (11), possibly bringing the tip into contact with the underlying gold substrate. The differences in lateral force mechanisms in regions I and II (Fig. 6, b and c) can be interpreted by analyzing the shape of lateral signal loops (Fig. 5) as well as the corresponding aggrecan height and conformation (Fig. 7). When the aggrecan was fully compressed or penetrated at high normal force, the lateral force was likely dominated by surface interactions between the probe tip and gold layer under the aggrecan (shaded, Fig. 5 b (II)). At low normal force, lateral signals in the aggrecan region (shaded, Fig. 5 b (I)) had much smaller variations compared to those in the OH-SAM region, where the lateral forces were dominated by stick-slip surface interactions (37). The transition between different lateral force mechanisms also support the hypothesis that surface interactions between aggrecan and the OH-SAM tip were small.
Under the microsized tip, a degree of normal and lateral confinement of aggrecan within the layer is expected, since ∼103 aggrecan are compressed simultaneously. However, due to the pyramidal geometry of the nanosized tip, only 2–4 aggrecan molecules are directly interacting with the tip and the measured aggrecan height does not necessarily represent the amount of aggrecan compression in the normal direction. Penetration of the nanosized tip into the aggrecan layer could result in both splay deformation (bending) as well as compression even in the absence of tip lateral displacement. Regardless of these geometrical factors, a linear dependence of lateral force on applied normal force was still observed in the normal force region I in Fig. 6, b and c, and Fig. 7. Although μ did not markedly vary with IS in this region (Fig. 6, b and c), as was observed using the microsized probe tip (Fig. 8), a strong IS-dependence was observed between lateral force and aggrecan height (Fig. 7 b). Thus, due to stronger electrostatic repulsion at lower IS, larger normal forces were required to reach a given compressed height, and electrostatic repulsion was stronger in the lateral directions as well. The nanosized probe tip has a larger lateral proportionality coefficient in region I at IS = 0.001–0.1 M compared to that with the microsized tip, which is likely due to length scale and/or geometrical effects. Thus, the two lateral linearity regions measured via the nanosized probe tip (Fig. 6, b and c) helped to interpret the underlying molecular origins of aggrecan shear and to assess the lateral deformation mechanisms of a few aggrecan molecules. By comparison, the microsized tip serves to contrast the effects of compressive and lateral deformation of a larger ensemble of aggrecan molecules, and thereby more closely simulates the deformation of aggrecan within cartilage tissue.
Rate-dependence of aggrecan shear
The significant increase in μ with tip lateral displacement rate at 0.1 M and 1.0 M IS (Fig. 10) suggests that time-dependent (e.g., viscoelastic and/or poroelastic) as well as time-independent (elastic) processes are involved in lateral deformation of aggrecan. In contrast, at low IS (0.001 M), as elastic electrostatic interactions become even more dominant, no significant change in μ with displacement rate was observed (Fig. 10). Viscoelastic behavior may be associated with interpenetration, entanglements, and macromolecular friction between aggrecan molecules. Poroelastic behavior may result from lateral deformation-induced fluid flow within and through the densely-packed aggrecan layer and the associated local pressure gradients within the layer, which results in hydrodynamic friction between water and end-attached aggrecan (43,44), as is known to occur within cartilage tissue (45,46). Such rate-dependent phenomena become relatively more important as rate-independent electrostatic interactions decrease with increasing IS. From the data presented here, we cannot yet distinguish between viscoelastic and poroelastic contributions, which are the subject of ongoing studies focusing on scaling approaches to the size and rate of interactions (47). Interestingly, previous studies of the compressive nanomechanics of aggrecan, where electrostatic effects were dominant, showed negligible dependence of aggrecan compressive stiffness on normal tip displacement rate in the range of 0.1–10 μm/s (12).
Comparison to reported polyelectrolyte lateral force studies
While this study has focused on the shear deformation of the end-grafted aggrecan layer, it is still instructive to compare our findings to recent literature on the surface lubrication properties of polyelectrolytes. Feiler et al. (48) recently used LFM to measure surface forces and frictions associated with adsorbed cationic polyelectrolyte layers of very low charge density, using a similar microsized probe tip geometry (R ∼10 μm) and range of lateral displacement rates (∼10–100 μm/s). Their measured values of μ in 10−4 M KBr were higher than the largest measured μ for aggrecan even at the highest IS of 1.0 M (Fig. 9), at which electrostatic interactions are screened. Values of μ reported for negatively charged adsorbed polyelectrolyte layers measured using the surface forces apparatus (20,22) at the lowest ionic strength comparable to our study were higher than that found here as well, while in some other negatively charged polyelectrolyte systems, extremely low values of the effective lateral coefficient μeff (the ratio of lateral to normal force) were also observed (19). These differences are likely associated with differences in the molecular structure of the polyelectrolytes of interest, the arrangement of the adsorbed versus end-anchored attachment, the existence of free polyelectrolyte molecules in solution, the geometry of the opposing layers in the SFA versus AFM configuration, the lateral displacement velocity (greater than fivefold higher in the AFM), and the higher applied normal forces used in the SFA experiments. Nevertheless, a similar trend was observed in both AFM and SFA systems demonstrating that the presence of electrostatic interactions between charged polyelectrolytes effectively reduced the lateral forces at constant normal force (19).
Comparison to macroscopic shear of cartilage tissue
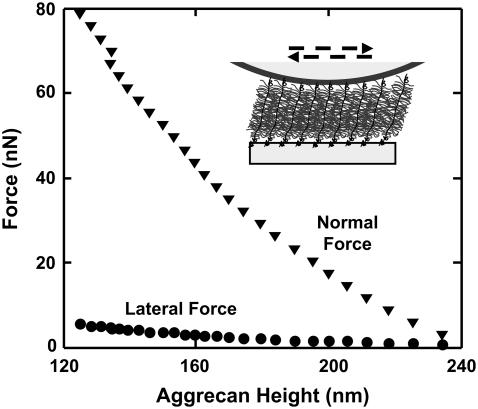
We first note that the observed decrease in the resistance of aggrecan to shear deformation with increasing IS (Fig. 9) is consistent with the previously reported decrease in both the equilibrium and dynamic torsional shear modulus of cartilage disks with increasing IS at constant disk thickness in vitro (5). During macroscopic deformation of cartilage in vivo, aggrecan would be expected to deform in both normal and lateral directions enmeshed within the collagen fibrillar network. In this study, end-attached aggrecan molecules undergo both compression and shear simultaneously. However, while the macromolecules are end-attached to the substrate, the lateral displacement of the aggrecan is not measured, as they are not attached to the tip or to each other like a network. Therefore, it is difficult to define a shear strain (or shear modulus) for the layer in the configuration of Fig. 2, a and b. Assuming aggrecan to be a rigid rod, the maximum shear deformation at 0.1 M was estimated to be ∼0.95 of the aggrecan contour length; however, aggrecan is more coiled at physiological conditions and the actual deformation is likely much less. In native cartilage tissue, aggrecan is enmeshed within a collagen fibril network. While the configuration of Fig. 2, a and b (without the collagen network), does not replicate the mechanical constraints that regulate aggrecan deformation within native tissue, our goal is to help further establish a molecular-level understanding of cartilage tissue mechanics by isolating the different components of aggrecan deformation. To this end, the magnitudes of both the normal and lateral force as a function of aggrecan layer height using the microsized tip, replotted from the data of Figs. 8 and 9, are compared in Fig. 11 at near physiological IS (0.1 M NaCl). At any given height (normal deformation), the normal force is ∼10-fold larger than the shear force. Conversely, aggrecan resistance to shear deformation is ∼10% of its resistance to compression in this layer configuration. In native cartilage, the equilibrium shear modulus is typically ∼50% that of the compressive modulus (25). Thus, while the experiments presented here delineate the lateral deformation properties of aggrecan layers having molecular packing densities similar to that in tissue, it is clear that interactions between aggrecan and the enveloping collagen network are also critically important for a complete understanding of the tissue-level biomechanical properties of cartilage. Ongoing studies are therefore focused on lateral nanomechanical interactions between aggrecan and collagen, and between aggrecan macromolecules enmeshed within a collagen network.
FIGURE 11.
Comparison of aggrecan layer resistance to normal and shear deformation using an OH-functionalized microsized tip (R ∼2.5 μm), 0.1 M NaCl, pH ∼5.6.
CONCLUSIONS
In this study, we examined the shear nanomechanics of aggrecan macromolecules using microcontact printing and lateral force microscopy involving deformation of a few aggrecan or a large assembly of them using nanosized or microsized probe tips, respectively. By deforming a large assembly of aggrecan at physiological concentration, the microsized tip more closely mimics deformation of aggrecan within native cartilage tissue. Using this approach, aggrecan shear force was found to depend linearly on normal force. Both electrostatic and nonelectrostatic interactions at the molecular level were identified by using a combination of probe tip geometries, functionalizations, environmental (e.g., IS) conditions, and appropriate normalization of the data. Stronger electrostatic interactions resulted in larger shear resistance at the same layer height and normal strain, accompanied by more elastic-like deformation (i.e., less rate-dependence). At physiological IS, the rate dependence of the lateral force strongly suggested the presence of visco- and/or poroelastic behavior, consistent with tissue-level aggrecan and GAG-GAG interactions that have been identified in the study of intact cartilage shear behavior.
Acknowledgments
The authors thank the MIT Institute for Soldier Nanotechnologies funded through the U.S. Army Research Office for use of instrumentation. The content does not necessarily reflect the position of the government and no official endorsement should be inferred.
This work was supported by National Institutes of Health grant No. AR45779, National Science Foundation grant No. NSF-NIRT 0403903, and a Whitaker Foundation Fellowship (to D.D.).
APPENDIX—LATERAL FORCE CALIBRATION
Wedge method for calibration of nanosized probe tips
Lateral deflection signals (V) from a position-sensitive photodiode (PSPD, resolution ∼1 mV) were recorded during line scans. To convert these data into forces, the lateral cantilever deflection sensitivity, α (nN/V), had to be determined. Different calibration methods have been used (34,35,49–57) and compared (58) previously to quantify α. Among these, the nondestructive “wedge” method (34,35), which calibrates the ratio of α to the normal deflection sensitivity β (nN/V), has been the most widely accepted. This approach can be performed in combination with lateral force experiments, thereby eliminating uncertainties introduced by a separate calibration of cantilever stiffness and by changes in experimental conditions including the optical geometry of the laser beam path. The wedge method was first developed using standard nanosized silicon AFM probe tips (R < 100 nm) to scan SiTiO3 samples having geometrically well-specified slopes (i.e., the (101) and (103) crystallographic planes) (34). Varenberg et al. (35) extended this approach by replacing the SiTiO3 sample with an etched silicon calibration sample having both planar and tilted regions (TGF-11, Mikromasch, Wilsonville, OR). This technique allowed use of probe tips having an end-radius R <∼1 μm. In this study, we modified the calculation procedure of α by removing the assumption that the applied normal force remains constant on the horizontal and tilted regions during scanning. In addition, we extended the wedge method to calibrate larger probe tips with end-radii R >1 μm. In this case, the reported method using the TGF-11 sample cannot be used because the probe tip makes simultaneous contact with both the horizontal and tilted regions when scanning (i.e., the length of the tilted region ∼1 μm, the slope 54°44′) resulting in noise that was an order-of-magnitude larger than the lateral deflection signal itself. By using two different mica samples, one horizontal and the other tilted at ∼20°, we developed new calibration procedures and analysis for larger probe tips, which is applicable to probe tips with smaller end-radii as well.
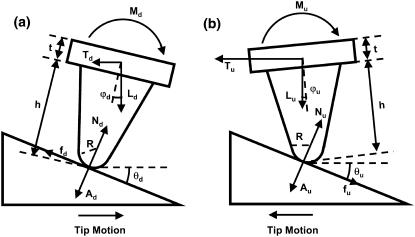
To clarify our modifications on the wedge method, we use the approach based on Eqs. 1–12 of Varenberg et al. (35). The tip (height h, end-radius R, Fig. A1) is subjected to forces applied by the probe tip (i.e., the contact, adhesion, and friction forces N, A, and f, respectively), and the cantilever of thickness t (i.e., the applied normal and lateral force, L and T, and the torsion moment M). The subscripts u and d are corresponding to the forces and moments during uphill and downhill motions, respectively. Momentum equilibrium is described for uphill and downhill motions by Eqs. 11 and 12 in (35):
 |
(A1) |
 |
(A2) |
FIGURE A1.
Free-body diagrams of the cantilever tip during scanning in both (a) trace (downhill) and (b) retrace (uphill) motions, adapted from Fig. 1 of Varenberg et al. (35), where R is the tip end-radius; h the tip height; t the cantilever thickness; θu and θd the slope angles of the tilted region during upward and downward scans, respectively; and N, A, and f are the contact, adhesion, and friction forces executed between the probe tip and the sample surface, respectively; and L, T, M are the applied normal and lateral forces and the torsion moment, respectively. The subscripts u and d are corresponding to the forces and moments during uphill and downhill motions, respectively.
For nanosized probe tip h ≫ R, Eqs. 1 and 2 are simplified as
 |
(A3) |
 |
(A4) |
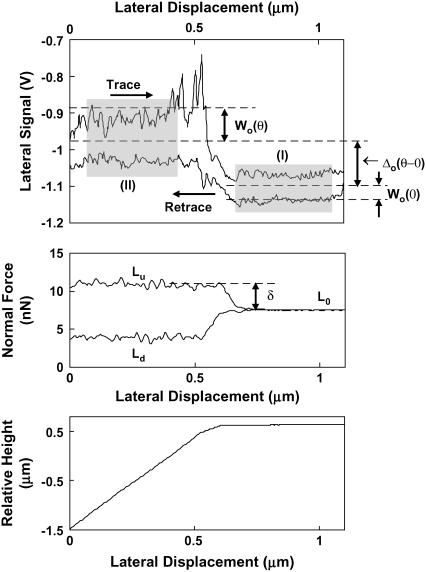
The nanosized probe tip used in this study was calibrated following the experimental procedures described in Varenberg et al. (35). A series of 1.1 μm lateral scan loops (256 datapoints each on trace and retrace) were performed on the TGF-11 calibration grid (surface roughness ∼13.5 nm, slope of tilted region = 54°44′) at varying applied normal force. Each scan loop included both horizontal and tilted regions (Fig. A2) at a 1 Hz scan rate (2.2 μm/s); scanning rates exceeding 3 μm/s on the tilted region resulted in the noise at least an order-of-magnitude larger than the lateral signal. Three types of signals were measured from each lateral scan loop: the half-width of the lateral signals loop in the horizontal region, Wo(0) (corresponding to the data in region I in Fig. A2), the half-width in the tilted region, Wo(θ) (region II in Fig. A2), and the offset of baseline signal in the tilted region related to that in the horizontal region Δo(θ–0) (i.e., the mean value of the trace-retrace signal loop in region I minus mean value in region II). The subscript o indicates the PSPD lateral signal measured in volts rather than converted data (force in nN). The lateral signal loop, Fig. A2, is directly related to the moments M and lateral forces T:
 |
(A5) |
 |
(A6) |
FIGURE A2.
Lateral signal loop on silicon calibration sample in deionized water with corresponding normal force and height profile using an OH-SAM functionalized nanosized probe tip, R ∼50 nm, nominal cantilever spring constant, k ∼0.06 N/m, at a normal force, L0 ∼7 nN; (I) is the tilted area of the sample (corresponding to an angle θ = 54°44′), (II) is the horizontal area of the sample (corresponding to an angle θ = 0°), Wo is the magnitude of the average lateral signal within each shaded region (taken at 10% from the edge of the tilted-horizontal border), and Δo is the baseline offset of the tilted region, Lu is the applied normal force profile during uphill motion (trace), and Ld during down hill motion (retrace).
The adhesion force A is measured to be negligible and, hence, it can be calculated as a function of applied normal force L,
 |
(A7) |
 |
(A8) |
New modifications of wedge method for calibration of nanosized probe tips
It was observed that scanning on a tilted surface resulted in normal deflection errors that could not be corrected by the AFM instrument and, thus, Ld ≠ Lu (Fig. A2). The deflection signals recorded were used to calculate the normal forces exerted from the cantilever,
 |
(A9) |
where d is the vertical deflection signal, s the setpoint, bV the vertical baseline (corresponding to the vertical signal in the unengaged state), and β (nN/V) the cantilever's normal deflection sensitivity, which is the product of its normal spring constant k (nN/nm) and inverse optical lever sensitivity (nm/V) (36). For a given tilted angle θ and tip scanning rate, d was observed to be independent of s and remained constant during scanning under a series of vertical setpoints. In addition, it was found that for uphill and downhill motion,
 |
(A10) |
The applied normal force can be rewritten as
 |
(A11) |
 |
(A12) |
where L0 = (s − bV) × β is the normal force on the horizontal surface (the subscript 0 indicates the force on the horizontal region), and δ = duβ is the additional normal force that resulted from scanning on a tilted surface. The value δ was observed to remain constant for the series of applied normal forces L0 at a given tilted angle and tip displacement rate (Fig. A2). Hence,
 |
(A13) |
 |
(A14) |
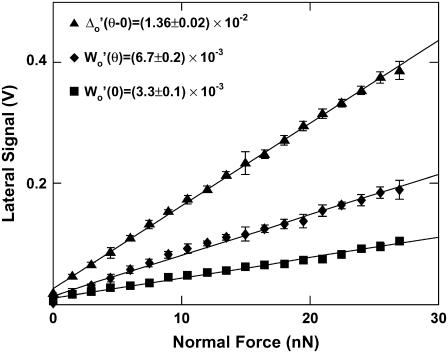
Wo(0), Wo(θ), and Δo(θ − 0) were plotted as a function of applied normal force L0 (Fig. A3), where each data point represents the mean of eight lateral scan loops at different locations, and the slopes  and
and  were measured from the data of Fig. A3. Due to the observed independence of δ on L0, the lateral proportionality coefficient μ between the tip and substrate in the tilted region was calculated following (34)
 |
(A15) |
FIGURE A3.
Lateral calibration parameters Wo and Δo versus normal force where slopes of these curves are given as inset text (indicated by primes) using an OH-SAM functionalized nanosized probe tip (R ∼50 nm, nominal cantilever spring constant, k ∼0.06 N/m). Each data point represents eight independent scan loops under a fixed applied normal force.
The lateral sensitivity α was calculated as
 |
(A16) |
and the lateral proportionality coefficient on the horizontal surface was then calculated as
 |
(A17) |
The true physical value of μ and μ0 may not be equal but should be close to each other. Hence, the physical solution from the two possible solutions derived from Eqs. A15 to A17 (μ1,α1) and (μ2,α2) was determined by comparing the values of  ; the solution corresponding to the smaller
  is the real solution (35). The nanosized probe tip used to obtain the lateral force data for both the control and aggrecan shear experiments was found to have a lateral sensitivity α = 122 ± 2 nN/V (Fig. A3). Thus, using a PSPD with ∼1 mV resolution, the minimum detectable amount of lateral force was ∼100 pN, based on the measured lateral sensitivity.
Modifications of wedge method for calibration of microsized probe tips
The lateral sensitivity of the microsized (colloidal) probe tip used in this study could not be calibrated using the wedge method since the radius of the colloid is bigger than the length of the tilted region, and scanning on a tilted region having θ = 54°44′ resulted in uncorrectable noise due to the relatively large tilted angle. We therefore replaced the TGF-11 sample (Mikromasch) with two mica substrates, one having a horizontal surface and the other a surface with tilt angle θ ∼20°.
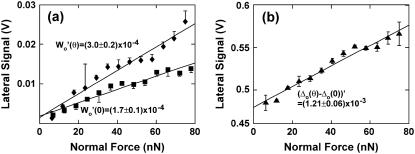
A series of 10-μm lateral scan loops (256 datapoints each on trace and retrace) was performed on both the horizontal and the tilted mica substrates at varying applied normal force at 1 Hz scan rate (20 μm/s). The half-widths and the offsets of baseline signals of the lateral signal loops were measured from both the horizontal (Wo(0) and Δo(0)) and the tilted (Wo(θ) and Δo(θ)) samples. The jump of the baseline offset Δo(θ − 0) from the horizontal to the tilted sample could not be directly measured, for one single scan loop including scanning on both horizontal and tilted regions could not be obtained when using two separate samples. However, the lateral baseline offset was found to be affected only by two factors, the applied normal force L0 due to the crosstalk between the normal and the lateral deflection signals, and the tilt angle θ, which causes the lateral projection of the compression force N (Fig. A4). The crosstalk between normal and lateral deflection signals is determined by the laser path from the AFM head to the PSPD (59) and, hence, the effect of the crosstalk is the same during scanning on the two different samples as long as the optical laser beam path is untouched while changing the samples. In that case, the difference of lateral baseline dependences on normal force measured on these two samples, (Δo(θ) − Δo(0))′, has the same physical meaning of lateral baseline jump from a horizontal to a tilted region on one single scan on the same sample, Δo ′(θ − 0).
FIGURE A4.
(a) Half-width of lateral signal loop Wo on both the tilted (Wo(θ), θ ∼20°) and horizontal (Wo(0)) mica substrates as a function of applied normal force using an OH-SAM functionalized microsized probe tip (R ∼2.5 μm, nominal cantilever spring constant, k ∼0.12 N/m). (b) Lateral signal baseline offset jump (Δo(θ) – Δo(0)) as a function of applied normal force. Each data point represents eight independent scan loops under a fixed applied normal force in panel a, and two pairs of eight independent scan loops under a fixed applied normal force on the tilted and horizontal mica substrates in panel b.
For the microsized probe tip, where h = 2R, Eqs. A1 and A2 are simplified as
 |
(A18) |
 |
(A19) |
Hence, with negligible measured adhesion force A, the two calibration parameters are calculated as
 |
(A20) |
 |
(A21) |
Equations A20 and A21 can be written as a function of the applied normal force,
 |
(A22) |
 |
(A23) |
and the lateral proportionality μ is then calculated as
 |
(A24) |
The cantilever lateral sensitivity α is calculated using Eq. A16 and the same criteria used for the nanosized probe tip was used to determine the true physical solutions of μ and α. The microsized probe tip used in this study was calibrated to have a lateral sensitivity α = 148 ± 17 nN/V.
References
- 1.Buckwalter, J. A., H. J. Mankin, and A. J. Grodzinsky. 2005. Articular cartilage and osteoarthritis. Instr. Course Lect. 54:465–480. [PubMed] [Google Scholar]
- 2.Eberhardt, A. W., L. M. Keer, J. L. Lewis, and V. Vithoontien. 1990. An analytical model of joint contact. J. Biomech. Eng. Trans. ASME. 112:407–413. [DOI] [PubMed] [Google Scholar]
- 3.Dunbar, W. L., K. Un, P. S. Donzelli, and R. L. Spilker. 2001. An evaluation of three-dimensional diarthrodial joint contact using penetration data and the finite element method. J. Biomech. Eng. Trans. ASME. 123:333–340. [DOI] [PubMed] [Google Scholar]
- 4.Heinegard, D., and A. Oldberg. 1989. Structure and biology of cartilage and bone matrix noncollagenous macromolecules. FASEB J. 3:2042–2051. [DOI] [PubMed] [Google Scholar]
- 5.Jin, M. S., and A. J. Grodzinsky. 2001. Effect of electrostatic interactions between glycosaminoglycans on the shear stiffness of cartilage: a molecular model and experiments. Macromolecules. 34:8330–8339. [Google Scholar]
- 6.Hardingham, T. E., and A. J. Fosang. 1992. Proteoglycans: many forms and many functions. FASEB J. 6:861–870. [PubMed] [Google Scholar]
- 7.Ng, L., A. J. Grodzinsky, P. Patwari, J. Sandy, A. Plaas, and C. Ortiz. 2003. Individual cartilage aggrecan macromolecules and their constituent glycosaminoglycans visualized via atomic force microscopy. J. Struct. Biol. 143:242–257. [DOI] [PubMed] [Google Scholar]
- 8.Hardingham, T. E., and H. Muir. 1972. The specific interaction of hyaluronic acid with cartilage proteoglycans. Biochim. Biophys. Acta. 279:401–405. [DOI] [PubMed] [Google Scholar]
- 9.Seog, J., D. Dean, A. H. K. Plaas, S. Wong-Palms, A. J. Grodzinsky, and C. Ortiz. 2002. Direct measurement of glycosaminoglycan intermolecular interactions via high-resolution force spectroscopy. Macromolecules. 35:5601–5615. [Google Scholar]
- 10.Seog, J., D. Dean, B. Rolauffs, T. Wu, J. Genzer, A. H. K. Plaas, A. J. Grodzinsky, and C. Ortiz. 2005. Nanomechanics of opposing glycosaminoglycan macromolecules. J. Biomech. 38:1789–1797. [DOI] [PubMed] [Google Scholar]
- 11.Dean, D., L. Han, C. Ortiz, and A. J. Grodzinsky. 2005. Nanoscale conformation and compressibility of cartilage aggrecan using microcontact printing and atomic force microscopy. Macromolecules. 38:4047–4049. [Google Scholar]
- 12.Dean, D., L. Han, A. J. Grodzinsky, and C. Ortiz. 2006. Compressive nanomechanics of opposing aggrecan macromolecules. J. Biomech. 39:2555–2565. [DOI] [PubMed] [Google Scholar]
- 13.Dean, D., J. Seog, C. Ortiz, and A. J. Grodzinsky. 2003. Molecular-level theoretical model for electrostatic interactions within polyelectrolyte brushes: applications to charged glycosaminoglycans. Langmuir. 19:5526–5539. [Google Scholar]
- 14.Stolz, M., R. Raiteri, A. U. Daniels, M. R. VanLandingham, W. Baschong, and U. Aebi. 2004. Dynamic elastic modulus of porcine articular cartilage determined at two different levels of tissue organization by indentation-type atomic force microscopy. Biophys. J. 86:3269–3283. [DOI] [PMC free article] [PubMed] [Google Scholar]
- 15.Ebenstein, D. M., A. Kuo, J. J. Rodrigo, A. H. Reddi, M. Ries, and L. Pruitt. 2004. A nanoindentation technique for functional evaluation of cartilage repair tissue. J. Mater. Res. 19:273–281. [Google Scholar]
- 16.Kilger, R., R. Gottardi, L. Aeschimann, V. Cardinali, R. Imer, U. Konig, R. Raiteri, U. Staufer, M. Stolz, U. Aebi, and N. Friederich. 2006. Towards early detection of osteoarthritis: assessing human articular cartilage by scanning force microscopy. Trans. Orthop. Res. Soc. 31:1507. [Google Scholar]
- 17.Fujii, T., Y. L. Sun, K. N. An, and Z. P. Luo. 2002. Mechanical properties of single hyaluronan molecules. J. Biomech. 35:527–531. [DOI] [PubMed] [Google Scholar]
- 18.Haverkamp, R. G., M. A. Williams, and J. E. Scott. 2005. Stretching single molecules of connective tissue glycans to characterize their shape-maintaining elasticity. Biomacromolecules. 6:1816–1818. [DOI] [PubMed] [Google Scholar]
- 19.Raviv, U., S. Giasson, N. Kampf, J. F. Gohy, R. Jerome, and J. Klein. 2003. Lubrication by charged polymers. Nature. 425:163–165. [DOI] [PubMed] [Google Scholar]
- 20.Benz, M., N. H. Chen, and J. Israelachvili. 2004. Lubrication and wear properties of grafted polyelectrolytes, hyaluronan and hylan, measured in the surface forces apparatus. J. Biomed. Mater. Res. A. 71A:6–15. [DOI] [PubMed] [Google Scholar]
- 21.Zhu, Y. X., and S. Granick. 2003. Biolubrication: hyaluronic acid and the influence on its interfacial viscosity of an antiinflammatory drug. Macromolecules. 36:973–976. [Google Scholar]
- 22.Tadmor, R., N. H. Chen, and J. Israelachvili. 2003. Normal and shear forces between mica and model membrane surfaces with adsorbed hyaluronan. Macromolecules. 36:9519–9526. [Google Scholar]
- 23.Krishnan, R., M. Caligaris, R. L. Mauck, C. T. Hung, K. D. Costa, and G. A. Ateshian. 2004. Removal of the superficial zone of bovine articular cartilage does not increase its friction coefficient. Osteoarthr. Cartil. 12:947–955. [DOI] [PMC free article] [PubMed] [Google Scholar]
- 24.Park, S., K. D. Costa, and G. A. Ateshian. 2004. Microscale frictional response of bovine articular cartilage from atomic force microscopy. J. Biomech. 37:1679–1687. [DOI] [PMC free article] [PubMed] [Google Scholar]
- 25.Zhu, W. B., V. C. Mow, T. J. Koob, and D. R. Eyre. 1993. Viscoelastic shear properties of articular-cartilage and the effects of glycosidase treatments. J. Orthop. Res. 11:771–781. [DOI] [PubMed] [Google Scholar]
- 26.Bursac, P., C. V. McGrath, S. R. Eisenberg, and D. Stamenovic. 2000. A microstructural model of elastostatic properties of articular cartilage in confined compression. J. Biomech. Eng. Trans. ASME. 122:347–353. [DOI] [PubMed] [Google Scholar]
- 27.Maroudas, A. 1980. Physical chemistry of articular cartilage and the intervertebral disk in joints and synovial fluid. In The Joints and Synovial Fluid. Academic Press, London.
- 28.Wilbur, J. L., A. Kumar, E. Kim, and G. M. Whitesides. 1994. Microfabrication by microcontact printing of self-assembled monolayers. Adv. Mater. 6:600–604. [Google Scholar]
- 29.Farndale, R. W., D. J. Buttle, and A. J. Barrett. 1986. Improved quantitation and discrimination of sulphated glycosaminoglycans by use of dimethylmethylene blue. Biochim. Biophys. Acta. 883:173–177. [DOI] [PubMed] [Google Scholar]
- 30.Takano, H., J. R. Kenseth, S. S. Wong, J. C. O'Brien, and M. D. Porter. 1999. Chemical and biochemical analysis using scanning force microscopy. Chem. Rev. 99:2845–2890. [DOI] [PubMed] [Google Scholar]
- 31.Carpick, R. W., and M. Salmeron. 1997. Scratching the surface: fundamental investigations of tribology with atomic force microscopy. Chem. Rev. 97:1163–1194. [DOI] [PubMed] [Google Scholar]
- 32.Leggett, G. J. 2003. Friction force microscopy of self-assembled monolayers: probing molecular organization at the nanometer scale. Anal. Chim. Acta. 479:17–38. [Google Scholar]
- 33.Meyer, E., R. M. Overney, K. Dransfeld, and T. Gyalog. 1999. Nanoscience: Friction and Rheology on the Nanometer Scale. World Scientific, River Edge, NJ.
- 34.Ogletree, D. F., R. W. Carpick, and M. Salmeron. 1996. Calibration of frictional forces in atomic force microscopy. Rev. Sci. Instrum. 67:3298–3306. [Google Scholar]
- 35.Varenberg, M., I. Etsion, and G. Halperin. 2003. An improved wedge calibration method for lateral force in atomic force microscopy. Rev. Sci. Instrum. 74:3362–3367. [Google Scholar]
- 36.Hutter, J. L., and J. Bechhoefer. 1993. Calibration of atomic-force microscope tips. Rev. Sci. Instrum. 64:1868–1873. [Google Scholar]
- 37.Tomlinson, G. A. 1929. The molecular theory of friction. Philos. Mag. 7:905–916. [Google Scholar]
- 38.van der Vegte, E. W., and G. Hadziioannou. 1997. Scanning force microscopy with chemical specificity: an extensive study of chemically specific tip-surface interactions and the chemical imaging of surface functional groups. Langmuir. 13:4357–4368. [Google Scholar]
- 39.Reference deleted in proof.
- 40.van der Vegte, E. W., and G. Hadziioannou. 1997. Acid-base properties and the chemical imaging of surface-bound functional groups studied with scanning force microscopy. J. Phys. Chem. B. 101:9563–9569. [Google Scholar]
- 41.Gao, J. P., W. D. Luedtke, and U. Landman. 1998. Friction control in thin-film lubrication. J. Phys. Chem. B. 102:5033–5037. [Google Scholar]
- 42.Martin, J. I., and Z. G. Wang. 1995. Polymer brushes—scaling, compression forces, interbrush penetration, and solvent size effects. J. Phys. Chem. 99:2833–2844. [Google Scholar]
- 43.Happel, J. 1959. Viscous flow relative to arrays of cylinders. AIChE J. 5:174–177. [Google Scholar]
- 44.Eisenberg, S. R., and A. J. Grodzinsky. 1988. Electrokinetic micromodel of extracellular matrix and other polyelectrolytes networks. Physicochem. Hydrodyn. 10:517–539. [Google Scholar]
- 45.Mow, V. C., S. C. Kuei, W. M. Lai, and C. G. Armstrong. 1980. Biphasic creep and stress-relaxation of articular-cartilage in compression—theory and experiments. J. Biomech. Eng. Trans. ASME. 102:73–84. [DOI] [PubMed] [Google Scholar]
- 46.Frank, E. H., and A. J. Grodzinsky. 1987. Cartilage electromechanics. II. A continuum model of cartilage electrokinetics and correlation with experiments. J. Biomech. 20:629–639. [DOI] [PubMed] [Google Scholar]
- 47.Charras, G. T., J. C. Yarrow, M. A. Horton, L. Mahadevan, and T. J. Mitchison. 2005. Non-equilibration of hydrostatic pressure in blebbing cells. Nature. 435:365–369. [DOI] [PMC free article] [PubMed] [Google Scholar]
- 48.Feiler, A., M. A. Plunkett, and M. W. Rutland. 2003. Atomic force microscopy measurements of adsorbed polyelectrolyte layers. 1. Dynamics of forces and friction. Langmuir. 19:4173–4179. [Google Scholar]
- 49.Green, C. P., H. Lioe, J. P. Cleveland, R. Proksch, P. Mulvaney, and J. E. Sader. 2004. Normal and torsional spring constants of atomic force microscope cantilevers. Rev. Sci. Instrum. 75:1988–1996. [Google Scholar]
- 50.Cain, R. G., S. Biggs, and N. W. Page. 2000. Force calibration in lateral force microscopy. J. Colloid Interface Sci. 227:55–65. [DOI] [PubMed] [Google Scholar]
- 51.Feiler, A., P. Attard, and I. Larson. 2000. Calibration of the torsional spring constant and the lateral photodiode response of frictional force microscopes. Rev. Sci. Instrum. 71:2746–2750. [Google Scholar]
- 52.Hector, L. G., and S. R. Schmid. 1998. Simulation of asperity plowing in an atomic force microscope. I: Experimental and theoretical methods. Wear. 215:247–256. [Google Scholar]
- 53.Liu, E., B. Blanpain, and J. P. Celis. 1996. Calibration procedures for frictional measurements with a lateral force microscope. Wear. 192:141–150. [Google Scholar]
- 54.Ecke, S., R. Raiteri, E. Bonaccurso, C. Reiner, H. J. Deiseroth, and H. J. Butt. 2001. Measuring normal and friction forces acting on individual fine particles. Rev. Sci. Instrum. 72:4164–4170. [Google Scholar]
- 55.Stiernstedt, J., M. W. Rutland, and P. Attard. 2006. Erratum: A novel technique for the in situ calibration and measurement of friction with the atomic force microscope (vol 76, pg 083710, 2005). Rev. Sci. Instrum. 77:019901. [Google Scholar]
- 56.Stiernstedt, J., M. W. Rutland, and P. Attard. 2005. A novel technique for the in situ calibration and measurement of friction with the atomic force microscope. Rev. Sci. Instrum. 76:083710. [Google Scholar]
- 57.Bogdanovic, G., A. Meurk, and M. W. Rutland. 2000. Tip friction—torsional spring constant determination. Coll. Surf. B. 19:397–405. [DOI] [PubMed] [Google Scholar]
- 58.Cain, R. G., M. G. Reitsma, S. Biggs, and N. W. Page. 2001. Quantitative comparison of three calibration techniques for the lateral force microscope. Rev. Sci. Instrum. 72:3304–3312. [Google Scholar]
- 59.Sundararajan, S., and B. Bhushan. 2000. Topography-induced contributions to friction forces measured using an atomic force/friction force microscope. J. Appl. Phys. 88:4825–4831. [Google Scholar]


