

Abstract
Effect of intravenous amino acids on glutamine and protein kinetics in low-birth-weight preterm infants during the immediate neonatal period. Am J Physiol Endocrinol Metab 290: E622-E630, 2006. First published November 1, 2005; doi:10.1152/ajpendo.00274.2005.—Glutamine may be a conditionally essential amino acid in low-birth-weight (LBW) preterm neonates. Exogenously administered amino acids, by providing anaplerotic carbon into the tricarboxylic acid cycle, could result in greater cataplerotic efflux and glutamine de novo synthesis. The effect of dose and duration of amino acid infusion on glutamine and nitrogen (N) kinetics was examined in LBW infants in the period immediately after birth. Preterm neonates (<32 weeks gestation, birth weights 809-1,755 g) were randomized to initially receive either 480 or 960 μmol·kg-1·h-1 of an intravenous amino acid solution for 19 -24 hours, followed by a higher or lower amino acid load for either5hor 24 h. Glutamine de novo synthesis, leucine N, phenylalanine, and urea kinetics were determined using stable isotopic tracers. An increase in amino acid infusion from 480 to 960 μmol·kg-1·h-1 for 5 h resulted in decreased glutamine de novo synthesis in every neonate (384.4 ± 38.0 to 368.9 ± 38.2 μmol·kg-1·h-1, P < 0.01) and a lower whole body rate of proteolysis (P < 0.001) and urea synthesis (P < 0.001). However, when the increased amino acid infusion was extended for 24 h, glutamine de novo synthesis increased (369.7 ± 92.6 to 483.4 ± 97.5 μmol·kg-1·h-1, P < 0.001), whole body rate of proteolysis did not change, and urea production increased. Decreasing the amino acid load resulted in a decrease in glutamine rate of appearance (Ra) and leucine N Ra, but had no effect on phenylalanine Ra. Acutely stressed LBW infants responded to an increase in amino acid load by transiently suppressing whole body rate of glutamine synthesis, proteolysis, and oxidation of protein. The mechanisms of this transient effect on whole body protein/nitrogen metabolism remain unknown.
Keywords: stable isotope tracers, glutamine metabolism, protein metabolism, very low birth weight, neonates
GLUTAMINE IS A NONESSENTIAL AMINO ACID that is synthesized by every tissue in the body. It is the most abundant amino acid in the intracellular and extracellular compartments. Glutamine serves as a major interorgan shuttle of carbon and nitrogen (6), participates in several key metabolic processes (31), and is a primary oxidative fuel for enterocytes (25) and lymphocytes (17). Glutamine pools may decrease under times of illness or stress (3, 4, 8, 15), and it has been suggested that glutamine becomes conditionally essential (13), such as might occur during the immediate neonatal period in preterm infants. Several clinical studies have evaluated the efficacy of glutamine supplementation in reducing mortality and certain morbidities in preterm neonates, with equivocal results (14, 16, 22, 27, 29). However, a recent study demonstrated that intravenous glutamine, given as part of the total parenteral nutrition (TPN), can reduce whole body proteolysis in LBW preterm infants at 1 wk of life (10). Because current parenteral amino acid solutions do not contain glutamine, a method to increase de novo glutamine synthesis might be useful and could provide a clinical benefit to the preterm neonate.
Glutamine can be synthesized de novo from glutamate by glutamine synthetase (30). Cataplerotic efflux of α-ketoglutarate carbons from the tricarboxylic acid (TCA) cycle with subsequent transamination with branched-chain amino acids leads to glutamate synthesis (18). The cataplerotic efflux of TCA cycle intermediates is balanced by an influx of carbon termed anaplerosis. Various amino acids can serve in anaplerosis. Therefore, an increase in anaplerotic influx of amino acid carbons into the TCA cycle by increased administration of amino acids could result in greater de novo glutamine synthesis.
Although an increase in administered amino acids would seem to be a reasonable strategy to increase de novo glutamine synthesis, the additional amino acids may be oxidized and not utilized for protein synthesis, especially in low-birth-weight preterm infants who are stressed or acutely ill in the immediate neonatal period. Therefore, we hypothesize that an increased dose of intravenous amino acids during the immediate neonatal period will result in increased de novo glutamine synthesis and will largely be oxidized and not utilized for protein synthesis. In the present study, by employing a randomized design and stable isotopic tracers, we have examined the effect of increasing or decreasing the amino acid load on whole body leucine nitrogen (N), glutamine, and urea kinetics. The effect of an increased or decreased dose of amino acids on glutamine, urea, and protein kinetics was examined over a short period (5 h) and over an extended period (24 h) of infusion of the amino acids. The latter was done to ensure that the data obtained in the short study was not the consequence of a lack of isotopic equilibrium in glutamine and urea pools. In addition, because whole body protein breakdown is a significant endogenous contributor to the anaplerotic flux, the whole body rate of proteolysis was quantified by measuring whole body rate of phenylalanine turnover.
METHODS
Subjects
Preterm neonates <48 h after birth with gestational age ≤32 wk and birth weight between 750 and 2,000 g were eligible for participation in the study protocol. Neonates with congenital or chromosome anomalies requiring high-frequency ventilation or inotropic support, suspected perinatal-neonatal asphyxia, or mothers who used β-blockers antenatally were excluded. The study was conducted in the Neonatal Intensive Care Unit at MetroHealth Medical Center (MHMC), Case Western Reserve University. After permission was obtained from the attending neonatologist in charge of each infant’s clinical care (never one of the study investigators), written informed consent was obtained from the infant’s mother (and both parents when possible). The study was approved by the Institutional Review Board of MHMC and met all applicable Health Insurance Portability and Accountability Act standards.
Twenty-six neonates were randomized into the study protocol. Two subjects were withdrawn after randomization and after receiving the study TPN solution for the following clinical reasons: one developed significant respiratory distress requiring intubation immediately preceding collection of final blood sample during tracer isotope infusion, and the other developed a persistent and significant hypernatremia. Two subjects were withdrawn for technical reasons. Of the remaining 22 neonates, 12 completed the short study and 10 completed the extended study.
There were no differences between any groups for the gestational age, birth weight, median 5-min APGAR score, score of neonatal acute physiology (SNAP), or age at initiation of the study protocol. A majority (14 of 22) of the neonates were on mechanical ventilation or supplemental oxygen (18 of 22). None of the study subjects received vasopressor agents during the study and none had blood culture-positive sepsis.
Study protocol
Study subjects were randomized to receive an amino acid infusion of either 480 or 960 μmol·kg-1·h-1 (equaling 1.5 or 3.0 g·kg-1·day-1, respectively) as part of their TPN. Commercially available amino acid solution TrophAmine was used (B. Braun Medical, Irvine, CA). TrophAmine contains no glutamine. The amino acid composition of TrophAmine and infusion rates of each amino acid are given in Table 1. The amino acid infusion was started within 48 h after birth. All infants were receiving intravenous glucose (∼6-8 mg·kg-1·min-1) before the study protocol was initiated. Only three infants were receiving parenteral amino acids before the study was started, and no infant received enteral nutrition before or during the study. The clinical care of the infants was managed by the clinical service and not by the study investigators. The glucose load remained constant for any individual subject during the study and ranged between 6 and 8 mg·kg-1·min-1. All study subjects received 0.5 g·kg-1·day-1 fat emulsion (Intralipid; Baxter Healthcare, Deer-field, IL). The study was divided into two components: a “short” and an “extended” study, with a crossover design employed for each (Fig. 1, A and B). For the short study, the subjects received the initial amino acid infusion for 19 h (1.5 or 3.0 g · kg-1·day-1, depending on randomization), followed by the other infusion (1.5 or 3.0 g·kg-1·d-1) for 5 h. For the extended study, the study subjects received each of the amino acid infusions for 24 h.
Table 1.
Composition and rate of delivery of parenteral amino acids*
| TrophAmine, g/100 ml | 1.5 g·kg-1·day-1, μmol·kg-1·h-1 | 3.0 g·kg-1·day-1, μmol·kg-1·h-1 | |
|---|---|---|---|
| Leucine | 1.40 | 66.8 | 133.6 |
| Isoleucine | 0.82 | 39.1 | 78.2 |
| Valine | 0.78 | 41.7 | 83.3 |
| Lysine | 0.82 | 34.9 | 69.7 |
| Phenylalanine | 0.48 | 18.2 | 36.4 |
| Tryptophan | 0.20 | 6.1 | 12.3 |
| Threonine | 0.42 | 22.1 | 44.1 |
| Methionine | 0.34 | 14.0 | 28.0 |
| Histidine | 0.48 | 19.2 | 38.5 |
| Glutamate | 0.50 | 21.4 | 42.8 |
| Arginine | 1.20 | 42.9 | 85.7 |
| Alanine | 0.54 | 37.9 | 75.8 |
| Aspartate | 0.32 | 15.2 | 30.3 |
| Glycine | 0.36 | 30.0 | 60.0 |
| Tyrosine | 0.24 | 8.3 | 16.6 |
| Proline | 0.68 | 37.0 | 73.9 |
| Serine | 0.38 | 22.6 | 45.2 |
| Taurine | 0.03 | 1.2 | 2.5 |
| Total | 9.99 | 478.6 | 956.9 |
Cysteine added to final solution as cysteine hydrochloride at 40 mg/g total protein for both groups.
Fig. 1.

Schematic of study design. A: short study. B: extended study. AA, amino acids.
Tracer infusion
Stable isotope-labeled phenylalanine, urea, and leucine were purchased from Merck (Dorval, QC, Canada), and the stable isotope-labeled glutamine was purchased from Cambridge Isotope Laoratories (Andover, MA). Each stable isotopic tracer was ≥98% atom enriched for 15N, 13C, or 2H and tested for sterility and pyrogenicity. Each tracer was administered intravenously by prime-constant rate infusion at the following rates: l-[2H5]phenylalanine (prime 6 μmol/kg, constant rate 4 μmol · kg-1 · h-1), l-[1-13C,15N]leucine (prime 7.5 μmol/kg, constant rate 7.5 μmol · kg-1 · h-1), [15N2]urea (prime 33 μmol/kg, constant rate 3.3 μmol · kg-1 · h-1), and l-[5-15N]glutamine (prime 30 μmol/kg, constant rate 30 μmol · kg-1 · h-1). For the short study, the tracer infusion was begun at time 0 and infused for a total of 9 h (Fig. 1A); for the extended study, the tracer infusion lasted 4h on each day (Fig. 1B). The rate of the tracer infusion was confirmed gravimetrically at the end of each study, with the same tubing and infusion pump being used.
Blood sampling
For the short study, blood was obtained in heparinized tubes before (time 0) and at 3.5, 3.75, and 4.0 h after the isotopic tracer infusion was begun. After the 4.0-h sample was obtained, the amino acid infusion was changed, and then blood was sampled again at 8.0, 8.5, and 9.0 h. As with the short study, blood was sampled before (time 0) and after the tracer infusion was begun at 3.5, 3.75, and 4.0 h on the 1st and 2nd days. Blood was sampled from an existing umbilical artery catheter (placed for clinical reasons) or from an indwelling 24-gauge angiocatheter. The amount of blood sampled did not exceed the limit set by the MHMC Institutional Review Board (4.0 ml/kg body wt or <5% of the estimated total blood volume of 80 ml/kg). The catheters were kept patent by infusing 0.45% NaCl plus heparin (0.5 U/ml).
Analytical methods
Plasma amino acid concentrations were determined using precolumn o-phthaldialdehyde derivatization and reverse-phase HPLC (28). Glutamate levels are not reported in the short study because the glutamate peak migration times were inconsistent for these samples. The concentration of each amino acid in the tracer infusion solution was determined using the same method. Insulin concentrations were determined in heparinized plasma by using an ELISA kit (Linco Research, St. Charles, MO). The sensitivity of the assay allowed for good discrimination of insulin values between 2 and 10 μU/ml. The total cortisol concentration in plasma was measured using the Coat-A-Count radioimmunoassay kit (Diagnostic Products, Los Angeles, CA). The assay was linear between 1 and 50 μg/dl. Blood glucose levels were measured by the glucose oxidase method by using a YSI 2300 Stat Glucose Lactate analyzer (YSI, Yellow Springs, OH). Urea nitrogen concentration was measured by the urease method with a BUN Analyzer 2 (Beckman Instruments, Fullerton, CA).
The methods for measuring the enrichment (molar percent excess) of stable isotopic tracers in plasma have been previously described from our laboratory (11, 19, 20). Briefly, plasma was deproteinized by using 10% trichloroacetic acid and having it stored at -80°C until analysis. The amino acids and urea were isolated by ion exchange chromatography and specific derivatives for each were prepared. The enrichments of the amino acid and urea derivatives were then determined by gas chromatography-mass spectroscopy. Standard solutions of known enrichments were run simultaneously to correct for instrumental variations.
Calculations
The rates of appearance (Ra) in plasma of phenylalanine, urea, leucine, and glutamine were determined by tracer dilution, with Ra = I × [(Ei/Ep) -1]. I is the rate of tracer infusion (in μmol·kg-1·h-1), Ei is the enrichment of the infusate amino acid, and Ep is the enrichment in plasma of the anylate amino acid. For urea and each amino acid tracer, an isotopic steady state was achieved. The endogenous rate of appearance of phenylalanine was determined by subtracting the exogenously delivered phenylalanine from the total Ra. TrophAmine delivers 18.2 or 36.4 μmol·kg-1·h-1 of phenylalanine when the amino acids are infused at 1.5 or 3.0 g·kg-1·h-1, respectively (Table 1). The endogenous phenylalanine Ra in plasma gives an estimate of the rate of breakdown of whole body protein (9). The total glutamine Ra measures glutamine derived from both protein breakdown and de novo synthesis. Because glutamine and phenylalanine exist in a molar ratio of 1.07:1 in mixed muscle protein (12, 26), and assuming this ratio is constant, then glutamine Ra from protein breakdown = 1.07 × endogenous phenylalanine Ra, and de novo glutamine synthesis = total glutamine Ra-glutamine Ra from protein breakdown.
Statistics
All data are reported as means ± SD. A paired Student’s t-test was used where appropriate. Associations between variables were determined by calculating the Pearson correlation coefficient. Statistical analyses were performed using a commercial software (Statistix 7.0 Analytical Software, Tallahassee, FL). A value of P < 0.05 was considered statistically significant.
RESULTS
Demographic and clinical characteristics
The demographic and clinical characteristics of the study subjects in the various groups shown in Table 2 were comparable. In the short study, seven subjects were randomized to receive 1.5 g·kg-1·day-1 amino acid infusion for 19 h and then switched to 3.0 g·kg-1·day-1 for 5 h; five received 3.0 g·kg-1·day-1 for 19 h and then switched to 1.5 g·kg-1·day-1 for 5 h. In the extended study, five babies received the 1.5 g·kg-1·day-1 amino acid infusion for 24 h and were then switched to 3.0 g·kg-1·day-1 for 24 h; another five neonates received 3.0 g·kg-1·day-1 for 24 h and then 1.5 g·kg-1·day-1 for 24 h.
Table 2.
Demographic and clinical characteristics of study subjects
| 1.5 to 3.0 g·kg-1·day-1* |
3.0 to 1.5 g·kg-1·day-1† |
|||
|---|---|---|---|---|
| Short Study (n = 7) | Extended Study (n = 5) | Short Study (n = 5) | Extended Study (n = 5) | |
| Gestational age, wk | 29.4 ± 2.4 | 28.6 ± 2.5 | 30.4 ± 1.7 | 29.4 ± 2.0 |
| Birth weight, g | 1,234 ± 282 | 1,047 ± 229 | 1,360 ± 273 | 1,173 ± 259 |
| Median 5 min Apgar score (range) | 8 (5-9) | 9 (6-10) | 9 (5-9) | 8 (6-9) |
| Median SNAP (range) | 8 (1-18) | 8 (1-18) | 9 (5-21) | 9 (5-21) |
| Age (h) at start of AA infusion (range) | 37.7 ± 12.1 (18-48) | 31.6 ± 11.4 (19-44) | 31.0 ± 15.3 (15-48) | 28.0 ± 7.9 (18-37) |
Data presented are means ± SD, unless otherwise indicated. SNAP, score of neonatal acute physiology; AA, amino acid. Short study indicates that initial AA infusion was given for 19 h and then switched to a different amino acid infusion for the next 5 h. Extended study indicates that initial AA infusion was given for 24 h and then switched to a different AA infusion for the next 24 h.
Received 1.5 g·kg-1·day-1 AA infusion and then switched to 3.0 g·kg-1·day-1.
Received 3.0 g·kg-1·day-1 initially and then switched to 1.5 g·kg-1·day-1. There were no statistically significant differences between the groups for the given variables.
The fluid and energy intakes of the study subjects are shown in Table 3. On the basis of the clinical practice at our institution, the intravenous nonprotein energy intake remained low (∼40 kcal·kg-1·day-1) during the initial 48 -72 h after birth and was not different between any of the groups. The actual amino acid intakes for each group were close to those that were planned.
Table 3.
Fluid and energy intakes
| 1.5 to 3.0 g·kg-1·day-1* |
3.0 to 1.5 g·kg-1·day-1† |
|||||||
|---|---|---|---|---|---|---|---|---|
| Short Study (n = 7) | Extended Study (n = 5) | Short Study (n = 5) | Extended Study (n = 5) | |||||
| AA infusion, g·kg-1·day-1 | 1.5 (19 h) | 3.0 (5 h) | 1.5 (24h) | 3.0 (24h) | 3.0 (19h) | 1.5 (5h) | 3.0 (24h) | 1.5 (24h) |
| Total fluid intake, ml·kg-1·day-1 | 109±15 | 109±16 | 116±8 | 131±12 | 105±15 | 106±15 | 99±4 | 110±9 |
| Glucose infusion rate, mg kg1 min1 | 7.3±0.6 | 7.3±0.5 | 8.0±0.6 | 7.8±0.3 | 7.3±0.9 | 7.3±1.0 | 6.9±0.2 | 7.4±0.6 |
| Actual AA intake, g·kg-1·day-1 | 1.51±0.04 | 3.01±0.02 | 1.54±0.02 | 3.05±0.07 | 2.98±0.05 | 1.48±0.05 | 3.04±0.05 | 1.52±0.04 |
| Nonprotein energy intake, kcal·kg-1·day-1 | 40±4 | 40±3 | 44±6 | 40±7 | 41±5 | 41±5 | 40±2 | 41±4 |
| Total energy intake, kcal·kg-1·day-1 | 46±4 | 52±3 | 50±6 | 52±7 | 52±5 | 47±5 | 52±2 | 47±4 |
Data presented are means ± SD.
Received 1.5 g·kg-1·day-1AA infusion initially and then switched to 3.0 g·kg-1·day-1.
Received 3.0 g kg1 day1 initially and then switched to 1.5 g·kg-1·day-1.
There were no differences in blood oxygen levels or acid-base status (pH and bicarbonate) between any of the groups (Table 4). Renal function, as assessed by determination of blood urea nitrogen and plasma creatinine, was also not different between any of the groups.
Table 4.
Acid-base, oxygenation, and renal function
| 1.5 to 3.0 g·kg-1·day-1* |
3.0 to 1.5 g·kg-1·day-1† |
|||||||
|---|---|---|---|---|---|---|---|---|
| Short Study (n = 7) | Extended Study (n = 5) | Short Study (n = 5) | Extended Study (n = 5) | |||||
| AA load, g·kg−-1·day−1 | 1.5 (19h) | 3.0 (5 h) | 1.5 (24 h) | 3.0 (24 h) | 3.0 (19 h) | 1.5 (5 h) | 3.0 (24 h) | 1.5 (24 h) |
| pH | 7.29±0.05 | 7.29±0.03 | 7.30±0.04 | 7.26±0.02 | 7.30±0.05 | ND | 7.27±0.02 | 7.24±0.04 |
| Bicarbonate, mmol/l | 20.7±1.1 | 20.0±0.5 | 22.0±1.5 | 19.3±1.5 | 20.6±1.0 | ND | 19.2±0.8 | 17.8±1.1 |
| PaO2, mmHg | 81.9 11.9 | 79.5 2.1 | 73.6 3.5 | 75.3 16.0 | 84.2 16.3 | ND | 71.2 25.9 | 57.6 3.9 |
| Serum creatinine, mg/dl | 0.9 0.1 | ND | 0.9 0.1 | 0.8 0.2 | 0.9 0.1 | ND | 0.8 0.1 | 0.8 0.1 |
Data presented are means ± SD.
Received 1.5 g·kg-1·day-1 AA infusion initially and then switched to 3.0 g·kg-1·day-1.
Received 3.0 g kg1 day1AA infusion initially, then switched to 1.5 g·kg-1·day-1. ND, data not available.
There was no statistical difference between any observed variable by Student’s t-test for paired data.
Blood glucose, plasma insulin, and plasma total cortisol concentrations
Blood glucose, plasma insulin, and plasma total cortisol concentrations were measured near the completion of each respective amino acid infusion. There were no statistically significant differences in these levels during different doses of administered intravenous amino acids (Table 5).
Table 5.
Plasma glucose, insulin, and cortisol
| 1.5 to 3.0 g·kg-1·day-1 |
3.0 to 1.5 g·kg-1·day-1 |
|||||||
|---|---|---|---|---|---|---|---|---|
| Short Study (n = 7) | Extended Study (n = 5) | Short Study (n = 5) | Extended Study (n = 5) | |||||
| AA load, g·kg-1·day-1 | 1.5 (19 h) | 3.0 (5 h) | 1.5 (24 h) | 3.0 (24 h) | 3.0 (19 h) | 1.5 (5 h) | 3.0 (24 h) | 1.5 (24 h) |
| Glucose, mg/dl | 83±27 | 75±20 | 99±40 | 86±31 | 67±8 | 67±12 | 60±3 | 65±9 |
| Insulin, μU/ml | 4.9±2.0 | 7.8±5.6 | 7.4±3.7 | 11.5±5.4 | 10.2±6.1 | 9.8±5.4 | 7.1±3.9 | 5.3±2.6 |
| Cortisol, μg/dl | 8.8±3.6 | 10.8±3.8 | 12.7±7.0 | 15.4±8.2 | 11.5±4.0 | 11.5±3.7 | 9.8±4.4 | 11.1±3.9 |
Data presented are means ± SD. There was no statistical difference between any observed variable by Student’s t-test for paired data.
Plasma amino acid concentrations
The plasma concentrations of each essential amino acid increased when the amino acid infusion was increased in both the short and extended studies (Table 6). For the branched-chain amino acids, this increase was proportional to the amino acid load. Despite the absence of glutamine in the TrophAmine solution, plasma glutamine levels increased in all neonates, with a mean increase of 83 μmol/l for the short study and 180 μmol/l for the extended study. With the exception of asparagine, the other nonessential amino acid levels also increased. Switching to the lower amino acid infusion for 5 h did not causes changes in glutamine levels. However, the plasma glutamine concentration decreased significantly (P < 0.05) in all neonates when the lower amino acid infusion was given for 24 h (during the extended study; Table 6).
Table 6.
AA concentrations in plasma in short and extended studies
| Short Study |
Extended Study |
|||||||
|---|---|---|---|---|---|---|---|---|
| 1.5 to 3.0 g·kg-1·day-1 (n = 7) |
3.0 to 1.5 g·kg-1·day-1 (n = 5) |
1.5 to 3.0 g·kg-1·day-1 (n = 5) |
3.0 to 1.5 g·kg-1·day-1 (n = 5) |
|||||
| AA Load, g. kg-1 day-1 | 1.5 | 3.0 | 3.0 | 1.5 | 1.5 | 3.0 | 3.0 | 1.5 |
| Leucine | 103±13 | 177±15† | 176±24 | 123±26* | 95±13 | 183±22† | 196±24 | 122±14† |
| Isoleucine | 46±7 | 88±10† | 87±13 | 54±9† | 44±5 | 91±9† | 99±12 | 58±7† |
| Valine | 132±18 | 230±29† | 253±42 | 187±46* | 130±12 | 273±29† | 284±37 | 166±14† |
| Lysine | 110±26 | 185±29† | 253±42 | 193±74 | 84±9 | 188±28† | 239±39 | 130±45† |
| Phenylalanine | 68±7 | 94±12† | 93±13 | 78±12* | 67±8 | 91±14† | 118±15 | 90±15† |
| Tryptophan | 30±5 | 39±8† | 42±2 | 34±8* | 30±4 | 45±10* | 46±4 | 40±3* |
| Threonine | 91±31 | 137±34† | 212±83 | 185±94 | 74±20 | 146±46* | 192±33 | 158±23† |
| Methionine | 21±6 | 40±10† | 74±11 | 49±8* | 19±7 | 59±26* | 73±25 | 30±8* |
| Histidine | 98±21 | 129±32† | 147±30 | 137±38 | 93±19 | 145±43* | 150±30 | 137±31 |
| Glutamine | 349±77 | 432±72† | 598±171 | 603±213 | 325±159 | 505±124* | 588±153 | 498±118* |
| Glutamate | 26±9 | 30±6 | 35±13 | 35±11 | ||||
| Asparagine | 12±1 | 12±3 | 20±10 | 26±12* | 11±4 | 14±5 | 14±3 | 20±3† |
| Arginine | 71±21 | 131±48† | 213±50 | 145±56† | 56±18 | 128±47† | 177±33 | 100±24† |
| Alanine | 91±34 | 125±55† | 169±25 | 125±26† | 85±39 | 143±62* | 154±31 | 109±28* |
| Aspartate | 7±2 | 10±4* | 11±4 | 6±2* | 8±3 | 11±2* | 10±4 | 12±4 |
| Glycine | 175±52 | 216±66* | 306±64 | 293±89 | 141±64 | 213±76* | 267±47 | 273±68 |
| Tyrosine | 70±42 | 85±50 | 106±54 | 105±79 | 70±53 | 99±76 | 155±61 | 132±29 |
| Serine | 115±32 | 158±36† | 212±47 | 186±49 | 86±18 | 172±39† | 188±57 | 153±28 |
| Ornithine | 52±17 | 112±32† | 171±48 | 125±64 | 36±6 | 114±36† | 204±42 | 76±21† |
| Citrulline | 27±7 | 36±9† | 45±10 | 42±18 | 14±4 | 25±12 | 24±5 | 17±3* |
| Taurine | 24±8 | 26±6 | 37±18 | 29±16 | 21±12 | 37±21 | 28±5 | 47±22 |
Data (μmol/l) presented are means ± SD.
P< 0.05;
P< 0.01 (1.5 vs. 3.0 g· kg1 day1) by Student’s t-test for paired data.
Phenylalanine kinetics
The whole body rate of protein breakdown was determined by measuring the Ra of phenylalanine in the blood (Table 7). The endogenous Ra of phenylalanine decreased significantly from 60.4 ± 13.9 to 51.2 ± 14.2 μmol·kg-1·h-1 (P < 0.001) in all seven neonates when the amino acid infusion was increased from 1.5 to 3.0 g·kg-1·day-1 for 5 h (Table 7). When the infusion was extended to 24 h, the phenylalanine Ra decreased in four of five neonates, but the decrease (from 65.5 ± 14.3 to 61.0 ± 9.1 μmol·kg-1·h-1) was not statistically significant. Lowering the amino acid infusion to 1.5 g·kg-1·day-1 from the initial 3.0 g·kg-1·day-1 in either the short or the extended study did not have any effect on phenylalanine Ra.
Table 7.
Ra of phenylalanine and urea
| 1.5 to 3.0 g·kg-1·day-1 |
3.0 to 1.5 g· kg-1 day-1 |
|||||||
|---|---|---|---|---|---|---|---|---|
| Short study (n = 7) | Extended study (n = 5) | Short study (n = 5) | Extended study (n = 5) | |||||
| AA load, g·kg-1·day-1 | 1.5 (19 h) | 3.0 (5 h) | 1.5 (24 h) | 3.0 (24 h) | 3.0 (19 h) | 1.5 (5 h) | 3.0 (24 h) | 1.5 (24 h) |
| Endogenous phenylalanine Ra | 60.4± 13.9 | 51.2± 14.2* | 65.5± 14.3 | 61.0± 9.1 | 61.2± 10.1 | 61.9± 9.3 | 64.5± 8.5 | 68.5± 6.8 |
| Urea Ra | 506.0± 140.2 | 426.6± 110.3† | 474.2± 336.3 | 851.6± 427.4* | 829.3± 303.4 | 637.0± 259.7† | 473.4± 243.4 | 548.2± 308.5 |
Data presented are means ± mol kg1 h1.
P < 0.01;
P < 0.001 compared with different AA load by Student’s SD. Values of rates of appearance (Ra) are t-test for paired data.
Urea kinetics
The Ra of urea was determined as a measure of irreversible whole body loss of nitrogen. The Ra of urea decreased during the short study in all subjects when the amino acid infusion was increased from 1.5 to 3.0 g·kg-1·day-1 (P < 0.001; Table 7). By contrast, extended infusion of a higher amino acid load for 24 h resulted in a significantly higher rate of urea synthesis (P < 0.01). For the neonates initially receiving 3.0 g · kg-1 · day-1 in the short study, urea synthesis decreased when the amino acid infusion was decreased, although no significant change in urea synthesis was seen when the lower amino acid infusion was given for 24 h.
Leucine N kinetics
Leucine N Ra increased when the amino acid infusion was increased in every study subject in both the short study (from 340.7 ± 38.0 to 427.4 ± 35.4 μmol·kg-1·h-1, P<0.001) and in the extended study (from 390.9 ± 84.2 to 542.6 ± 170.8 μmol·kg-1·h-1, P<0.05; Table 8). Leucine N Ra decreased when the amino acid load was lowered in either the short or extended study.
Table 8.
Ra of leucine N and glutamine
| 1.5 to 3.0 g·kg-1 day-1 |
3.0 to 1.5 g·kg-1 day-1 |
|||||||
|---|---|---|---|---|---|---|---|---|
| Short study (n = 7) | Extended study (n = 5) | Short study (n = 5) | Extended study (n = 5) | |||||
| AA load, g·kg-1 day-1 | 1.5 (19 h) | 3.0 (5 h) | 1.5 (24 h) | 3.0 (24 h) | 3.0 (19 h) | 1.5 (5 h) | 3.0 (24 h) | 1.5 (24 h) |
| Leucine N Ra | 340.7± 38.0 | 427.4± 35.4† | 390.7± 84.2 | 542.6± 170.8* | 467.0± 94.3 | 383.7± 60.4 | 505.9± 59.8 | 404.7± 57.7† |
| Total glutamine Ra | 449.0± 37.8 | 423.7± 37.2† | 439.7± 97.9 | 548.6± 102.6** | 570.2± 105.4 | 454.0± 82.9† | 541.8± 60.0 | 463.3± 40.5* |
| De novo glutamine synthesis | 384.4± 38.0 | 368.9± 38.2† | 369.7±92.6 | 483.4±97.5† | 504.7± 100.2 | 387.8 ±77.4† | 472.9± 53.4 | 390.0± 40.7* |
Data presented are means SD. Values for Ra and de novo synthesis are μmol·kg-1 h-1. N, nitrogen.
P < 0.05;
P < 0.01;
P < 0.001 as compared with different AA load by Student’s t-test for paired data.
Glutamine kinetics
The total Ra of glutamine represents the glutamine derived from both whole body protein breakdown and de novo synthesis. The total Ra of glutamine decreased in the short study when the amino acid infusion was increased from 1.5 to 3.0 g·kg-1·day-1 (449.0 ± 37.8 to 423.7 ± 37.2 μmol·kg-1·h-1, P<0.001; Table 8). A decrease in total glutamine Ra occurred in all seven neonates. By contrast, the greater amino acid infusion for 24 h was associated with higher total glutamine Ra. It increased from 439.7 ± 97.9 to 548.6 ± 102.6 μmol·kg-1·h-1 (P<0.01). However, for those neonates receiving the greater amino acid infusion initially, the total glutamine Ra decreased in both the short and extended study when the rate of infusion of amino acids was decreased. The rate of de novo glutamine synthesis was calculated by subtracting the glutamine derived from protein breakdown from the total Ra. The de novo glutamine synthesis decreased in every neonate when the amino acid load was increased from 1.5 to 3.0 g·kg-1·day-1 for 5 h (384.4 ± 38.0 to 368.9 ± 38.2 μmol·kg-1·h-1, P<0.01). However, when the greater amino acid infusion was given for 24 h, de novo glutamine synthesis significantly increased in every neonate (P<0.001). De novo glutamine synthesis also was higher when a greater amino acid load was initially administered in both the short and extended studies and decreased with a lower rate of amino acid infusion (Table 8).
Correlations
Plasma insulin and cortisol levels did not correlate with endogenous phenylalanine Ra, de novo glutamine synthesis, leucine N Ra, or urea Ra (data not shown).
DISCUSSION
Data from the present study show that LBW infants in the first few days after birth respond to an increase in exogenous amino acid administration by suppressing proteolysis and protein oxidation. However, the suppressive effect of increased amino acid load on protein breakdown was evident only acutely and was not seen when examined at 24 h of continued amino acid infusion. The rate of whole body protein degradation, irreversible nitrogen loss, and de novo glutamine synthesis appeared to be regulated by both the amount and duration of an intravenous amino acid infusion. An increased amino acid load given for a short period of time (5 h) suppressed the rate of whole body proteolysis. This suppression was associated with decreased urea and glutamine synthesis. The effect was transient, however, because when the increased amino acid infusion was given for an extended period (24 h), there was no change in proteolysis, and urea synthesis increased. The increased amino acid infusion for 24 h also resulted in an increase in de novo glutamine synthesis. Leucine N flux was related to the amount of the amino acid load, irrespective of the duration of the infusion.
The higher amino acid load from 480 to 960 μmol·kg-1·h-1 (1.5 to 3.0 g·kg-1·day-1) in the extended study resulted in an ∼25% molar increase in glutamine production rate, along with an ∼75% molar increase in urea production. Although the present studies were not designed to examine a detailed stoichiometry of nitrogen balance, these data suggest that most of the additional amino acid load given was oxidized with concomitant irreversible nitrogen loss. This large oxidative consumption of intravenous amino acids may have been related to the inability to utilize the administered amino acids for protein synthesis or the low total energy intake and clinical acuity of the study subjects. Despite this, de novo glutamine synthesis increased. It is unknown whether a further incremental increase in amino acid load or an increase in the duration of the infusion would result in additional glutamine synthesis or a change in proteolysis in this selected population of preterm neonates.
The rate of de novo glutamine synthesis was calculated by subtracting the estimated rate of glutamine release from proteolysis from total glutamine Ra measured by tracer isotope dilution. Glutamine and phenylalanine are released, during proteolysis, in proportion to their relative composition in the body proteins. Because skeletal muscle is the largest depot of body proteins and is the largest contributor to phenylalanine Ra, we, like other investigators (12, 26), used the relative relationship of phenylalanine and glutamine in skeletal muscle protein (1:1.07) to quantify the rate of release of glutamine from proteolysis in vivo. On the basis of these assumptions, whole body proteolysis contributed ∼15% to total glutamine Ra, and the majority (∼85%) of the total glutamine flux was contributed by de novo glutamine synthesis.
A number of other proteins with different relative phenylalanine and glutamine composition, compared with skeletal muscle proteins, contribute to the whole body protein turnover and, therefore, to the estimated phenylalanine Ra. An increase or decrease in the flux of these proteins could influence our estimates of contribution of proteolysis to glutamine Ra. Nevertheless, because the total mass of these proteins is relatively small compared with skeletal muscle, and because the contribution of de novo glutamine synthesis is relatively large, a change in the flux of these other proteins is likely to have negligible impact on the estimates of the rate of de novo glutamine synthesis, which is largely determined by the rate of anaplerotic flux or the rate of exogenous amino acid infusion.
A decrease in whole body proteolysis in response to a greater amino acid load, although seen only transiently in the present study, was comparable with certain previous reports in the literature. For example, decreased proteolysis occurred after a short (2.5 h) infusion of an amino acid solution in extremely premature, acutely ill neonates shortly after birth (∼3 days) (7). However, Poindexter et al. (24) demonstrated that, in more clinically stable LBW preterm infants at ∼6 days after birth, proteolysis was not suppressed when 1.2 g·kg-1·day-1 of an amino acid solution was given intravenously for 2.5 h after a glucose infusion alone. When this amino acid load was increased further to 2.4 g·kg-1·day-1 for 2.5 h, there was also no change in proteolysis. The differences seen in these reports might be related to differences in the acuity, gestational age, the birth weights of the respective patient populations studied, or the very short study period. The same authors demonstrated that proteolysis is decreased in healthy, stable-term newborns in response to an increased amino acid load (7, 23).
It has been suggested that glutamine is a conditionally essential amino acid during illness or stress (13). In the present study, the response to different amino acid loads was studied by 48 h after birth and completed no later than 90 h after birth. During this period of extrauterine transition, most of these neonates required mechanical ventilation and oxygen supplementation and were receiving low total energy and fluids. Despite this, de novo glutamine synthesis increased if greater carbon and nitrogen substrates were provided. It remains unclear, however, whether this degree of increased glutamine production is sufficient to meet the body’s metabolic demand for glutamine. Plasma levels of glutamine also increased significantly, even in the short study after 5 h, and continued to rise with an increased load for 24 h. Because the total glutamine Ra and de novo glutamine synthesis decreased in the short study, yet plasma glutamine levels increased, it suggests a shift in the regulation of glutamine transport into or from skeletal muscle in response to a greater amino acid load.
The transient change in whole body glutamine and nitrogen metabolism may be the result of a differential utilization of exogenously administered amino acids (Fig. 2). Increased amino acids delivered intravenously acutely caused suppression of proteolysis, resulting in less amino acids entering the TCA cycle, and that resulted in lower glutamine and urea flux. By contrast, after prolonged infusion of amino acids, protein turnover remained unchanged, resulting in increased anaplerotic entry of amino acids into the TCA cycle and consequently increasing cataplerotic efflux as de novo glutamine and urea synthesis. The regulatory mechanism of differential utilization of amino acids to and away from protein synthesis in relation to amino acid load and duration of amino acid infusion remains unknown.
Fig. 2.
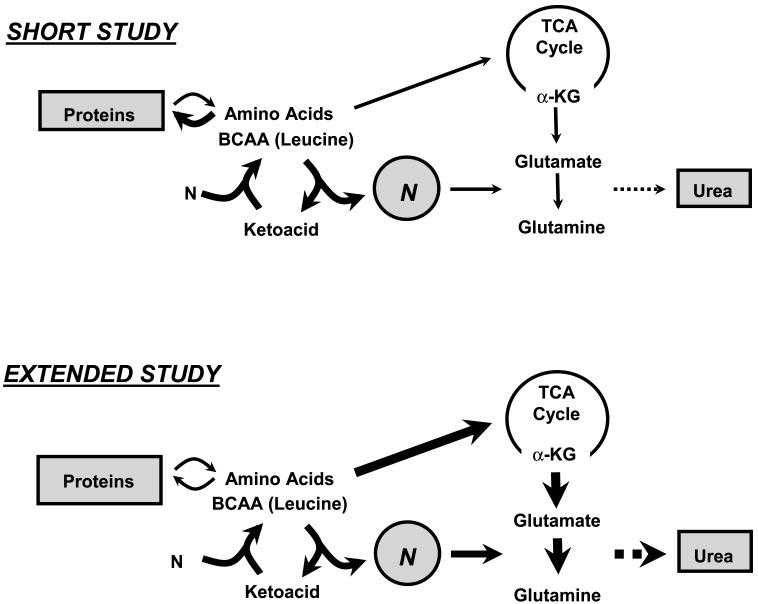
Proposed model for utilization of AA based upon length of intravenous AA infusion in preterm neonates. Large dark arrows schematically represent observed results from the present study. Increased AA delivered intravenously for a short time (5 h) caused suppression of proteolysis, resulting in less AA entering tricarboxylic acid (TCA) cycle and lower glutamine and urea flux. By contrast, after extended (24 h) infusion of AA, protein turnover was unchanged, resulting in increased anaplerotic entry of AA into the TCA cycle and increased cataplerotic efflux as de novo glutamine and urea synthesis. BCAA, branched-chain amino acids; α-KG, α-ketoglutarate; N, nitrogen.
Increase in amino acid load from 1.5 to 3 g caused a suppression in the whole body rate of proteolysis, glutamine, and urea synthesis. Such an effect was transient and disappeared when the amino acids were infused at a higher rate for a prolonged period. The suppression of proteolysis and the overall conservation of nitrogen (lower urea synthesis) are consistent with the data in several studies in postabsorptive adults showing a similar response to amino acid load (1, 2). However, only one study in adults has examined the response to prolonged amino acid infusion (5). Their data show that in response to an intravenous amino acid infusion of 162 mg·kg-1·h-1 (or 3.9 g·kg-1·day-1), there was an increase in skeletal muscle protein synthesis beginning after 30 min of infusion, reaching a peak after 2h (∼2.8 times the basal value) and then declining rapidly to the basal value, which suggests that muscle protein synthesis responds rapidly to increased availability of amino acids but is then inhibited despite continued availability of amino acids. These data suggest that the acute response to increased amino acid availability may be directed towards the repletion or maintenance of protein mass, and that after such repletion, the additional amino acids are directed towards oxidative metabolism, as was observed in our extended study. It is possible that further accretion of nitrogen after the acute needs are met with would require accretion of new tissue, a relatively slow process that is not measurable by the present technique. In addition, these data also suggest that strategies towards TPN administration for LBW infants should be reexamined, and perhaps a cyclic administration, low dose followed by a higher dose, may be more beneficial for overall protein accretion.
The effect of a lower dose of amino acid infusion (3.0 g to 1.5 g) had the anticipated effect of a lower rate of leucine N turnover and a lower rate of de novo glutamine synthesis (Table 8), which suggests that de novo glutamine synthesis is regulated by the anaplerotic carbon and nitrogen input into the TCA cycle. Lowering the amino acid dose did not have any significant impact on the whole body rate of protein breakdown (phenylalanine Ra; Table 7) or on the rate of oxidation of protein (urea Ra). Because the rate of proteolysis and protein oxidation did not increase in response to the lower dose of amino acids, these data suggest that the amino acids at 1.5 g·kg-1·day-1, although insufficient for nitrogen accretion, might be sufficient to meet the other metabolic requirements of these infants.
Although amino acids are a secretagogue for insulin, we did not observe any significant effect of amino acid load on plasma insulin levels. In addition, there was no correlation between plasma insulin levels and any of the measured parameters of nitrogen kinetics. Data in adults and infants have shown that acute infusion of amino acids suppresses proteolysis and that the addition of insulin did not have any synergistic effect on this response (1, 2). Because the plasma amino acid levels in the present study were higher than those observed in fasting full-term babies, whether the preexisting higher insulin levels contributed to the response to amino acids cannot be ascertained from the present data.
The present study may provide a metabolic and mechanistic rationale for understanding whether glutamine should be supplemented in parenteral nutrition. We (10) have recently demonstrated that glutamine supplementation for 3 days decreases whole body protein breakdown in clinically stable LBW preterm infants. Together with the results from the present study, we speculate that glutamine supplementation may abrogate the need to increase TCA cycle anaplerotic influx and cataplerotic efflux required for de novo glutamine synthesis, thereby “saving” the increased amino acids for protein synthesis. In this regard, glutamine supplementation might particularly benefit acutely ill preterm neonates.
In summary, we demonstrate that de novo glutamine synthesis increases when a greater intravenous amino acid infusion is given for an extended period of time to LBW infants in the immediate neonatal period. In addition, the rates of whole body proteolysis and urea synthesis are transiently suppressed with a greater amino acid load. These results are similar to another recent study we did (21) of more clinically stable LBW preterm infants. These data provide the basis for further studies on the mechanism of regulation of proteolysis by amino acids and whole body conservation of nitrogen in LBW infants.
These data do not permit estimates of the infants’ capacity to synthesize glutamine, except that they were able to synthesize glutamine, possibly from infused amino acid. In addition, the data show that the rate of glutamine synthesis was effected by the change in protein flux in response to amino acid infusion.
ACKNOWLEDGMENTS
We thank the nursing and laboratory staff of the General Clinical Research Center for help with these studies, especially Susan Hochever. We also thank Clarita Duenas, Carole Bennett, and Ed Burkett for technical assistance and Dr. Saeid Amini for statistical analysis. The secretarial assistance of Joyce Nolan is gratefully appreciated.
Footnotes
The costs of publication of this article were defrayed in part by the payment of page charges. The article must therefore be hereby marked “advertisement” in accordance with 18 U.S.C. Section 1734 solely to indicate this fact.
GRANTS
This work was supported by NIH Grant RO1-HD-042154 (to S. C. Kalhan) and General Clinical Research Center Grant RR-00080. M. M. Kadrofske is a recipient of an NIH Loan Repayment Program grant.
REFERENCES
- 1.Bennet WM, Connacher AA, Scrimgeour CM, Rennie MJ. The effect of amino acid infusion on leg protein turnover assessed by L-[15N]phenylalanine and L-[1-13C]leucine exchange. Eur J Clin Invest. 1990;20:41–50. doi: 10.1111/j.1365-2362.1990.tb01789.x. [DOI] [PubMed] [Google Scholar]
- 2.Bennet WM, Connacher AA, Scrimgeour CM, Smith K, Rennie MJ. Increase in anterior tibialis muscle protein synthesis in healthy man during mixed amino acid infusion: studies of incorporation of [1-13C]leucine. Clin Sci (Lond) 1989;76:447–454. doi: 10.1042/cs0760447. [DOI] [PubMed] [Google Scholar]
- 3.Biolo G, Fleming RY, Maggi SP, Nguyen TT, Herndon DN, Wolfe RR. Inhibition of muscle glutamine formation in hypercatabolic patients. Clin Sci (Lond) 2000;99:189–194. [PubMed] [Google Scholar]
- 4.Blomqvist BI, Hammarqvist F, von der Decken A, Wernerman J. Glutamine and α-ketoglutarate prevent the decrease in muscle free glutamine concentration and influence protein synthesis after total hip replacement. Metabolism. 1995;44:1215–1222. doi: 10.1016/0026-0495(95)90019-5. [DOI] [PubMed] [Google Scholar]
- 5.Bohé J, Aili Low JF, Wolfe RR, Rennie MJ. Latency and duration of stimulation of human muscle protein synthesis during continuous infusion of amino acids. J Physiol. 2001;532:575–579. doi: 10.1111/j.1469-7793.2001.0575f.x. [DOI] [PMC free article] [PubMed] [Google Scholar]
- 6.Brosnan JT. Interorgan amino acid transport and its regulation. J Nutr. 2003;133:2068S–2072S. doi: 10.1093/jn/133.6.2068S. [DOI] [PubMed] [Google Scholar]
- 7.Denne SC, Karn CA, Ahlrichs JA, Dorotheo AR, Wang J, Liechty EA. Proteolysis and phenylalanine hydroxylation in response to parenteral nutrition in extremely premature and normal newborns. J Clin Invest. 1996;97:746–754. doi: 10.1172/JCI118473. [DOI] [PMC free article] [PubMed] [Google Scholar]
- 8.Hammarqvist F, Wernerman J, Ali R, von der Decken A, Vinnars E. Addition of glutamine to total parenteral nutrition after elective abdominal surgery spares free glutamine in muscle, counteracts the fall in muscle protein synthesis, and improves nitrogen balance. Ann Surg. 1989;208:455–461. doi: 10.1097/00000658-198904000-00011. [DOI] [PMC free article] [PubMed] [Google Scholar]
- 9.Kalhan SC, Iben S. Protein metabolism in the extremely low-birth weight infant. Clin Perinatol. 2000;27:23–56. doi: 10.1016/s0095-5108(05)70005-1. [DOI] [PubMed] [Google Scholar]
- 10.Kalhan SC, Parimi PS, Gruca LL, Hanson RW. Glutamine supplement with parenteral nutrition decreases whole body proteolysis in low birth weight infants. J Pediatr. 2005;146:642–647. doi: 10.1016/j.jpeds.2005.01.022. [DOI] [PubMed] [Google Scholar]
- 11.Kalhan SC, Rossi KQ, Gruca L, Super DM, Savin RM. Relation between transamination of branched chain amino acids and urea synthesis: evidence from human pregnancy. Am J Physiol Endocrinol Metab. 1998;275:E423–E431. doi: 10.1152/ajpendo.1998.275.3.E423. [DOI] [PubMed] [Google Scholar]
- 12.Kuhn KS, Schuhmann K, Stehle P, Darmaun D, Fürst P. Determination of glutamine in muscle protein facilitates accurate assessment of proteolysis and de novo synthesis-derived endogenous glutamine production. Am J Clin Nutr. 1999;70:484–489. doi: 10.1093/ajcn/70.4.484. [DOI] [PubMed] [Google Scholar]
- 13.Lacey JM, Wilmore DW. Is glutamine a conditionally essential amino acid? Nutr Rev. 1990;48:2979–309. doi: 10.1111/j.1753-4887.1990.tb02967.x. [DOI] [PubMed] [Google Scholar]
- 14.Lacey JM, Crouch JB, Benfell K, Ringer SA, Wilmore CK, Maguire D, Wilmore DW. The effects of glutamine-supplemented parenteral nutrition in premature infants. J Parent Ent Nutr. 1996;20:74–80. doi: 10.1177/014860719602000174. [DOI] [PubMed] [Google Scholar]
- 15.Mittendorfer B, Gore DC, Herndon DN, Wolfe RR. Accelerated glutamine synthesis in critically ill patients cannot maintain normal intramuscular free glutamine concentrations. J Parent Ent Nutr. 1999;23:243–252. doi: 10.1177/0148607199023005243. [DOI] [PubMed] [Google Scholar]
- 16.Neu J, Roig J, Meetze WH, Veerman M, Carter C, Millsaps M, Bowling D, Dallas MJ, Sleasman J, Knight T, Auestad N. Enteral glutamine supplementation for very low birth weight infants decreases morbidity. J Pediatr. 1997;131:691–699. doi: 10.1016/s0022-3476(97)70095-7. [DOI] [PubMed] [Google Scholar]
- 17.Newsholme P. Why is L-glutamine metabolism important to cells of the immune system in health, postinjury, surgery or infection? J Nutr. 2001;131:2515S–2522S. doi: 10.1093/jn/131.9.2515S. [DOI] [PubMed] [Google Scholar]
- 18.Owen OE, Kalhan SC, Hanson RW. The key role of anaplerosis and cataplerosis for citric acid cycle function. J Biol Chem. 2002;277:30409–30412. doi: 10.1074/jbc.R200006200. [DOI] [PubMed] [Google Scholar]
- 19.Parimi PS, Devapatla S, Gruca L, O’Brien AM, Hanson RW, Kalhan S. Glutamine and leucine nitrogen kinetics and their relation to urea nitrogen in newborn infants. Am J Physiol Endocrinol Metab. 2002;282:E618–E625. doi: 10.1152/ajpendo.00403.2001. [DOI] [PubMed] [Google Scholar]
- 20.Parimi PS, Devapatla S, Gruca L, Amini SB, Hanson RW, Kalhan S. Effect of enteral glutamine or glycine on whole-body nitrogen kinetics in very low birth weight infants. Am J Clin Nutr. 2004;79:402–409. doi: 10.1093/ajcn/79.3.402. [DOI] [PubMed] [Google Scholar]
- 21.Parimi PS, Kadrofske MM, Gruca LL, Hanson RW, Kalhan SC. Amino acids, glutamine and protein metabolism in very low birth weight infants. Pediatr Res. 2005;58:1259–1264. doi: 10.1203/01.pdr.0000185130.90205.1f. [DOI] [PubMed] [Google Scholar]
- 22.Poindexter BB, Ehrenkranz RA, Stoll BJ, Wright LL, Poole WK, Oh W, Bauer CR, Papile LA, Tyson JE, Carlo WA, Laptook AR, Narendran V, Stevenson DK, Farnaroff AA, Korones SB, Shankaran S, Finer NN, Lemons JA, National Institute of Child Health and Human Development Neonatal Research Network Parenteral glutamine supplementation does not reduce the risk of mortality or late-onset sepsis in extremely low birth weight infants. Pediatrics. 2004;113:1209–1215. doi: 10.1542/peds.113.5.1209. [DOI] [PubMed] [Google Scholar]
- 23.Poindexter BB, Karn CA, Ahlrichs JA, Wang J, Leitch CA, Liechty EA, Denne SC. Amino acids suppress proteolysis independent of insulin throughout the neonatal period. Am J Physiol Endocrinol Metab. 1997;272:E592–E599. doi: 10.1152/ajpendo.1997.272.4.E592. [DOI] [PubMed] [Google Scholar]
- 24.Poindexter BB, Karn CA, Leitch CA, Liechty EA, Denne SC. Amino acids do not suppress proteolysis in premature neonates. Am J Physiol Endocrinol Metab. 2001;281:E472–E478. doi: 10.1152/ajpendo.2001.281.3.E472. [DOI] [PubMed] [Google Scholar]
- 25.Reeds PJ, Burrin DG. Glutamine and the bowel. J Nutr. 2001;131:2505S–2508S. doi: 10.1093/jn/131.9.2505S. [DOI] [PubMed] [Google Scholar]
- 26.Reeds PJ, Fjeld CR, Jahoor F. Do the differences between the amino acid compositions of acute-phase and muscle proteins have a bearing on nitrogen loss in traumatic states? J Nutr. 1994;124:906–910. doi: 10.1093/jn/124.6.906. [DOI] [PubMed] [Google Scholar]
- 27.Thompson SW, McClure BG, Tubman TR. A randomized, controlled trial of parenteral glutamine in ill, very low birth-weight neonates. J Parent Ent Nutr. 2003;37:550–553. doi: 10.1097/00005176-200311000-00008. [DOI] [PubMed] [Google Scholar]
- 28.van Eijk HM, Rooyakkers DR, Deutz NE. Rapid routine determination of amino acids in plasma by high-performance liquid chromatography with a 2-3 μm Spherisorb ODS II column. J Chromatogr. 1993;620:143–148. doi: 10.1016/0378-4347(93)80062-9. [DOI] [PubMed] [Google Scholar]
- 29.Vaughn P, Thomas P, Clark R, Neu J. Enteral glutamine supplementation and morbidity in low birth weight infants. J Pediatr. 2003;142:662–668. doi: 10.1067/mpd.2003.208. [DOI] [PubMed] [Google Scholar]
- 30.Watford M. Glutamine and glutamate metabolism across the liver sinusoid. J Nutr. 2000;130:983S–987S. doi: 10.1093/jn/130.4.983S. [DOI] [PubMed] [Google Scholar]
- 31.Young VR, Ajami AM. Glutamine: the emperor or his clothes? J Nutr. 2001;131:2449S–2459S. doi: 10.1093/jn/131.9.2449S. [DOI] [PubMed] [Google Scholar]