Abstract
The receptor tyrosine kinase/PI3K/Akt/mammalian target of rapamycin (RTK/PI3K/Akt/mTOR) pathway is frequently altered in tumors. Inactivating mutations of either the TSC1 or the TSC2 tumor-suppressor genes cause tuberous sclerosis complex (TSC), a benign tumor syndrome in which there is both hyperactivation of mTOR and inhibition of RTK/PI3K/Akt signaling, partially due to reduced PDGFR expression. We report here that activation of PI3K or Akt, or deletion of phosphatase and tensin homolog (PTEN) in mouse embryonic fibroblasts (MEFs) also suppresses PDGFR expression. This was a direct effect of mTOR activation, since rapamycin restored PDGFR expression and PDGF-sensitive Akt activation in Tsc1–/– and Tsc2–/– cells. Akt activation in response to EGF in Tsc2–/– cells was also reduced. Furthermore, Akt activation in response to each of EGF, IGF, and PMA was reduced in cells lacking both PDGFRα and PDGFRβ, implying a role for PDGFR in transmission of growth signals downstream of these stimuli. Consistent with the reduction in PI3K/Akt signaling, in a nude mouse model both Tsc1–/– and Tsc2–/– cells had reduced tumorigenic potential in comparison to control cells, which was enhanced by expression of either active Akt or PDGFRβ. In conclusion, PDGFR is a major target of negative feedback regulation in cells with activated mTOR, which limits the growth potential of TSC tumors.
Introduction
Protein kinases are major regulators of most cellular signaling pathways. Among them, receptor tyrosine kinases (RTKs), such as PDGFR, play pivotal roles in promoting cellular growth and proliferation by transducing extracellular stimuli to intracellular signaling circuits (1). A prominent component of the intracellular signaling machinery is the PI3K/Akt(PKB)/mammalian target of rapamycin (PI3K/Akt[PKB]/mTOR) pathway (2, 3). Aberrant activation of this pathway by mutation of any of multiple genes is known to occur in the majority of human cancers through various mechanisms (4–6). RTK can be activated by either overexpression or mutation (1, 7–9). Activating mutations in PI3K p100 catalytic subunit α (PIK3CA) occur in more than 30% of solid tumors, leading to unregulated PI3K activity (5, 10). PI3K is an important driver of cell proliferation and cell survival that is normally activated by direct or indirect (via adapter proteins such as insulin receptor substrate [IRS]) binding of its p85 regulatory subunit to a phosphorylated RTK or by interaction of its p110 catalytic subunit with Ras-GTP. Activating Ras mutations occur in nearly one-third of epithelial tumors (11). Therefore, Akt is frequently activated in cancer cells via activated PI3K. Akt itself is also deregulated through amplification and overexpression in a smaller subset of tumors (12).
The PI3K/Akt/mTOR pathway is also subject to negative regulation by several tumor suppressor genes, each of which can be inactivated (13–18). Akt is flanked by 2 tumor suppressors: phosphatase and tensin homolog (PTEN), acting as a brake upstream of Akt, and the tuberous sclerosis complex 1/2 (TSC1/TSC2) heterodimer, acting as a brake downstream of Akt and upstream of mTOR. PTEN is commonly inactivated by mutation in human cancers, and functions as a critical negative regulator of Akt through its phosphatase activity on PtdIns(3,4,5)P(3), which is required to bring Akt to the membrane for phosphorylation by PDK1 (13). Phosphorylated, activated Akt phosphorylates TSC2 which disrupts the association of the TSC1/TSC2 protein complex with the membrane, which is required for its function as a GTPase-activating protein (GAP) for Ras homolog enriched in brain (Rheb)-GTP (19, 20). Loss of TSC1/TSC2 leads to high levels of Rheb-GTP and activation of mTOR. mTOR integrates PI3K-mediated growth factor signaling, cellular energy status signals, and amino acid availability to regulate ribosome biogenesis, protein synthesis, and cell growth (3).
While PTEN loss leads to Akt activation, deletion of TSC1/TSC2 leads to reduced Akt activation (14, 15, 21). The cause of this effect is likely multifactorial, with contributions from both reduced PDGFR expression (15) and reduction of IRS expression (22, 23). PDGF is the principal mitogen found in mammalian serum (24) and promotes cell migration, proliferation, and survival by binding to its cognate receptors, PDGFRα and PDGFRβ. Ligand binding to 1 subunit induces receptor homodimerization or heterodimerization and autophosphorylation (25). Although PDGFRα and PDGFRβ have similar biochemical functions in vitro, deletion of either gene is embryonic lethal (25). PDGF-related signaling has been implicated in the pathogenesis of tumors, atherosclerosis, balloon injury–induced restenosis, and pulmonary fibrosis and also plays an important role in angiogenesis (25).
Exploration of the mechanism and consequences of different genetic alterations in the PI3K/Akt/mTOR pathway has considerable importance. For example, patients with congenital PTEN haploinsufficiency are predisposed to development of a wide variety of benign growths (hamartomas), as well as being at increased risk for malignancy in multiple organs, through loss of their WT PTEN allele. In addition, PTEN loss plays a prominent role in the development of malignancies in the general population. In contrast, TSC patients (with loss of 1 allele of either TSC1 or TSC2) develop a variety of hamartomas through a 2-hit mechanism but rarely develop TSC-related malignancy (<3% of all patients) (18). In addition, mutation in the TSC genes is rare in the conventional adult malignancies, as far as is known. It is possible that the reduction in Akt activity in cells lacking TSC1/TSC2 contributes to the generally benign nature of tumors that develop in TSC patients.
Here we report studies on the mechanism and the functional and in vivo significance of the reduction in PDGFR expression that occurs in cells lacking TSC1/TSC2. First, we demonstrate that each of several different manipulations that lead to activation of Akt/mTOR also cause significant downregulation of PDGFR expression. Second, we demonstrate that rapamycin treatment restores PDGFR expression and signaling to Akt in response to PDGF or EGF in Tsc2–/– cell lines. Third, we show the importance of PDGFR expression in Akt activation in response to multiple other growth factors. Finally, we demonstrate that the impaired tumor formation by Tsc1–/– and Tsc2–/– cell lines can be reversed with ectopic expression of PDGFR or active Akt.
Results
Activation of PI3K/Akt/mTOR reduces PDGFR expression.
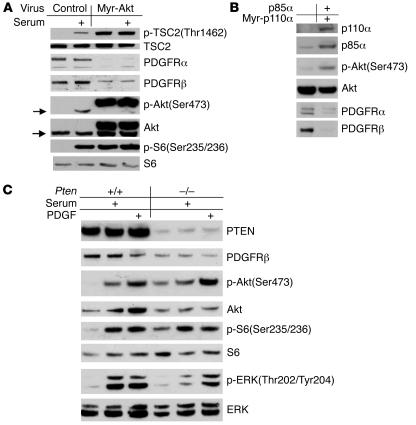
We previously observed that Tsc1-null or Tsc2-null mouse embryonic fibroblast (MEF) lines are relatively insensitive to stimulation of Akt by either PDGF or serum, in comparison to control lines, and that this was due to reduced expression of both PDGFRα and PDGFRβ (14, 15). Multiple other growth- and survival-promoting oncogenic stimuli are known to lead to Akt activation and downstream activation of mTOR. We hypothesized that reduction in expression of the PDGFRs would also occur in these other situations. We found that activation of Akt by any of 3 different manipulations led to reduced expression of the PDGFRs (Figure 1). Expression of a myristoylated, activated form of Akt led to high levels of pS6 (a marker of mTOR activation) and marked reduction in expression of both PDGFRα and PDGFRβ as well as endogenous Akt phosphorylation (Figure 1A). Introduction of myristoylated, membrane-bound (dominant-active) PIK3CA and PI3K subunit p85α into MEFs also led to activation of Akt and marked reduction in expression of both PDGFRs (Figure 1B). Finally, PTEN loss in MEFs also potentiated Akt activation, with mTOR activation, and also led to reduction in expression of PDGFRβ (Figure 1C).
Figure 1. Activation of the PI3K/Akt/mTOR pathway reduces PDGFR expression.
Immunoblot analysis is shown for multiple MEF lines. (A and C) MEFs were starved for 2 days and stimulated with either 10% FBS or 50 ng/ml PDGFbb for 10 minutes. (A) MEFs with ectopic myr-Akt have elevated p-TSC2, p-Akt, and p-S6 levels and markedly reduced PDGFRα and PDGFRβ levels in comparison to control cells. Arrows indicate endogenous Akt. (B) WT immortalized MEFs transiently expressing the p85α and myristoylated p110α subunits of PI3K show a marked reduction in levels of expression of both PDGFRα and PDGFRβ. (C) PTEN-null MEFs show increases in expression of p-Akt and p-S6, with a decrease in PDGFRβ expression.
Inhibition of mTOR restores PDGFR expression and Akt activation.
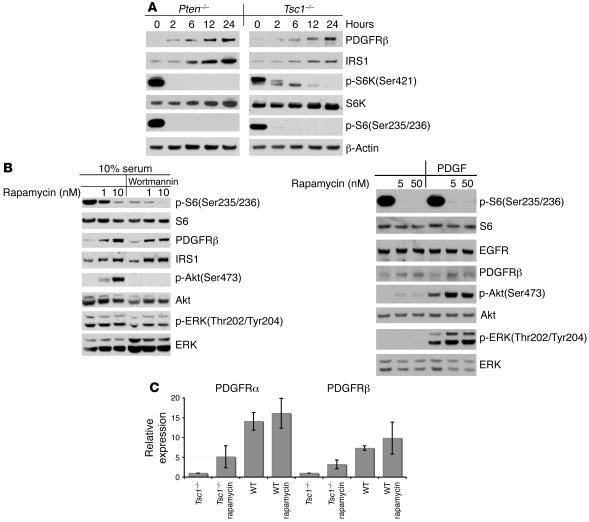
The observations presented above suggested that the degree of reduction in PDGFR expression was roughly proportional to the extent of mTOR activation, as myristoylated Akt (myr-Akt) had the greatest effects by both these measures (Figure 1). To investigate whether PDGFR reduction was directly due to mTOR activation, Tsc1–/–, Tsc2–/–, and Pten–/– MEFs were serum starved and treated with rapamycin for up to 24 hours. PDGFRβ levels increased in response to rapamycin treatment, as did levels of IRS1, in a time-dependent manner (Figure 2A). Furthermore, both serum and PDGF stimulation led to increased levels of p-Akt in rapamycin-treated Tsc2–/– cells, in comparison to untreated controls (Figure 2B).
Figure 2. mTOR suppresses PDGFR expression.
(A and B) Immunoblot analysis is shown for Pten–/–, Tsc1–/–(A), and Tsc2–/– (B) MEFs. (A) Cells were treated with 10 nM rapamycin for variable time periods, up to 24 hours. (B) Cells were starved in DMEM with rapamycin for 24 hours; treated with or without 0.1 μM wortmannin for 30 minutes; then stimulated with 10% FCS (left) or 50 ng/ml PDGFbb (right) for 10 minutes. Note that rapamycin immediately decreased p-S6 levels and led to a delayed increase in IRS1 and PDGFRβ levels. (C) Real-time quantitative RT-PCR analysis of PDGFRα and PDGFRβ mRNA levels is shown for untreated and 24-hour rapamycin–treated (10 nM) Tsc1–/–and WT MEFs. Error bars indicate SD for n = 2 experiments. Note the marked decrease in PDGFR mRNA levels in Tsc1–/– cells, which were increased by rapamycin treatment.
To examine the mechanism of both reduced PDGFR expression and increase in response to rapamycin treatment, we used real-time quantitative RT-PCR analysis of PDGFR levels. A substantial (7.3- to 14.1-fold) decrease in levels of PDGFRα and PDGFRβ mRNA was seen in Tsc1–/– cells in comparison to controls (Figure 2C). The effects of rapamycin on PDGFRα and PDGFRβ mRNA expression were similar to its effects on protein expression: treatment led to a marked, 3.2- to 5.1–fold increase in PDGFRα and PDGFRβ mRNA levels in the Tsc1–/– cells, with a much smaller increase in WT control MEFs. As we have previously shown that the half-life of PDGFR is not affected in Tsc2–/– MEFs (15), these data in aggregate suggest that PDGFR is negatively regulated by mTOR at the transcriptional level.
EGF/Akt signaling is also suppressed by mTOR activation.
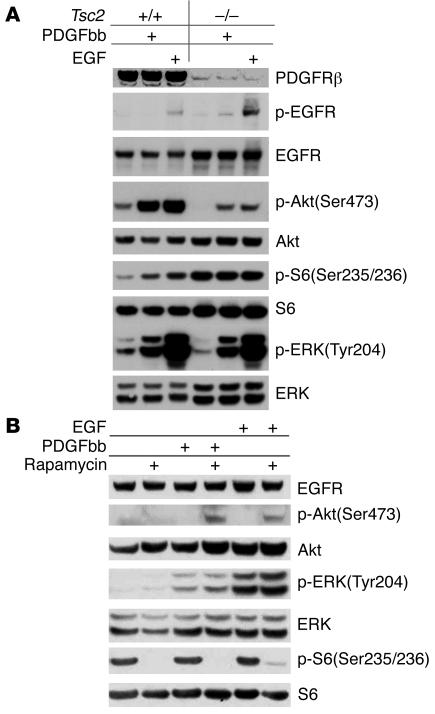
To explore the possibility that EGF signaling to Akt might also be affected in Tsc2-null cells, we examined p-Akt and p-ERK levels in cells after treatment with EGF. Although p-ERK levels were equivalent in Tsc2-null and control cells after EGF stimulation, p-Akt(Ser473) levels were markedly reduced in the Tsc2-null cells after EGF treatment (Figure 3A). In addition, as in response to PDGF treatment, pretreatment of Tsc2-null cells with rapamycin had no effect on p-ERK levels but increased p-Akt levels in response to EGF stimulation (Figure 3B). These observations indicate that EGF signaling to Akt is substantially suppressed by mTOR activation in Tsc2-null cells.
Figure 3. mTOR activation inhibits signaling of both PDGF and EGF to Akt.
MEFs were serum starved for 24 hours and then stimulated with 25 ng/ml PDGFbb or 50 ng/ml EGF for 10 minutes. Cell lysates were then subjected to Western blot analysis. (A) Note similar patterns of p-ERK increase in response to PDGF and EGF in both WT and Tsc2–/– cells. In contrast, p-Akt levels were reduced in response to both EGF and PDGF in the Tsc2–/– cell line. (B) Note enhancement of p-Akt levels in Tsc2–/– cells in response to rapamycin (100 nM for 24 hours) and PDGF or EGF treatment.
PDGFR is essential for Akt activation mediated by EGF, IGF, and PMA.
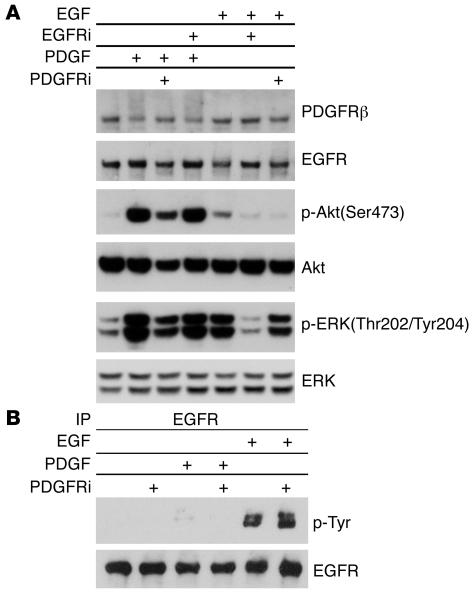
To examine the potential role of PDGFR in EGF-mediated Akt activation, we used AG1478, an EGFR inhibitor, and AG1295, a PDGFR inhibitor, to treat WT MEFs. AG1295 reduced Akt phosphorylation to a major extent in response to both PDGF and EGF stimulation (Figure 4A), while it had no influence on EGFR phosphorylation (Figure 4B). In contrast, AG1478 had no effect on Akt phosphorylation in response to PDGF but blocked EGF-induced Akt phosphorylation comparably to AG1295 (Figure 4A). These results suggest that PDGFR is critical for EGF signaling to Akt.
Figure 4. Inhibition of PDGFR impairs EGF-mediated Akt activation.
WT MEFs were serum starved for 24 hours; with or without pretreatment with 2.5 μM AG1295 (PDGFR inhibitor [PDGFRi]) or 0.1 μM AG1478 (EGFR inhibitor [EGFRi]) for 30 minutes; and then stimulated with 50 ng/ml PDGFbb or EGF for 10 minutes. Cell lysates were then subjected to immunoblot analysis (A) or immunoprecipitation for EGFR, followed by immunoblotting (B). Note equivalent suppression of p-Akt levels by both AG1478 and AG1295 pretreatment in EGF-stimulated cells (A). AG1295 does not prevent tyrosine phosphorylation of EGFR by EGF (B).
Numerous alterations have been reported in Tsc1- or Tsc2-null cells, many of which could influence Akt activation in response to external stimuli. Because of the functional redundancy of the α and β isoforms, PDGF stimulates a very similar set of cellular responses and signaling events in cells expressing only PDGFRα or PDGFRβ in cultured cells (25). Therefore, to examine directly the relationship between PDGFR expression and signaling to Akt, we utilized MEFs in which deletion of both Pdgfra and Pdgfrb had been achieved by genetic engineering in the mouse (26).
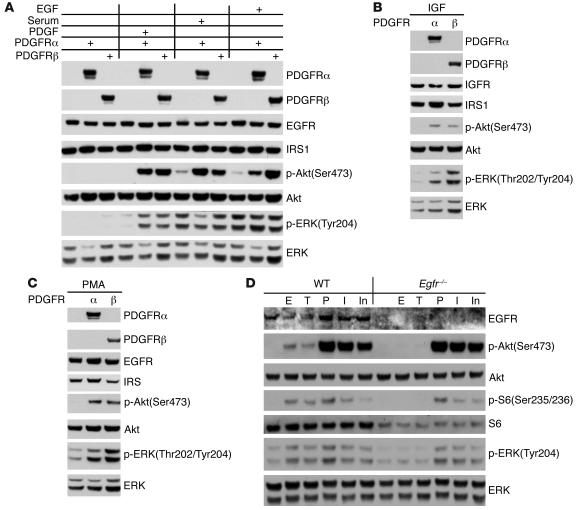
PDGFRα/β double-null MEFs demonstrated markedly reduced activation of Akt in response to stimulation with any of PDGFbb, serum, or EGF (Figure 5A). Reconstitution of these MEFs with either PDGFRα or PDGFRβ greatly enhanced Akt activation in response to any of these 3 stimuli. Furthermore, Akt activation in response to both IGF and PMA was also significantly impaired in the PDGFRα/β double-null MEFs, in comparison to MEFs reconstituted with either receptor isoform (Figure 5, B and C). In contrast, MEFs engineered to have no expression of EGFR (27) showed normal phosphorylation of Akt in response to treatment with any of PDGF, IGF1, and insulin (Figure 5D).
Figure 5. Akt activation by EGF, IGF, and PMA is reduced in cells lacking PDGFR.
(A–C) Immunoblots of cell lysates. Each set of 3 lanes in A consists of lysates from PDGFRα/β double-null, Pdgfra–/–, and Pdgfrb–/– MEFs. All cells were serum starved for 48 hours and then stimulated with 50 ng/ml PDGFbb, 50 ng/ml EGF, 50 ng/ml IGF, or 10% serum for 10 minutes; or 200 nM PMA for 30 minutes. p-Akt levels were markedly reduced in PDGFRα/β double-null cells in response to all stimuli. (D) Immunoblots of WT or Egfr–/– MEFs. Cells were serum starved for 24 hours and stimulated with 50 ng/ml EGF (E), 50 ng/ml TGF-α (T), 50 ng/ml PDGF (P), 50 ng/ml IGF (I), or 0.2 nM insulin (In) for 10 minutes. Note that phosphorylation of Akt, S6, and ERK in response to PDGF, IGF, and insulin was similar in Egfr–/– and control MEFs.
Tsc1- or Tsc2-null cells have reduced tumorigenic potential due to reduced PDGFR/Akt signaling.
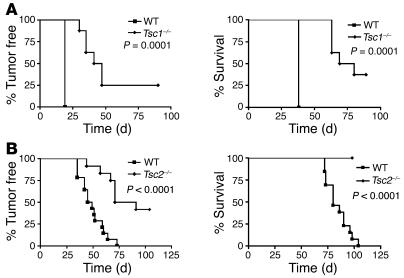
To assess the in vivo consequences of diminished signaling to Akt in cells lacking Tsc1/Tsc2, we examined the tumorigenic capacity of paired sets of MEF lines. In contrast to expectations for cell lines that had lost a tumor suppressor gene, both Tsc1-null and Tsc2-null MEF lines demonstrated reduced tumorigenic capacity in a nude mouse model, as assessed by tumor development and survival after injection of 106 cells, in comparison to control MEF lines (Figure 6, A and B).
Figure 6. Tsc1-null and Tsc2-null MEFs have reduced tumorigenic potential.
Tumor development and survival curves are shown for immunodeficient nude mice after subcutaneous inoculation with 1 × 10⁶ MEFs. Mice receiving Tsc1–/–cells (A) or Tsc2–/– cells (B) had delayed tumor formation and a longer survival than mice receiving control cells. All cells used in B were deficient in tumor suppressor gene TP53.
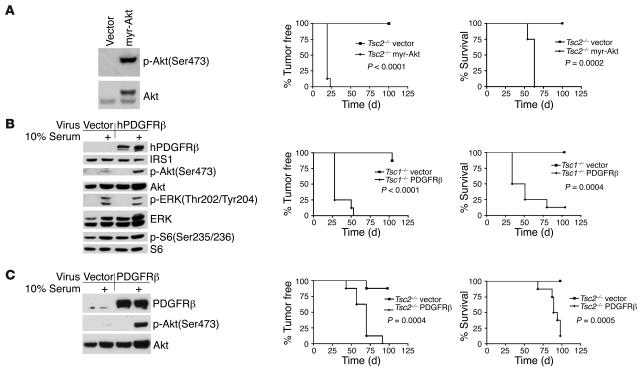
To directly assess the role of diminished Akt signaling in this effect, we transduced these cell lines with either myr-Akt or PDGFRβ. myr-Akt–expressing Tsc2–/–, PDGFRβ-expressing Tsc1–/–, and PDGFRβ-expressing Tsc2–/– cell lines demonstrated enhancement of Akt activation either at baseline (myr-Akt) or in response to serum stimulation (PDGFR-expressing) (Figure 7, A–C). Moreover, these modified cell lines demonstrated accelerated tumor growth in vivo in nude mice, in comparison to MEF lines transduced with vector alone, as assessed by tumor formation and survival (Figure 7, A–C). Not surprisingly, the myr-Akt–transduced cell line displayed the most aggressive in vivo growth, consistent with the strongly activating effect of that oncogene-like construct.
Figure 7. Restoration of PDGFR/Akt signaling potentiates the tumorigenicity of Tsc1-null and Tsc2-null cells.
(A) myr-Akt expression restores p-Akt levels in Tsc2–/– MEFs (left); markedly accelerates tumor formation (middle); and reduces survival (right) of immunodeficient nude mice injected with these cells in comparison to controls treated with vector alone. (B and C) PDGFRβ expression increases serum-induced p-Akt levels in Tsc1–/– (B) and Tsc2–/– (C) MEFs (left); accelerates tumor formation (middle); and reduces survival (right) of immunodeficient nude mice injected with these cells in comparison to controls treated with vector alone.
Discussion
The PDGFR is a member of the family of transmembrane receptors with kinase activity (1). Tumor growth can be promoted through PDGFR by autocrine PDGF stimulation, by overexpression or hyperactivation of PDGFR, or by PDGF stimulation of angiogenesis within the tumor (9). Constitutive activation of PDGFRα or PDGFRβ is seen in myeloid malignancies as a consequence of fusion of the PDGFR genes to diverse partner genes, and activating mutations of PDGFRα are seen in gastrointestinal stromal tumors (9). Overexpression of PDGFRs and/or their ligands has been described in many other solid tumors, including medulloblastomas and malignant gliomas (28, 29). In addition, the propensity of human prostate cancer to metastasize to bone appears to correlate with Akt activation via PDGFRα (30). Therefore, PDGFRs are widely recognized as potential targets for anticancer therapeutics. However, we have previously found that expression of both PDGFRα and PDGFRβ is reduced and PI3K/Akt signaling is impaired, while mTOR is hyperactivated, in both Tsc1–/– and Tsc2–/– MEFs and in kidney tumors from either Tsc1+/– or Tsc2+/– mice (14, 15).
Here we demonstrate that activation of Akt by any of several mechanisms (loss of PTEN, activation of PI3K or Akt) also inhibits the expression of PDGF receptors (Figure 1). Restoration of PDGFR mRNA and protein levels by rapamycin treatment of Tsc1–/–, Tsc2–/–, or Pten–/– cells indicates that this effect is mediated by mTOR at the transcriptional level (Figure 2). As the Ras, PI3K/PTEN, and p53 pathways all converge either directly or indirectly on TSC2, the TSC1/TSC2 node is a crucial regulator of mTOR (3, 4, 18). Since the PI3K/Akt/mTOR signaling pathway is the pathway that is most often deranged in cancer (3, 6), mTOR-mediated negative feedback regulation of upstream signaling has a potential important role in the regulation of cell growth/proliferation and prevention of tumorigenesis. However, genetic alterations such as PTEN loss or PI3KCA mutation/activation are refractory to this negative feedback mechanism, likely explaining their importance in malignant proliferation.
It remains uncertain precisely how activated mTOR suppresses PDGFR expression. Our data suggests that suppression likely occurs due to reduced PDGFR transcription and/or reduced mRNA half-life (Figure 2C) and that the stability of PDGFR proteins is not altered in Tsc2–/– cells (15). The PDGFRβ promoter is controlled by NF-Y and receives input from myc, Sp1, and p73 (31–33), suggesting potential roles for these proteins as intermediates in transcriptional repression consequent to mTOR activation. As S6K is highly activated downstream of mTOR and directly contributes to reduced IRS expression in cell lacking Tsc1 or Tsc2 (22, 23), it is possible that S6K may directly target some of these regulators of PDGFR expression, leading to reduced transcription.
mTOR exists in 2 complexes: the rapamycin-sensitive mTOR complex (mTORC1) containing raptor-GβL and the rapamycin-insensitive mTOR complex (mTORC2) containing rictor-GβL (34, 35). The mTORC1 complex is the complex that is activated consequent to loss of TSC1/TSC2, and any protein element downstream of mTORC1 might mediate this effect on PDGFR transcription. As mTORC2 appears to be the principal kinase that phosphorylates Akt at Ser473 (36), another potential mechanism limiting Akt activation when mTORC1 is activated is a shift in the equilibrium between these 2 mTOR complexes, with increased amounts of mTORC1 and reduced amounts of mTORC2 (4). Thus, rapamycin might restore Akt function by shifting mTOR from mTORC1 to mTORC2 (4). However, prolonged rapamycin treatment (100 nM) has recently been shown to reduce mTORC2 levels in all cells and reduce activation of Akt in about one-third of cell lines examined (36).
We had previously observed that Akt activation in Tsc1- or Tsc2-null cells was reduced in response to PDGF and serum (14, 15). Here we demonstrate that EGF-mediated Akt activation is also dependent on PDGFR (Figures 4 and 5) and is suppressed by mTOR in Tsc2-null cells (Figure 3). We have also shown that Akt activation in response to serum, PDGF, EGF, IGF, and PMA is reduced in MEFs lacking both PDGFRα and PDGFRβ and is restored by expression of either of the PDGFR isoforms (Figure 5). Although reduced IRS expression has been shown to be critical for insulin and IGF signaling deficiencies in Tsc2-null cells (22, 23), restoration of PDGF and other growth factor signaling to Akt in these cells upon restoration of PDGFR levels (Figure 7, B and C; ref. 15), indicates the importance of PDGFR expression for these responses. In addition, these cell lines with restored PDGFR function had enhanced tumor growth in vivo, indicating the importance of this effect on tumor development.
Although a role for PDGF receptors in signaling downstream of growth factors other than PDGF may seem surprising, there has been some indirect evidence for this effect. For example, PDGFR has been implicated in transactivation of EGFR by signals other than EGF, through a possible mechanism of heterodimerization (37). It also seems possible that PDGFR may serve as a scaffold, adapter, or intermediary element that facilitates transmission of signaling from other RTKs to PI3K. EGFR is known to signal to PI3K in a relatively weak manner (e.g., Figure 5D; ref. 38), and our results suggest that in most cells the PDGFR facilitates this response.
Akt is found in mammalian cells as 3 highly conserved isoforms with overlapping but distinct functions (2). Akt1 primarily mediates signals downstream of PI3K activation that promote cell survival and proliferation. In contrast, Akt2 primarily mediates signaling events associated with insulin-mediated metabolic processes. Akt3 is critical for brain development in regulation of cell size and number. We speculate that the reduction of both IRS and PDGFR expression that occur in cells with activated mTOR or Akt are due to a counterregulatory circuit that seeks to reduce signaling downstream of all 3 Akt isoforms. In this model, IRS reduction is crucial to downregulate the insulin receptor family of RTKs, which occur as disulfide-linked dimers at baseline. PDGFR expression reduction occurs to reduce signaling through all other RTKs, which require receptor dimerization from monomers for activation (1, 7).
Individuals who are haploinsufficient for any of TSC1, TSC2, or PTEN all develop large numbers of hamartomas in multiple organ systems, though the specific sites vary between TSC1/TSC2 and PTEN. In contrast, malignant tumors are rare in TSC patients while relatively common in patients who are haploinsufficient for PTEN. Our observations suggest that the suppression of Akt activation occurring in TSC lesions (in contrast to PTEN-related hamartomas) may account for this difference in biologic behavior. Further evidence for the importance of reduced Akt signaling in limiting the growth of TSC-related tumors is the observation that mice doubly heterozygous for each of Pten and Tsc2 displayed a significant acceleration of liver hemangioma growth, in comparison to Tsc2+/– controls (39). Cytoplasmic localization of FOXO proteins in the doubly heterozygous mice in contrast to the Tsc2+/– controls implicated enhanced Akt signaling due to reduced PTEN activity in stimulating hemangioma development.
Although TSC patients rarely develop malignancy, a substantial fraction (approximately 25% overall) of patients have progressive though histologically benign tumor growth that requires intervention and, if left untreated, can lead to serious morbidity and mortality (18, 40). The molecular basis of this progressive growth in a minority of tumors is unknown, but our current observations suggest that disruption in this growth-restraining feedback circuitry may be important. Indeed, hyperphosphorylation of Akt and MAPK pathways has been observed in progressive TSC lesions of the brain and kidney (41, 42), though PTEN appeared to be normal in the brain lesions (42).
Pharmacological inhibition of mTOR with rapamycin in tumors in vivo could degrade this negative-feedback loop, thereby increasing the level of activation of Akt and leading to cell survival (43). The efficacy of mTOR inhibitor treatment might be substantially improved by concomitant inhibition of Akt, through direct inhibition of Akt itself, inhibition of upstream RTKs and adapter proteins, inhibition of PI3K, or inhibition of mTORC2 (43). However, in TSC-related tumors, where loss of regulation of mTOR activity is the primary abnormality, direct targeting of this activation with rapamycin would seem likely to be highly effective. The recently reported dramatic responses of refractory TSC subependymal astrocytomas to rapamycin in patients (44) and of renal tumors in TSC rodent models (45, 46) support this view.
In summary, we have demonstrated that hyperactivation of mTOR through either activation of PI3K/Akt or loss of TSC1/TSC2 leads to reduced PDGFR expression by a transcriptional mechanism. We establish an important role for PDGFR in EGF, IGF, and PMA signaling to Akt. Reduced PDGFR/Akt signaling compromises the tumorigenic capacity of Tsc1–/– and Tsc2–/– cells. Therefore, PDGFRs are essential for multiple growth factor signaling pathways that lead to PI3K/Akt activation and are a prominent target of counterregulatory signaling in the PI3K/PTEN/Akt/TSC1–TSC2/mTOR pathway. Inactivation of the TSC protein complex leads to benign tumor growth through concomitant activation of mTOR and its multiple downstream effectors and suppression of upstream RTK/PI3K/Akt signaling.
Methods
Antibodies and other reagents.
We used antibodies against the following: TSC2, Akt, EGFR, phosphotyrosine, and ERK (Santa Cruz Biotechnology Inc.); PDGFRα, PDGFRβ, PTEN, and IRS1 (Upstate USA Inc.); p-ERK, p-Akt, p-TSC2, p-S6K, and S6 (Cell Signaling Technology). CAKRRRLpSpSLRA peptides were injected into rabbit to produce anti–p-S6(Ser235/236) antibody. PDGFbb, EGF, and IGF were purchased from Sigma-Aldrich; rapamycin, wortmannin, PMA (phorbol-12-myristate-13-acetate) from Cell Signaling Technology; and AG1478 and AG1295 from Calbiochem (EMD Biosciences). Cellgro DMEM and FBS were purchased from Mediatech Inc.
Expression constructs for PDGFR, Akt, and PI3K.
A myr-Akt cDNA derivative was amplified by PCR from a mouse myr-Akt1-myc-his cDNA clone (Upstate USA Inc.), using primers (ATAGCGGCCGCGGATCCATGAACGAC, TTAAGATCTCAGGCTGTGCCACT) and Pfu proofreading polymerase (Stratagene). The PCR product encodes 11 N-terminal amino acids from the avian c-src protein (myristoylation signal) and a myc-his tag at the C terminus and was inserted into the retroviral vector pIRES-hygromycin (47, 48), using NotI and BglII sites.
A retrovirus expressing human PDGFRβ was made by PCR amplification of a PDGFRβ cDNA clone (Invitrogen) using primers that generated NotI and ClaI sites (ATATGCGGCCGCACCATGCGGCTTCCGGGTGCG, CAGATCGATTTACAGGAAGCTGTC) using Pfu polymerase, followed by insertion into pIRES-hygromycin. A human myr-PIK3CA expression vector was a gift from T.M. Roberts and J.J. Zhao (Dana-Farber Cancer Institute), and a mouse PI3K-p85α expression vector was a gift from L. Cantley and J. Luo (Beth Israel Deaconess Hospital, Boston, Massachusetts, USA).
Cell culture.
Immortalized Tsc1–/– and Tsc2–/– MEF lines have been described previously (14, 15); the Tsc2–/– and control lines used here are also null for p53. All paired lines were derived from littermate embryos. Pdgfra–/–, Pdgfrb–/–, and double-null Pdgfra–/–Pdgfrb–/– MEF lines were gifts from A. Kazlauskas (Schepens Eye Research Institute, Boston, Massachusetts, USA) (26). MEFs nullizygous for both of the PDGFRs were derived from E9.5 embryos. The cells were immortalized by infection with retroviral vector harboring the simian virus 40 large T antigen. Pdgfra–/– MEFs and Pdgfrb–/– MEFs were generated by infection of PDGFR double-null MEF lines with either human PDGFRα- or human PDGFRβ-expressing retroviruses. Pten–/– MEFs were a gift from R.A. DePinho (Dana-Farber Cancer Institute) (49). Egfr–/– MEFs were a gift from Z. Dong (University of Minnesota, Austin, Minnesota, USA) (27). All cells were cultured in DMEM with or without 10% FCS in 5% CO2 at 37°C.
myr-PIK3CA and p85α expression plasmids were cotransfected with Lipofectamine 2000 (Invitrogen) into a WT MEF line. Cells were harvested 2 days later for immunoblot analysis.
Retroviral packaging line PT67 and hygromycin B were purchased from Clontech (Cambrex). Retroviral plasmid constructs were transfected into PT67 cells using Lipofectamine 2000. Medium containing virus was filtered with a 45-μm filter and then used to infect immortalized MEF lines. Infected cells were selected with 100 μg/ml hygromycin B.
Real-time quantitative RT-PCR of PDGFR mRNA.
Total RNA was extracted from cell lines using the RNeasy Plus Mini Kit (QIAGEN) following the manufacturer’s protocol. RNA concentration was measured with a NanoDrop ND-1000 Spectrophotometer at absorbances of 260 and 280 nm (A260/280).
One microgram RNA was reverse transcribed using the iScript cDNA Synthesis Kit (Bio-Rad). After 10-fold dilution, 2 μl was used as template in a quantitative PCR reaction. Amplification was done for 35 cycles using iQ SYBR Green Supermix on an iCycler (Bio-Rad). Oligonucleotide primers were designed to detect PDGFRα and PDGFRβ, with GAPDH as internal control. Primer sequences were: mPDGFRα (CTCAATGCAAACCCCAACTT, CCAACTTCATGGTGTCATGC), mPDGFRβ (AGCCCTTGGTTTGCAGCACT, CGACTCACACCACCGTACAGTCG), and mGAPDH (GCCTTCCGTGTTCCTACCC, TGCCTGCTTCACCACCTTC). Each RNA sample was analyzed in triplicate and the results averaged, and PDGFR results were normalized to GAPDH levels for the same sample.
Immunoprecipitation and immunoblotting.
For immunoprecipitation, cells were lysed in IP lysis buffer (1% NP40, 10% glycerol, 150 mM NaCl, 10 mM Tris, pH 7, proteinase inhibitor cocktail) and subsequent steps carried out as described previously (15). For immunoblotting, cells were lysed in lysis buffer (2% SDS, 10% glycerol, 10 mM Tris, pH 6.8, 100 mM DTT), boiled for 10 minutes, and then subject to immunoblotting as described previously (14).
Induction of subcutaneous tumors in nude mice.
Subcutaneous tumors were established as described previously (46). Immunodeficient nude mice (strain CD-1nuBR, 8–9 weeks old) were obtained from Charles River Laboratories. Six to 8 mice (equal numbers of males and females) were used in each cohort. Tumor growth and mouse survival were assessed over 3- to 4-month periods following subcutaneous inoculation of 1 × 10⁶ cells in 0.2 ml DMEM into the right posterior back region. After inoculation, mice were examined at least twice weekly for tumor development by palpation and were euthanized when tumor size was greater than 1,000 cm3, there was ulceration over the tumor, or weight loss of more than 10% occurred. All animal protocols were approved by the Center for Animal Resources and Comparative Medicine, Boston, Massachusetts, USA and were compliant with federal, local, and institutional guidelines on the care of experimental animals.
Statistics.
GraphPad Prism (version 4.0) software was used for all statistical analyses. The Kaplan-Meier log-rank test was used for analysis of tumor development and survival data. A P value less than 0.05 was considered significant. Survival was usually determined by necessity for euthanasia due to tumor growth, ulceration, or weight loss.
Acknowledgments
We thank Andrius Kazlauskas for Pdgfra–/–, Pdgfrb–/–, and Pdgfra–/–Pdgfrb–/– double-null MEF lines; Ronald DePinho for Pten–/– MEFs; Zigang Dong for Egfr–/– MEFs; Lewis Cantley and Ji Luo for the PI3K p85 expression vector; Thomas M. Roberts and Jane J. Zhao for the PI3K PIK3CA expression vector; Magdalena Larysz-Brysz (Medical University of Silesia, Poland) for assistance with pathology; and Shu Guo and Yanling Jing (Peking Union Medical College). This work was supported by NIH grants NS31535, NS24279, and LM 07092.
Footnotes
Nonstandard abbreviations used: IRS, insulin receptor substrate; MEF, mouse embryonic fibroblast; mTOR, mammalian target of rapamycin; myr-Akt, myristoylated Akt; PIK3CA, PI3K p100 catalytic subunit α; PTEN, phosphatase and tensin homolog; RTK, receptor tyrosine kinase; TSC, tuberous sclerosis complex.
Conflict of interest: The authors have declared that no conflict of interest exists.
Citation for this article: J. Clin. Invest. 117:730–738 (2007). doi:10.1172/JCI28984
Natalia Bajraszewski and Erxi Wu contributed equally to this work.
References
- 1.Schlessinger J. Cell signaling by receptor tyrosine kinases. Cell. 2000;103:211–225. doi: 10.1016/s0092-8674(00)00114-8. [DOI] [PubMed] [Google Scholar]
- 2.Cully M., You H., Levine A.J., Mak T.W. Beyond PTEN mutations: the PI3K pathway as an integrator of multiple inputs during tumorigenesis. Nat. Rev. Cancer. 2006;6:184–192. doi: 10.1038/nrc1819. [DOI] [PubMed] [Google Scholar]
- 3.Thomas G.V. mTOR and cancer: reason for dancing at the crossroads? Curr. Opin. Genet. Dev. 2006;16:78–84. doi: 10.1016/j.gde.2005.12.003. [DOI] [PubMed] [Google Scholar]
- 4.Hay N. The Akt-mTOR tango and its relevance to cancer. Cancer Cell. 2005;8:179–183. doi: 10.1016/j.ccr.2005.08.008. [DOI] [PubMed] [Google Scholar]
- 5.Samuels Y., Ericson K. Oncogenic PI3K and its role in cancer. Curr. Opin. Oncol. 2006;18:77–82. doi: 10.1097/01.cco.0000198021.99347.b9. [DOI] [PubMed] [Google Scholar]
- 6.Hennessy B.T., Smith D.L., Ram P.T., Lu Y., Mills G.B. Exploiting the PI3K/AKT pathway for cancer drug discovery. Nat. Rev. Drug Discov. 2005;4:988–1004. doi: 10.1038/nrd1902. [DOI] [PubMed] [Google Scholar]
- 7.Schlessinger J. Ligand-induced, receptor-mediated dimerization and activation of EGF receptor. Cell. 2002;110:669–672. doi: 10.1016/s0092-8674(02)00966-2. [DOI] [PubMed] [Google Scholar]
- 8.Johnson B.E., Janne P.A. Epidermal growth factor receptor mutations in patients with non-small cell lung cancer. Cancer Res. 2005;65:7525–7529. doi: 10.1158/0008-5472.CAN-05-1257. [DOI] [PubMed] [Google Scholar]
- 9.Jones A.V., Cross N.C. Oncogenic derivatives of platelet-derived growth factor receptors. Cell. Mol. Life Sci. 2004;61:2912–2923. doi: 10.1007/s00018-004-4272-z. [DOI] [PubMed] [Google Scholar]
- 10.Samuels Y., et al. High frequency of mutations of the PIK3CA gene in human cancers. Science. 2004;304:554. doi: 10.1126/science.1096502. [DOI] [PubMed] [Google Scholar]
- 11.Downward J. Targeting RAS signalling pathways in cancer therapy. Nat. Rev. Cancer. 2003;3:11–22. doi: 10.1038/nrc969. [DOI] [PubMed] [Google Scholar]
- 12.Parsons D.W., et al. Colorectal cancer: mutations in a signalling pathway. Nature. 2005;436:792. doi: 10.1038/436792a. [DOI] [PubMed] [Google Scholar]
- 13.Parsons R. Human cancer, PTEN and the PI-3 kinase pathway. Semin. Cell Dev. Biol. 2004;15:171–176. doi: 10.1016/j.semcdb.2003.12.021. [DOI] [PubMed] [Google Scholar]
- 14.Kwiatkowski D.J., et al. A mouse model of TSC1 reveals sex-dependent lethality from liver hemangiomas, and up-regulation of p70S6 kinase activity in Tsc1 null cells. Hum. Mol. Genet. 2002;11:525–534. doi: 10.1093/hmg/11.5.525. [DOI] [PubMed] [Google Scholar]
- 15.Zhang H., et al. Loss of Tsc1/Tsc2 activates mTOR and disrupts PI3K-Akt signaling through downregulation of PDGFR. J. Clin. Invest. 2003;112:1223–1233. doi: 10.1172/JCI200317222. [DOI] [PMC free article] [PubMed] [Google Scholar]
- 16.Potter C.J., Pedraza L.G., Xu T. Akt regulates growth by directly phosphorylating Tsc2. Nat. Cell Biol. 2002;4:658–665. doi: 10.1038/ncb840. [DOI] [PubMed] [Google Scholar]
- 17.Corradetti M.N., Inoki K., Bardeesy N., DePinho R.A., Guan K.L. Regulation of the TSC pathway by LKB1: evidence of a molecular link between tuberous sclerosis complex and Peutz-Jeghers syndrome. Genes Dev. 2004;18:1533–1538. doi: 10.1101/gad.1199104. [DOI] [PMC free article] [PubMed] [Google Scholar]
- 18.Kwiatkowski D.J., Manning B.D. Tuberous sclerosis: a GAP at the crossroads of multiple signaling pathways. Hum. Mol. Genet. 2005;14:R251–R258. doi: 10.1093/hmg/ddi260. [DOI] [PubMed] [Google Scholar]
- 19.Li Y., Corradetti M.N., Inoki K., Guan K.L. TSC2: filling the GAP in the mTOR signaling pathway. Trends Biochem. Sci. 2004;29:32–38. doi: 10.1016/j.tibs.2003.11.007. [DOI] [PubMed] [Google Scholar]
- 20.Cai S.L., et al. Activity of TSC2 is inhibited by AKT-mediated phosphorylation and membrane partitioning. J. Cell Biol. 2006;173:279–289. doi: 10.1083/jcb.200507119. [DOI] [PMC free article] [PubMed] [Google Scholar]
- 21.Jaeschke A., et al. Tuberous sclerosis complex tumor suppressor-mediated S6 kinase inhibition by phosphatidylinositide-3-OH kinase is mTOR independent. J. Cell Biol. 2002;159:217–224. doi: 10.1083/jcb.jcb.200206108. [DOI] [PMC free article] [PubMed] [Google Scholar]
- 22.Harrington L.S., et al. The TSC1-2 tumor suppressor controls insulin-PI3K signaling via regulation of IRS proteins. J. Cell Biol. 2004;166:213–223. doi: 10.1083/jcb.200403069. [DOI] [PMC free article] [PubMed] [Google Scholar]
- 23.Shah O.J., Wang Z., Hunter T. Inappropriate activation of the TSC/Rheb/mTOR/S6K cassette induces IRS1/2 depletion, insulin resistance, and cell survival deficiencies. Curr. Biol. 2004;14:1650–1656. doi: 10.1016/j.cub.2004.08.026. [DOI] [PubMed] [Google Scholar]
- 24.Ross R., Raines E.W., Bowen-Pope D.F. The biology of platelet-derived growth factor. Cell. 1986;46:155–169. doi: 10.1016/0092-8674(86)90733-6. [DOI] [PubMed] [Google Scholar]
- 25.Tallquist M., Kazlauskas A. PDGF signaling in cells and mice. Cytokine Growth Factor Rev. 2004;15:205–213. doi: 10.1016/j.cytogfr.2004.03.003. [DOI] [PubMed] [Google Scholar]
- 26.Andrews A., et al. Platelet-derived growth factor plays a key role in proliferative vitreoretinopathy. Invest. Ophthalmol. Vis. Sci. 1999;40:2683–2689. [PubMed] [Google Scholar]
- 27.Chen N., et al. Transactivation of the epidermal growth factor receptor is involved in 12-O-tetradecanoylphorbol-13-acetate-induced signal transduction. J. Biol. Chem. 2001;276:46722–46728. doi: 10.1074/jbc.M107156200. [DOI] [PubMed] [Google Scholar]
- 28.Maxwell M., et al. Coexpression of platelet-derived growth factor (PDGF) and PDGF-receptor genes by primary human astrocytomas may contribute to their development and maintenance. J. Clin. Invest. 1990;86:131–140. doi: 10.1172/JCI114675. [DOI] [PMC free article] [PubMed] [Google Scholar]
- 29.Gilbertson R.J., Clifford S.C. PDGFRB is overexpressed in metastatic medulloblastoma. Nat. Genet. 2003;35:197–198. doi: 10.1038/ng1103-197. [DOI] [PubMed] [Google Scholar]
- 30.Dolloff N.G., et al. Bone-metastatic potential of human prostate cancer cells correlates with Akt/PKB activation by alpha platelet-derived growth factor receptor. Oncogene. 2005;24:6848–6854. doi: 10.1038/sj.onc.1208815. [DOI] [PMC free article] [PubMed] [Google Scholar]
- 31.Izumi H., et al. Mechanism for the transcriptional repression by c-Myc on PDGF beta-receptor. J. Cell Sci. 2001;114:1533–1544. doi: 10.1242/jcs.114.8.1533. [DOI] [PubMed] [Google Scholar]
- 32.Hackzell A., Uramoto H., Izumi H., Kohno K., Funa K. p73 independent of c-Myc represses transcription of platelet-derived growth factor beta-receptor through interaction with NF-Y. J. Biol. Chem. 2002;277:39769–39776. doi: 10.1074/jbc.M204483200. [DOI] [PubMed] [Google Scholar]
- 33.Molander C., Hackzell A., Ohta M., Izumi H., Funa K. Sp1 is a key regulator of the PDGF beta-receptor transcription. Mol. Biol. Rep. 2001;28:223–233. doi: 10.1023/a:1015701232589. [DOI] [PubMed] [Google Scholar]
- 34.Hara K., et al. Raptor, a binding partner of target of rapamycin (TOR), mediates TOR action. Cell. 2002;110:177–189. doi: 10.1016/s0092-8674(02)00833-4. [DOI] [PubMed] [Google Scholar]
- 35.Sarbassov D.D., et al. Rictor, a novel binding partner of mTOR, defines a rapamycin-insensitive and raptor-independent pathway that regulates the cytoskeleton. Curr. Biol. 2004;14:1296–1302. doi: 10.1016/j.cub.2004.06.054. [DOI] [PubMed] [Google Scholar]
- 36.Sarbassov D.D., et al. Prolonged rapamycin treatment inhibits mTORC2 assembly and Akt/PKB. Mol. Cell. 2006;22:159–168. doi: 10.1016/j.molcel.2006.03.029. [DOI] [PubMed] [Google Scholar]
- 37.Saito Y., Haendeler J., Hojo Y., Yamamoto K., Berk B.C. Receptor heterodimerization: essential mechanism for platelet-derived growth factor–induced epidermal growth factor receptor transactivation. Mol. Cell. Biol. 2001;21:6387–6394. doi: 10.1128/MCB.21.19.6387-6394.2001. [DOI] [PMC free article] [PubMed] [Google Scholar]
- 38.Kratchmarova I., Blagoev B., Haack-Sorensen M., Kassem M., Mann M. Mechanism of divergent growth factor effects in mesenchymal stem cell differentiation. Science. 2005;308:1472–1477. doi: 10.1126/science.1107627. [DOI] [PubMed] [Google Scholar]
- 39.Manning B.D., et al. Feedback inhibition of Akt signaling limits the growth of tumors lacking Tsc2. Genes Dev. 2005;19:1773–1778. doi: 10.1101/gad.1314605. [DOI] [PMC free article] [PubMed] [Google Scholar]
- 40.Astrinidis A., Henske E.P. Tuberous sclerosis complex: linking growth and energy signaling pathways with human disease. Oncogene. 2005;24:7475–7481. doi: 10.1038/sj.onc.1209090. [DOI] [PubMed] [Google Scholar]
- 41.Govindarajan B., et al. Tuberous sclerosis–associated neoplasms express activated p42/44 mitogen-activated protein (MAP) kinase, and inhibition of MAP kinase signaling results in decreased in vivo tumor growth. Clin. Cancer Res. 2003;9:3469–3475. [PubMed] [Google Scholar]
- 42.Han S., et al. Phosphorylation of tuberin as a novel mechanism for somatic inactivation of the tuberous sclerosis complex proteins in brain lesions. Cancer Res. 2004;64:812–816. doi: 10.1158/0008-5472.can-03-3277. [DOI] [PubMed] [Google Scholar]
- 43.O’Reilly K.E., et al. mTOR inhibition induces upstream receptor tyrosine kinase signaling and activates Akt. Cancer Res. 2006;66:1500–1508. doi: 10.1158/0008-5472.CAN-05-2925. [DOI] [PMC free article] [PubMed] [Google Scholar]
- 44.Franz D.N., et al. Rapamycin causes regression of astrocytomas in tuberous sclerosis complex. Ann. Neurol. 2006;59:490–498. doi: 10.1002/ana.20784. [DOI] [PubMed] [Google Scholar]
- 45.Kenerson H., Dundon T.A., Yeung R.S. Effects of rapamycin in the Eker rat model of tuberous sclerosis complex. Pediatr. Res. 2005;57:67–75. doi: 10.1203/01.PDR.0000147727.78571.07. [DOI] [PubMed] [Google Scholar]
- 46.Lee L., et al. Efficacy of a rapamycin analog (CCI-779) and IFN-gamma in tuberous sclerosis mouse models. Genes Chromosomes Cancer. 2005;42:213–227. doi: 10.1002/gcc.20118. [DOI] [PubMed] [Google Scholar]
- 47.El-Hashemite N., Zhang H., Walker V., Hoffmeister K.M., Kwiatkowski D.J. Perturbed IFN-gamma-Jak-signal transducers and activators of transcription signaling in tuberous sclerosis mouse models: synergistic effects of rapamycin-IFN-gamma treatment. Cancer Res. 2004;64:3436–3443. doi: 10.1158/0008-5472.CAN-03-3609. [DOI] [PubMed] [Google Scholar]
- 48.Finlay G.A., et al. Estrogen-induced smooth muscle cell growth is regulated by tuberin and associated with altered activation of platelet-derived growth factor receptor-beta and ERK-1/2. J. Biol. Chem. 2004;279:23114–23122. doi: 10.1074/jbc.M401912200. [DOI] [PubMed] [Google Scholar]
- 49.You M.J., et al. Genetic analysis of Pten and Ink4a/Arf interactions in the suppression of tumorigenesis in mice. Proc. Natl. Acad. Sci. U. S. A. 2002;99:1455–1460. doi: 10.1073/pnas.022632099. [DOI] [PMC free article] [PubMed] [Google Scholar]


