Abstract
A major obstacle to understanding the reduction of N2 to NH3 by nitrogenase has been the impossibility of synchronizing electron delivery to the MoFe protein for generation of specific enzymatic intermediates. When an intermediate is trapped without synchronous electron delivery, the number of electrons, n, it has accumulated is unknown. Consequently, the intermediate is untethered from kinetic schemes for reduction, which are indexed by n. We show that a trapped intermediate itself provides a “synchronously prepared” initial state, and its relaxation to the resting state at 253 K, conditions that prevent electron delivery to MoFe protein, can be analyzed to reveal n and the nature of the relaxation reactions. The approach is applied to the “H+/H− intermediate” (A) that appears during turnover both in the presence and absence of N2 substrate. A exhibits an S = ½ EPR signal from the active-site iron–molybdenum cofactor (FeMo-co) to which are bound at least two hydrides/protons. A undergoes two-step relaxation to the resting state (C): A → B → C, where B has an S = 3/2 FeMo-co. Both steps show large solvent kinetic isotope effects: KIE ≈ 3–4 (85% D2O). In the context of the Lowe–Thorneley kinetic scheme for N2 reduction, these results provide powerful evidence that H2 is formed in both relaxation steps, that A is the catalytically central state that is activated for N2 binding by the accumulation of n = 4 electrons, and that B has accumulated n = 2 electrons.
Keywords: intermediate, kinetic isotope effect
Nitrogenase is the two-component enzyme system that catalyzes the nucleotide-dependent reduction of N2 to yield NH3 according to the stoichiometry
 |
The major barrier to characterizing the nitrogense catalytic mechanism has been the impossibility of synchronizing the delivery of electrons, so that an individual intermediate along the N2 reduction pathway can be accumulated for characterization. This difficulty arises because the MoFe protein, which contains the N2-binding/reduction site, the iron–molybdenum cofactor (FeMo-co) ([7Fe-9S-Mo-X-homocitrate]), acquires electrons one-at-a-time from its partner, the Fe protein (1). This electron transfer (ET) process involves the nucleotide-dependent association-dissociation of the two proteins, and it cannot be synchronized because complex dissociation represents the rate-limiting step of substrate reduction (1, 2). This obstacle contrasts, for example, with the ready use of flash photolysis to synchronously generate individual intermediates of the photosynthetic reaction center (3).
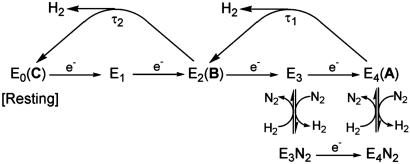
Recently, we overcame one aspect of this barrier to the study of nitrogenase through freeze-quench trapping of intermediates that form during the reduction of H+ under Ar (4), the reduction of alkyne substrates (5, 6), and most recently, several intermediates associated with N2 reduction (7). Unfortunately, these intermediates are still trapped without synchronous electron delivery to the MoFe protein, and thus the number of electrons, n, (and protons) that have been delivered during their formation is unknown. Consequently, such intermediates are untethered from the commonly accepted Lowe–Thorneley (LT) kinetic schemes for reduction by nitrogenase. The issue is that the LT scheme for N2 reduction, shown in part in Fig. 1, is formulated in terms of the conversion among intermediate states of the MoFe protein that are indexed by n and denoted En (1, 2). The problem is that n for an intermediate trapped nonsynchronously cannot in general be determined spectroscopically. The difficulty is that the n electrons accumulated by the MoFe protein can partition themselves between the substrate and FeMo-co, with the possibility that the P cluster of the MoFe protein, which mediates electron flow from Fe proteins (1), is involved as well. The “electron inventory” of the MoFe protein trapped in an intermediate state during turnover can be written: n = s + m − p, where s is the number of electrons that have been delivered to substrate, m is the number of electrons by which the cofactor of the intermediate is reduced relative to resting state, and p is the number of electrons by which the P cluster has been oxidized (p < 0 would mean the P cluster has been reduced relative to the resting state) (8). In favorable cases, s can be determined by ENDOR examination of the substrate-derived species bound to the FeMo-co of the intermediate (8). However, the spectroscopic determination of m, for example by 57Fe and 95,97Mo ENDOR studies, is blocked by the lack of an interpretative framework grounded in a firm understanding of the electronic structure of FeMo-co, whereas little is known about the involvement of P cluster.
Fig. 1.
Modified LT kinetic scheme for the first half of the N2 reduction cycle. Intermediates, En, are labeled by the number of electrons (n) transferred to the MoFe protein. Each reduction step is thought to involve delivery of both a proton and an electron; the protons are omitted. Proposed correspondences between EPR-active states, A, B, and C and En kinetic intermediates are shown. The τi represent relaxation times as discussed in the text.
We here describe a kinetic relaxation procedure for determining the En state of a trapped intermediate. It is founded on the recognition that no matter how an intermediate state of the MoFe protein has been trapped, it has accumulated a specific number of electrons, n, and it is in a specific En state. Thus, it acts as a “synchronously prepared” initial state. In particular, we hypothesized that n for an intermediate state early in the kinetic scheme (Fig. 1) could be revealed by following its “synchronous” relaxation back to the resting state (E0) through the loss of one or more equivalents of H2. This approach, of course, requires experimental conditions that guarantee that no additional electrons are transferred from Fe protein to MoFe protein during the relaxation. However, ET from the Fe protein to the MoFe protein absolutely requires dissociation/association of the Fe–MoFe protein complex (1, 2), and we recognized that this ET would be abolished if Fe–MoFe association/dissociation were prevented by keeping the sample frozen.
These considerations led us to the following relaxation protocol. An intermediate is first trapped by 77 K freezing of the enzyme under turnover conditions, and its “zero-time” EPR signal is measured at 2 K. Its solid-phase relaxation at a desired temperature is then monitored by step-annealing the sample (see Materials and Methods) to that temperature for predetermined intervals, ti, followed by cooling to 2 K to measure by EPR spectroscopy the new concentrations of all EPR-active species after the ti intervals (9, 10). To confirm that observed reactions indeed occur without transfer of electrons from the Fe to the MoFe protein, the EPR signal of the Fe protein is monitored in parallel: ET would be revealed as an oxidation of the reduced Fe protein and diminution of its EPR signal. Of particular importance, kinetic isotope effects (KIEs) can be determined by comparing results for samples prepared with H2O and D2O buffers, and used to characterize bond-making/breaking of hydrogen(s) in the rate-limiting step of the transformations (11, 12), which is expected according to Fig. 1. This step-annealing approach (9) is unique in that the KIE for an individual kinetic step can be measured directly by monitoring reactant and product, rather than being deduced from complicated kinetic analyses.
The relaxation protocol is applied here to the “H+/H−” intermediate (denoted A) that was first trapped during turnover of the α-70Ile MoFe protein under Ar and was shown by ENDOR spectroscopy to have two protons or hydrides bound to an S = 1/2 state of FeMo-co (4). Since then, we have observed this intermediate during turnover of the wild-type enzyme both in the presence and absence of N2 as substrate, which implicates this intermediate as part of the natural workings of the native enzyme during normal catalysis of N2 reduction. ENDOR spectroscopy showed that FeMo-co of this intermediate binds two chemically equivalent and symmetry-related hydrogenic species that have quite surprisingly large hyperfine coupling constants.
Because H+/H−-bound FeMo-co of A is EPR-active, S = 1/2, the electron count of the active site of A can differ from that of the EPR-active, S = 3/2, resting state only by an even number of electrons: m + s = even. The resting-state P cluster is even-spin and EPR-silent. We have searched for and failed to detect a half-integer-spin EPR signal from A for a P cluster that has been oxidized/reduced by an odd number of electrons, so we conclude that the P cluster of A can differ from that of the resting state only by an even number of electrons: p = even. As a result of this “electron inventory” (8), we may then conclude: n = m + s − p = even. Setting aside as unlikely the possibilities that A contains a protonated resting state of FeMo-co and has n = 0, or that A is the “over-reduced” state with n = 6, then the LT scheme, Fig. 1, offers only two possible assignments. The intuitive “first-guess” would postulate the lesser electron accumulation, and assign this intermediate as E2, in which FeMo-co has accepted n = 2 electrons from Fe protein and bound two H+ to generate bridging μ2-SH. However, we argued that μ2-SH could not give the observed large 1,2H coupling constants, and further thought a μ3-SH to be unlikely on energetic and hyperfine-coupling grounds. As a result, we turned to models that involve metal-bound hydrides. But such models likely would involve more highly reduced states of the FeMo-co, opening the possibility that A is E4 and has accumulated n = 4 electrons. According to Fig. 1, there should be a clear distinction in the relaxation behaviors of E2 and E4: the former should relax to the resting E0 state in a single step, with the production of H2; the latter in two steps, both with H2 generation. In fact, the present results provide powerful evidence for the central importance of the H+/H− intermediate in the reduction of N2 by nitrogenase by implicating it as the catalytically central E4 state (Fig. 1) that has been activated for N2 binding by the accumulation of n = 4 electrons (1).
Results
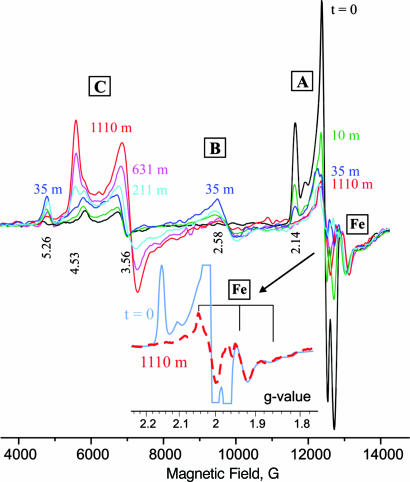
The α-70Ile MoFe protein was used here because it exhibits the highest concentration of trapped H+/− intermediate when turned over under Ar. Its resting state contains FeMo-co in the characteristic S = 3/2 resting state (here denoted, C), with g-tensor, gC = [4.53, 3.56, 2.00] (Fig. 2). When the enzyme is freeze-quenched during turnover under Ar, this signal is almost completely abolished and there appears the “t = 0” EPR signal of the S = 1/2 H+/H− intermediate A, with gA = [2.14, 2.00, 1.96] (Fig. 2); underlying the A signal and to high field of it is the EPR signal from reduced Fe protein (Fig. 2 Inset). When the sample is step-annealed at 253 K, the signal from A progressively decreases, whereas that from the Fe protein remains unchanged (Fig. 2), thereby establishing that A indeed relaxes in the 253 K frozen sample and that this reaction is not coupled to ET from Fe protein to MoFe protein.
Fig. 2.
Digital derivatives of EPR spectra collected from freeze-quenched α-70Ile H+/− intermediate (“t = 0”) and after 10, 35, 211, 631, and 1,110 min of step-annealing at T = 253 K. (Inset) Expansion of g-2 region for t = 0, and 1,110-min spectra, showing that the nonoverlapped regions of the Fe protein signal (g2-g3) are essentially coincident, hence, the amount of reduced Fe-protein is indeed unchanging during step-annealing. Conditions: microwave frequency = 35.016–35.289 GHz; power = 0.32 mW; modulation amplitude = 1.3 G; T = 2 K.
Relaxation of the H+/H− Intermediate (A).
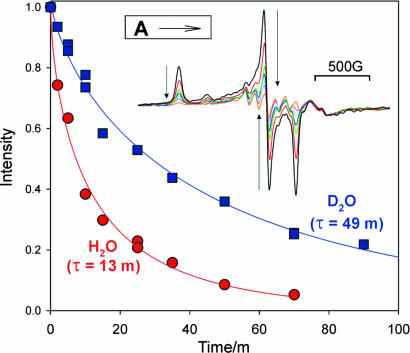
The relaxation time courses for A prepared with H2O and D2O buffers are presented in Fig. 3. Initial fit attempts showed that the decays are not exponential. Such behavior is seen when the observed species exists as a distribution of conformational substates, with the decay constant varying somewhat over the distribution (13). As a result, the effective first-order rate coefficient appears to decrease in time; in fact, the more reactive substates decay early, leaving those with lower decay rates to react later. This situation can be modeled with a “stretched exponential,” IA(t) = I0exp(−(t/τ)a), where τ is the decay time and the breadth of the distribution is reflected in the constant, 0 < a ≤ 1, with smaller values for a corresponding to greater breadth. This equation fits the relaxations of A in both H and D isotopic buffers with a = 0.71 (Fig. 3). The decay times yield a KIE, KIE(253 K)1 = τ1(D2O)/τ1(H2O) = 49 min/13 min = 3.8 (85% D2O). An alternate fit as a biexponential gives 50% each of two kinetic phases, both with KIE ≈ 3. The slowing of the decay in D2O buffer is not merely an overall influence of D2O on the enzyme, for the corresponding relaxation of at least one other freeze-quench intermediate is unchanged in D2O (D.L., unpublished data). The KIE for the relaxation of A is larger than expected for a solvent KIE (9–11, 14, 15). Given that the H+/H− intermediate (i) is trapped during conditions of H2 production and (ii) has two H+/H− bound to FeMo-co (4), we interpret the large KIE1 to mean that the reduced FeMo-co of A relaxes with formation of H2 from the two H+/H−, as expected from the LT scheme for N2 reduction: as shown in Fig. 1, both EPR-active (two-electron reduced) intermediates that might be involved are expected to relax by H2 production.
Fig. 3.
Relaxation of intermediate A at 253 K in H2O and D2O buffer. Intensities were obtained from digital derivatives of EPR spectra and normalized to the t = 0 EPR signal. Solid lines are the results of fits to stretched exponential (see text): a1 = 0.71, τ1(H2O) = 13 min, τ1(D2O) = 49 min. (Inset) Digital derivatives of EPR spectra of A during annealing.
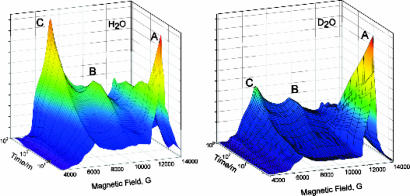
The spectra of Fig. 2 not only show the disappearance of A and the appearance of the resting state, C, but also show the appearance and disappearance of a signal from a new state, B; it has a highly rhombic g tensor, gB = [5.26, 2.58, -] from S = 3/2 FeMo-co. [Careful examination disclosed no signals that could be assigned to the other cluster in the MoFe protein, the P cluster.] Numerous spectra were collected during the annealing of samples prepared with H2O and D2O buffers, and 3D plots of the time variation of those spectra (Fig. 4) demonstrate that the appearance of B follows the loss of A and precedes the appearance of C, indicative of sequential A → B → C relaxation.
Fig. 4.
Three-dimensional plot of EPR spectra collected during the stepwise annealing of α-70Ile H+/− intermediate at 253K in H2O (Left) and D2O (Right). Major features for each species A, B, and C are labeled. To aid the eye, the usual “rainbow” color scheme is used, with orange corresponding to the highest EPR intensity and blue corresponding to the lowest.
Raising A.
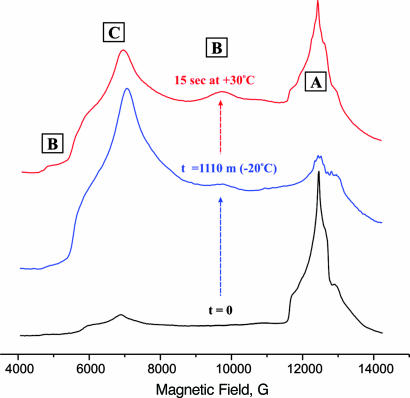
Before discussing the relaxation data in detail, we describe an experiment that was designed to test whether the quench/step-anneal protocol is benign, and that was suggested by considerations of the enzymatic status of a sample that has undergone long-time annealing. The EPR spectrum of such a sample (H2O; 1,110 min of annealing at 253 K; Figs. 2 and 4) shows that the A state is long gone, B is nearly gone, and the C resting state is substantially recovered. The intensity of the reduced Fe-protein signal did not change during this annealing period, which means that there are reducing equivalents present for further turnover if Fe → MoFe electron transfer were to be reenabled, and considerable ATP remains to drive this ET. Thus, if the enzyme is undamaged by the step-annealing process, then restoration of the association/dissociation needed for ET from Fe to MoFe by merely thawing the sample should regenerate A for freeze-quench trapping (see ref. 16). In fact, this happens. Fig. 5 presents the 2 K spectrum of a sample that was step-annealed for 1,110 min, thawed, and turned over for ≈15 s at 30°C, then freeze-quenched at 77 K. As seen in Fig. 5, this variant trapping procedure raises the A signal to over ≈1/2 its “t = 0” intensity in the original turnover sample. The C signal, although still less than that of the resting-state MoFe (not shown), is more intense than that in the t = 0 spectrum of the original freeze-quench sample, whereas the B signal is more intense than it is at the end of the annealing. The EPR intensities confirm that much of the FeMo-co of the initial freeze-quench sample was in EPR-silent states (e.g., E1). The differences between the species distribution in quenched and “requenched” samples presumably arise because the two differ in turnover time and temperature. When a quenched sample is thawed to 30°C, kept at that temperature until the ATP is depleted, then quench-frozen, its 2 K EPR spectrum shows the full signal of resting MoFe protein, C, as expected.
Fig. 5.
EPR spectra showing that the α-70Ile H+/− intermediate A (Bottom) is lost with complete annealing, to produce a sample with signals from C and residual B (Middle), and that A is “raised” with simultaneous diminution of resting state signal C and increase of B signal if the annealed sample is turned over at +30°C for ≈15 s and quench-frozen (Top).
Full Kinetic Analysis.
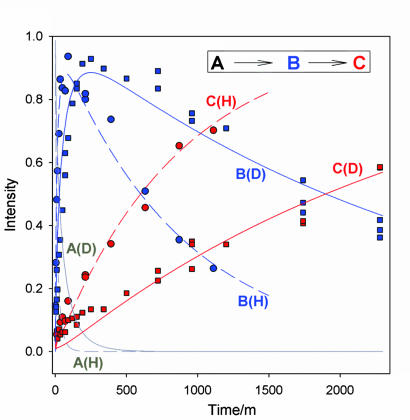
We can describe the time courses for the three intermediates in H2O and D2O buffers (Fig. 6) with a single set of coupled differential equations for an A → B → C kinetic scheme where the equations allow for “stretched-exponential” decays of both A and B. The equations for A and B incorporate first-order decays, where the rate coefficients decrease in time and are characterized by decay times, τi, and coefficients, 0 < ai ≤ 1 (17).
If C forms only through A → B → C relaxation, without, for example, a contribution from relaxation of EPR-silent states that are present in the initially quenched sample, then the corresponding time course for C is obtained from those for A and B through the (normalized) equation for the conservation of FeMo protein within the A, B, and C states,
Fig. 6.
Relaxation progress curves for the three intermediates in H2O and D2O and their fits to eqs 2–4. Parameters: a1 = 0.71, τ1(H2O) = 13 min, τ1(D2O) = 49 min; a2 = 1 (exponential), τ2(H2O) = 870 min, τ2(D2O) = 2,700 min. For clarity, data points for A have been omitted (see Fig. 2).
Despite the considerable difficulty in quantitating the strongly overlapping EPR signals of the B and C states, the complete set of relaxation measurements in both D2O and H2O buffers is quite satisfactorily described by Eqs. 2–4, as shown by the overlap of calculated and measured progress curves (Fig. 6). In the calculations, we set a1 = 0.71, the value obtained above; a2 was indistinguishable from unity (1 ≥ a2 > 0.8) and we set a2 = 1. The difference between a1 and a2 presumably reflects the fact that B forms at 253 K in the solid, whereas A is formed at ambient and quench-frozen. The B → C relaxation times correspond to KIE2 = τ2(D2O)/τ2(H2O) = 2,700 min/870 min = 3.1 (85% D2O), comparable to that for A → B relaxation, KIE1 = 3.8 (see above).
Discussion
What, then, are: (i) the En identifications (n even) of the H+/H− intermediate, A, and of the state to which it relaxes, B; (ii) the nature of the A → B → C relaxation processes? As shown in Fig. 1, if A were E2, it would relax to resting FeMo-co (E0) with the two-electron/proton loss of H2, consistent with the large KIE for the decay of A.¶ However, A could be E2 only if the S = 3/2 state B to which it relaxes has the resting FeMo-co electron count (n = 0), which would require B to be a metastable conformational substate of the resting (E0) enzyme, rather than a distinct MoFe state. However, there is more B present after regeneration of the annealed sample than at the end of the initial annealing (Fig. 5), although it is unlikely that a metastable conformational substate could be trapped during the relatively slow process of hand-quenching after regeneration. Furthermore, the KIE for the B → C relaxation process is larger than could be expected (18) for conformational relaxation of metastable resting (E0) MoFe protein in the frozen state, and implies that the rate-limiting step involves transfer of a solvent-derived proton. Together, these observations lead us to propose that B not an E0 conformer, but is a chemically distinct FeMo-co state.
If the EPR-active H+/H− intermediate A relaxes to an EPR-active state that is not E0, then A cannot be E2, and must be a more highly reduced state: En, n ≥ 4; even. Clearly, the compelling assignment for A then becomes E4 (Fig. 1), thought to be the most probable state for N2 to bind (1). Indeed, viewed in terms of the LT kinetic mechanism for N2 reduction, E4 is the state that “should” accumulate during turnover under Ar in the absence of N2, as it is the kinetic stage where proton and N2 reduction compete. The identification A = E4 in turn leads to the assignment, B = E2. Both FeMo-co in the relaxations, E4(A) → E2(B) and E2(B) → E0(C), should occur with the loss of H2 (Fig. 1), consistent with the KIE ≈ 3–4 (85% D2O) for both steps.‖
Although a high-spin FeMo-co (S = 3/2) state for FeMo-co of B = E2 contrasts with the S = 1/2 state of CO-bound FeMo-co in turnover intermediates also assigned as E2 (8), other strongly rhombic S = 3/2 signals have been assigned to reduced FeMo-co, with m = n ≥ 2 (even) and presumably n = 2 (19, 20). The unsurprising implication of this variability is that the spin state of the multimetallic m = 2 FeMo-co can be controlled by the number and nature of metal-bound ligands, just as with mononuclear centers.
Conclusions
By monitoring the relaxation of the nitrogenase H+/H− intermediate (A) during step-annealing we have arrived at the assignments of A as E4 and of the newly observed B as E2 (Fig. 1). The resulting interpretation of the observed two-step relaxation of A, summarized in Eq. 5,
 |
is the reverse of the steps that activate FeMo-co for N2 binding and subsequent reduction, Fig. 1. The hydrogens that form H2 during the A → B relaxation undoubtedly are the two H+/− characterized previously by 1,2H ENDOR; whether the protons associated with B → C conversions are already bound to the cofactor or are recruited during relaxation can, in principle, be determined with 1,2H ENDOR studies of B. In either case, if the apparent difference between the KIE for the two steps of H2 production is substantiated, could reflect different binding modes of H+/H− in E4(A) and E2(B). Additional relaxation and ENDOR experiments are planned to rigorously test the present proposals, which undoubtedly will stimulate further theoretical investigations of nitrogenase intermediate states, as well. The protocol described here will be used in efforts to integrate N2 reduction intermediates into kinetic schemes and molecular mechanisms for NH3 formation, thereby providing further powerful insights into the mechanism by which nitrogenase reduces N2.
Materials and Methods
The Azotobacter vinelandii strain DJ1373 expressing the α-70Ile variant MoFe protein was grown and the protein prepared as described (4). The MoFe protein was concentrated to 150 μM in Mops buffer at pH 7.1 in the standard EPR turnover buffer (4) with 150 mM NaCl added to avoid precipitation of the protein at high concentrations. A separate set of “D2O” samples was prepared at pD = 7.1 by exchanging and concentrating the MoFe protein into turnover buffer prepared with D2O at pH 6.7, as read by pH meter (12). This exchange should result in a buffer that is ≈85% D2O. Multiple turnover samples of each solution were prepared by adding Fe protein from a concentrated stock to a final concentration of 120 μM, and immediately flash freezing.
A step-annealing stage involved rapidly warming a sample held at ≤77 K to 253 K by placement for a fixed time in a methanol bath held at that temperature, quench-cooling back to 77 K, and then collecting a 2 K EPR spectrum. EPR spectra were taken with a 35-GHz spectrometer as described (21). Step-annealing procedures were first perfected by Davydov during studies of the reaction of active-oxygen intermediates that had been directly generated in a 77 K sample by radiolytic cryoreduction (9, 10).
The annealing temperature of 253 K was chosen because, at that temperature and below, annealing caused no changes in the intensity of the Fe-protein EPR signal (see Fig. 2, especially Inset), but relaxation at 243 K or below is too slow to be followed conveniently. During annealing at 263 K, the signal from the Fe protein changes intensity, indicating that ET is allowed in the “frozen solid,” presumably because pools of liquid form between “ice grains.”
The 2 K EPR spectra are obtained under “rapid passage” conditions and appear as absorption signals. Their digital derivatives were normalized using the Fe protein signal as a standard and quantitative changes of individual EPR signals were determined as intensity changes of their g1 or g2 features. The solutions of the kinetic equations of annealing/relaxation (Eqs. 2–4), were generated in Mathcad.
Acknowledgments
We thank Dr. Roman Davydov as our guide to the wonders of step-annealing. We join in acknowledging the contributions to nitrogenase studies by Profs. David Lowe and Roger Thorneley, a portion of which are discussed herein. This work has been supported by National Institutes of Health Grants HL13531 (to B.M.H.) and R01-GM59087 (to L.C.S. and D.R.D.), the United States Department of Agriculture Postdoctoral Fellowship Program (2004-35318-14905, to B.M.B.), and benefitted from National Science Foundation Grant MCB 0316038 (to B.M.H.).
Abbreviations
- FeMo-co
iron-molybdenum cofactor
- ET
electron transfer
- LT
Lowe–Thorneley
- KIE
kinetic isotope effect.
Footnotes
The authors declare no conflict of interest.
To calibrate the observed KIE ≈ 3–4, if this is caused only by the loss in the transition state of the zero-point energy of the stretching vibration of a single reacting H, then that vibration would have an energy of ≈1,700 cm−1.
Unfortunately, the H2 produced during step-annealing cannot be quantified as a test of our conclusions because an undetermined amount of H2 is formed during turnover before freeze-quenching.
References
- 1.Burgess BK, Lowe DL. Chem Rev. 1996;96:2983–3011. doi: 10.1021/cr950055x. [DOI] [PubMed] [Google Scholar]
- 2.Thorneley RNF, Lowe DJ. Metal Ions Biol. 1985;7:221–284. [Google Scholar]
- 3.Blankenship RE. Molecular Mechanisms of Photosynthesis. Oxford: Blackwell; 2002. [Google Scholar]
- 4.Igarashi RY, Laryukhin M, Santos PCD, Lee H-I, Dean DR, Seefeldt LC, Hoffman BM. J Am Chem Soc. 2005;127:6231–6241. doi: 10.1021/ja043596p. [DOI] [PubMed] [Google Scholar]
- 5.Dos Santos PC, Igarashi RY, Lee H-I, Hoffman BM, Seefeldt LC, Dean DR. Acc Chem Res. 2005;38:208–214. doi: 10.1021/ar040050z. [DOI] [PubMed] [Google Scholar]
- 6.Lee H-I, Igarashi RY, Laryukhin M, Doan PE, Dos Santos PC, Dean DR, Seefeldt LC, Hoffman BM. J Am Chem Soc. 2004;126:9563–9569. doi: 10.1021/ja048714n. [DOI] [PubMed] [Google Scholar]
- 7.Barney BM, Yang T-C, Igarashi RY, Santos PCD, Laryukhin M, Lee H-I, Hoffman BM, Dean DR, Seefeldt LC. J Am Chem Soc. 2005;127:14960–14961. doi: 10.1021/ja0539342. [DOI] [PubMed] [Google Scholar]
- 8.Lee H-I, Sørlie M, Christiansen J, Yang T-C, Shao J, Dean DR, Hales BJ, Hoffman BM. J Am Chem Soc. 2005;127:15880–15890. doi: 10.1021/ja054078x. [DOI] [PubMed] [Google Scholar]
- 9.Davydov R, Matsui T, Fujii H, Ikeda-Saito M, Hoffman BM. J Am Chem Soc. 2003;125:16208–16209. doi: 10.1021/ja038923s. [DOI] [PubMed] [Google Scholar]
- 10.Davydov R, Kofman V, Fujii H, Yoshida T, Ikeda-Saito M, Hoffman B. J Am Chem Soc. 2002;124:1798–1808. doi: 10.1021/ja0122391. [DOI] [PubMed] [Google Scholar]
- 11.Isaacs NS. Physical Organic Chemistry. Singapore: Longman; 1995. [Google Scholar]
- 12.Quinn DM. Isotope Effects in Chemistry and Biology. New York: Taylor and Francis; 2006. pp. 995–1018. [Google Scholar]
- 13.Frauenfelder H, Sligar SG, Wolynes PG. Science. 1991;254:1598–1603. doi: 10.1126/science.1749933. [DOI] [PubMed] [Google Scholar]
- 14.Cleland WW, O'Leary MH, Northrop DB. Isotope Effects on Enzyme-Catalyzed Reactions. Baltimore: University Park Press; 1977. pp. 64–99. [Google Scholar]
- 15.Schowen KBJ. In: Transition States of Biochemical Processes. Gandour RD, Schowen RL, editors. New York: Plenum; 1978. pp. 225–284. [Google Scholar]
- 16.van Rijn R. The Raising of Lazarus. Macomb, IL: Western Illinois Univ Art Gallery; 1632. etching. [Google Scholar]
- 17.Phillips JC. Rep Prog Phys. 1996;59:1133–1207. [Google Scholar]
- 18.Wang M-S, Gandour RD, Rodgers J, Haslam JL, Schowen RL. Bioorg Chem. 1975;4:392–406. [Google Scholar]
- 19.Sorlie M, Christiansen J, Lemon BJ, Peters JW, Dean DR, Hales BJ. Biochemistry. 2001;40:1540–1549. doi: 10.1021/bi0013997. [DOI] [PubMed] [Google Scholar]
- 20.Fisher K, Newton WE, Lowe DJ. Biochemistry. 2001;40:3333–3339. doi: 10.1021/bi0012686. [DOI] [PubMed] [Google Scholar]
- 21.Werst MM, Davoust CE, Hoffman BM. J Am Chem Soc. 1991;113:1533–1538. [Google Scholar]


