

Abstract
Association studies offer an exciting approach to finding underlying genetic variants of complex human diseases. However, identification of genetic variants still includes difficult challenges, and it is important to develop powerful new statistical methods. Currently, association methods may depend on single-locus analysis—that is, analysis of the association of one locus, which is typically a single-nucleotide polymorphism (SNP), at a time—or on multilocus analysis, in which multiple SNPs are used to allow extraction of maximum information about linkage disequilibrium (LD). It has been shown that single-locus analysis may have low power because a single SNP often has limited LD information. Multilocus analysis, which is more informative, can be performed on the basis of either haplotypes or genotypes. It may lose power because of the often large number of degrees of freedom involved. The ideal method must make full use of important information from multiple loci but avoid increasing the degrees of freedom. Therefore, we propose a method to capture information from multiple SNPs but with the use of fewer degrees of freedom. When a set of SNPs in a block are correlated because of LD, we might expect that the genotype variation among the different phenotypic groups would extend across all the SNPs, and this information could be compressed into the low-frequency components of a Fourier transform. Therefore, we develop a test based on weighted Fourier transformation coefficients, with more weight given to the low-frequency components. Our simulation results demonstrate the validity and substantially higher power of the proposed method compared with other common methods. This method provides an additional tool to existing methods for identification of causative genetic variants underlying complex diseases.
Association studies are an important method for detecting genetic variants for human traits or diseases. Recent development of large-scale genotyping techniques, along with a rapid drop in genotyping costs, makes it possible to use this approach in a systematic way. Nonetheless, identification of genetic variants underlying susceptibility to complex human diseases still includes challenges. One of those challenges is to develop powerful statistical tools. Among other factors, the power of association analysis depends partly on the linkage disequilibrium (LD) pattern in a specific region of the genome. It has been shown that LD patterns are quite variable in the genome.1–3
In this report, we focus on multiple correlated SNPs genotyped in a block. Various statistical methods have been developed for exploring the existence of a causative variant. Single-locus analysis can be very inefficient because a single SNP marker may have little information for predicting a causative variant. In this case, the joint information from all available SNPs can be extremely useful for obtaining a powerful test.
Multilocus analysis may depend directly on either haplotypes or genotypes. A useful discussion, among others, about haplotype-based analysis versus genotype-based analysis is provided by Clayton et al.4 Currently, the phase information needed to determine the haplotypes of each subject is not easily available but can be inferred partially in a statistical way, by use of, for example, the expectation-maximization algorithm.5 The uncertainty of haplotypes leads to an inflated statistic variance and therefore reduces the power of haplotype-based methods. A more severe problem with haplotype-based analysis is that a large number of degrees of freedom is often involved in the test statistic. For example, a naive haplotype method is to code haplotypes as a vector of indicators in which each element corresponds to a possible haplotype. In this way, we obtain a saturated model that lacks parsimony, and the number of degrees of freedom can be up to 2m-1 for m SNP markers. When higher-order terms are not related to the causative locus—for example, if the genetic effects of several variants do not depend on whether they are on the same chromosome (cis) or on the opposite chromosome (trans)—haplotype-based methods are not powerful, although haplotypes capture most of the information. To save some degrees of freedom, one direct method is to classify haplotypes into groups. This method is often not satisfactory in practice, because an appropriate classification is not guaranteed when the genetic model is unknown. Another method is to define and compare a haplotype-similarity measure for cases and controls,6 which has been shown to be very close to genotype-based methods.7
Genotype-based methods lie between single-locus analysis and haplotype-based analysis, in that they uncover more information about a causative locus than any single SNP but without entailing an extremely large number of degrees of freedom. One genotype-based method uses Hotelling’s T2 test,8 where the number of degrees of freedom equals the number of SNPs. This statistic is equivalent to applying a multivariate regression to simultaneously test all the SNPs. In fact, each locus in a set of correlated SNPs does not necessarily contain independent prediction information about the disease variant, and thus some of the degrees of freedom of Hotelling’s T2 test are wasted. In this sense, it is not a surprise that single-locus analysis is more powerful when one SNP is able to capture most of the causative locus information. The dilemma of wanting both more information and fewer degrees of freedom raises the question of how best to develop new analytic methods.
In this report, we develop a method that captures information from multiple correlated SNPs with the smallest number of degrees of freedom. We propose to compress the useful information provided by all the SNPs by using a Fourier transform (FT) based on genotypic/haplotypic scores and then to construct our statistic by basing it mainly on informative components. We evaluate the properties of our method by a simulation study.
We assume that n independent individuals are genotyped for m highly correlated SNPs in an association study. Let individual i have trait value Yi (e.g., if diseased, Yi=1; otherwise, Yi=0) and genotype Xi=(X1i,…,Xmi). For the genotype of individual i at the jth marker, Xji can be simply defined by the allele dosage (Xji=0, 1, or 2) for an additive trait model or by Xji=0 or 1 for a dominant or recessive model. With the assumption that the genotype affects only the mean of the phenotype measure and not its scale, the relation between the trait Yi and the genetic markers may be represented by a generalized linear regression model,
where α denotes the regression intercept, XTi is the transpose of Xi, β is a vector of the genetic effects of the SNP markers, and h is the link function. The global association between all SNP markers and the causative locus may be examined by testing whether at least one βj=0 for all 1⩽j⩽m. Following model (1), various statistics may be established. For example, Schaid et al.9 derived a score statistic, based on this model, that is equivalent to Armitage’s trend test in a case-control design. However, the performance of this statistic may deteriorate, on account of the accumulated noise from an increased number of SNPs. Model (1) can also be directly used to handle haplotype data. However, it can be worse for a haplotype-based analysis, because the number of haplotypes can be as high as 2m.
An ideal analysis method must capture most of the useful information with the fewest possible degrees of freedom. In the scenario of multiple correlated SNPs in a block, the genotypic variation among trait groups is intuitively expected to be across all SNPs, and the local variation is more likely to be noise. For a case-control study, similar genotypic differences between cases and controls should be observed in most of the SNPs. Hence, it may be useful to capture, with fewer degrees of freedom, only the information that extends across SNPs. This could be done by using an FT. The FT is a linear operator that maps one set of functions to another set of functions. Loosely speaking, the FT changes a function into its frequency components. In our case, the lower-frequency components should be the more informative ones for the purpose of detecting association.
The sequence of m SNP genotypic values, X1i,…,Xmi, is transformed into the sequence of m numbers, x0i,…,xm-1,i, by the discrete FT, according to the formula
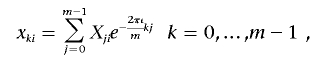 |
where  . Here, we are interested only in the real parts of the FT coefficients, and the lowest-frequency component is just the sum of the genotype values. In practice, this transformation is easily done with the function provided by commonly used software packages, such as R and metlab. For a set of SNPs in strong LD, we first recode the genotypic values to obtain a matrix of SNP genotype correlation coefficients that are positive. For example, if, for two SNPs, the original genotype values yield a negative correlation coefficient, we can use a complementary coding for one of the two. For instance, for an additive trait, we change Xji to ∣2-Xji∣, to obtain a positive coefficient. In this way, the genotype variation among trait groups, which is the information useful for detecting association, is consistent across markers. Then, the association information from the multiple SNPs can be compressed into fewer dimensions by the FT. The process is illustrated in figure 1. We can see that the original genotype differences between cases and controls scatter across all SNPs (fig. 1A). After recoding, the genotype scores between cases and controls are more consistent (fig. 1B). In this example, most of the genotype score information is further compressed into the lowest component of the FT (fig. 1C). We noted that this coding does not bias the subsequent test, because it is independent of the trait values. In practice, the FT is calculated by a fast algorithm called the “FFT.”
Figure 1. .

Compression of the genotypic differences among 100 controls and 100 cases by FT. Subjects 1–100 are the controls, and subjects 101–200 are the cases. A, Original genotype values. B, Recoded genotype values. C, FT components.
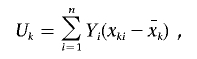
Following Schaid et al.,9 we can derive the score statistic of an FT component x on the basis of model (1). If we let xki be the kth FT component of subject i, the score is
 |
and the variance of Uk can be estimated by
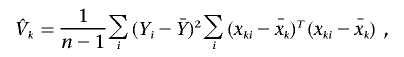 |
where  and
and  are the sample means of the trait and the FT coefficient. This same score statistic can be used for either discrete or continuous traits. Although it is derived on the basis of a prospective likelihood, the score statistic has been shown to be asymptotically equivalent to a statistic based on the retrospective likelihood, which ignores trait selection.10
We consider a weighted score statistic to combine the information from the FT coefficients. Intuitively, we should use a weighted sum statistic that gives more weight to lower-frequency components and less weight to higher-frequency components. The weight function we consider is [1/(k+1)]2 for the kth component. Let V0 be the estimated variance-covariance matrix of U=(U0,…,Uk-1), and let w be the vector of weights. Since the FT components xki are asymptotically independent, V0 is an m×m matrix with diagonals  and off-diagonals 0. The global weighted score statistic is then
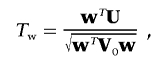 |
and Tw has an asymptotic standard normal distribution.
We now compare several often-used tests with the method we propose. The simplest global test for m SNPs is to fit the regression one marker at a time. The P value of the global test is then given by min(Pj), with Bonferroni correction. We denote this procedure TB. Because of the correlation between pairs of SNPs, Bonferroni correction can be conservative. The global P value for the m regressions can also be evaluated on the basis of a permutation procedure by shuffling the trait values and maintaining the dependence among the markers (TP). However, fitting m regressions one at a time may fail when any single SNP has limited information. In this case, it is helpful to fit the regression model with multiple SNPs. We therefore also investigate, by simulation, a likelihood-ratio test based on logistic regression (TH).
We first perform a set of simulations to prove the concept. The haplotypes for 4 and 10 correlated SNP markers are simulated on the basis of a multivariate normal distribution with pairwise correlations ρ. Each allele on a haplotype is generated by dichotomizing the normal distribution with the cutoff determined by an allele frequency that is randomly sampled from a uniform distribution between 0.2 and 0.8. The genotype value for each individual is then generated to be the sum of two haplotypes. We assume a multiplicative trait model with a relative risk (RR) and with the frequency of the minor allele at the causative SNP equal to p. We consider sampling 100 cases and 100 controls. For each model, we simulate 1,000 data sets, and the permutation test is based on 1,000 replicates of each data set. An unobserved causative SNP is simulated to be in the middle of all the SNPs. We consider p in the range 0.1–0.4 and a multiplicative model with RR ranging from 1 (for type I error rate) to 2. The simulated LD patterns are defined by ρij, where i and j are the location index of markers and the trait locus on the chromosome, respectively. In the power comparison, we considered three scenarios: ρij=0.4, ρij=0.8∣i-j∣, or ρ is randomly sampled from a uniform distribution between 0.3 and 0.7. The scenario ρ=0.4 corresponds to an LD pattern with each SNP providing similar information about the disease locus. The scenario ρ=0.8∣i-j∣ is similar to an LD pattern in which LD is primarily a function of marker distance. However, because of population phenomena, such as genetic drift, mutation, nonrandom mating, and so forth, the actual LD pattern is more complicated. To simulate this last scenario, we sample ρ from a uniform distribution between 0.3 and 0.7. The LD patterns for 4 and 10 SNPs sampled from this uniform distribution are given in figure 2.
Figure 2. .

LD-pattern color plot for simulations generated with ρ sampled from a uniform distribution between 0.3 and 0.7. The scale from lower values (yellow) to higher values (red) corresponds to the increase in the absolute values of correlation.
Simulations showed that all the tests had good control of the 5% error rate when ρ was in the range 0.1−0.8 (fig. 3A and 3B). However, we found that the likelihood-ratio test based on logistic regression tends to be slightly liberal when the number of SNPs is large (m=10). The increased type I error rate of this test is likely the result of small-sample violation of asymptotic theory. Hence, we also examined the type I error rates for a sample size of 2,000 and found that the type I error rate of TH tends to be closer to the nominal level. As expected, the single-locus analysis with Bonferroni correction is conservative, but the effect is slight.
Figure 3. .

Type I error rates of four tests with m=4 (A) and m=10 (B) at the 5% level under different ρ values in simulations. The solid horizontal line is the nominal 0.05 level. Analysis is based on 100 cases and 100 controls, with ρ taking on the values 0.1, 0.2, 0.3,…, 0.8. The statistics TB, TP, TH, and Tw are denoted B, P, H, and W, respectively.
The results of power calculations for m=4 and m=10 under a multiplicative model are shown in figures 4 and 5, respectively. We can see that the results for different disease-allele frequencies (p), different LD patterns, and different numbers of markers (m) display similar patterns of empirical power. The proposed statistic Tw is uniformly more powerful than single-locus analysis and multilocus logistic analysis. Because the useful information across multiple SNPs can be successfully compressed into fewer components in our simulations, our statistic obtains a substantial gain in power by enjoying both fewer degrees of freedom and the use of information from multiple markers. The power gain of our statistic, compared with single-locus analysis, comes from the additional information used. We also found that the gain in power of Tw is largest when all markers have similar but little information about a disease locus. The reason for this is that TP is expected to have very low power in this case, and our statistic is more robust. Our simulation results showed that TP is more powerful than TB because it avoids a conservative correction for multiple testing, although this gain was small in our simulations. Results also showed that TP is often more powerful than multilocus logistic regression analysis. By comparing figures 4 and 5, we can see that the difference between our method and the logistic regression method is more significant when the number of markers is larger, suggesting that the logistic method is more sensitive to the number of SNPs than ours is, because of the increased degrees of freedom.
Figure 4. .

Empirical powers of different approaches with m=4 at the 5% level for a multiplicative model. The disease-allele frequency is given by p (0.2, 0.3, or 0.4). A, ρ=0.4. B, ρ=0.8|i-j|. C, ρ is sampled from a uniform distribution between 0.3 and 0.7. The statistics TB, TP, TH, and Tw are denoted B, P, H, and W, respectively.
Figure 5. .

Empirical powers of different approaches with m=10 at the 5% level for a multiplicative model. The disease-allele frequency is given by p (0.2, 0.3, or 0.4). A, ρ=0.4. B, ρ=0.8|i-j|. C, ρ is sampled from a uniform distribution between 0.3 and 0.7. The statistics TB, TP, TH, and Tw are denoted B, P, H, and W, respectively.
We performed further simulations based on the real LD pattern of the CHI3L2 gene (MIM 601256), which can be visualized on the HapMap site. We downloaded the genotype data for all SNPs in the CHI3L2 gene for 90 subjects from the HapMap database. We focused on the 22 SNPs with allele frequency >0.2. Each SNP was coded so that as many as possible of their pairwise correlations are positive. We arbitrarily assumed that the SNP located at the fifth position (rs2182114) is the functional mutation. We set RR=1.4, which, given the allele frequencies, resulted in a prevalence of 7.6%. We first simulated the genotypes of the mutation for 200 cases and 200 controls. To keep the real LD pattern, we then generated the genotypes for all other 21 SNPs by resampling from the 90 individuals with the same genotype at the mutation. We compared tests when the mutation was typed, when the mutation was not typed, and when only four tagging SNPs (tSNPs) (rs7366568, rs8535, rs2477574, and rs11102221) were typed. The empirical power of the tests for the real LD pattern is shown in figure 6. We found that the proposed test was the most powerful in all three cases. Because most of the SNPs in CHI3L2 are in strong LD, we found that the power of each of the statistics was quite similar, regardless of whether the mutation was typed. We also saw, for each of the statistics, that the use of tSNPs results in maximum or close-to-maximum power. This result shows that, when the extra information provided by additional SNPs is limited, because of the increased degrees-of-freedom typing, more SNPs do not necessarily improve power for either single-locus or multilocus analysis.
Figure 6. .

Empirical powers of different approaches for a multiplicative model based on the real LD pattern of CHI3L2. The statistics TB, TP, TH, and Tw are denoted B, P, H, and W, respectively.
Recognizing that disease-association information tends to extend over multiple SNPs in a block and that the local variation among trait groups is more likely to be noise, we have proposed a weighted score statistic based on the FT. The FT has been widely applied in electrical engineering—for example, for image processing. Applications of the FT include removal of noise by eliminating undesirable high- or low-frequency components and image compression. Here, we have applied the FT to compress the useful association information from the genotype values of a set of SNPs. We have demonstrated its usefulness in those cases, through simulation studies. Single-locus analysis is usually thought to lack power because of the lower capability of a SNP to predict a disease locus. Surprisingly, our simulation results show that the single-locus analysis is at least as good as a logistic regression analysis that simultaneously tests multiple SNPs, which is equivalent to Hotelling’s T2 test. A similar result was found by Roeder et al.11 The loss in power of logistic regression analysis or Hotelling’s T2 test becomes more obvious when the number of markers is large and the correlation between markers is strong, because the penalty in power from having a large number of degrees of freedom is severe in these cases. Our method has the advantages of both making use of multiple SNP information and having a small number of degrees of freedom. Therefore, we saw, in our simulations, that this method has power superior to that of the other two methods.
The proposed method, like any other method, has its limitations and is not optimal in all situations. Since our method greatly down-weights the contribution from high-frequency components, it should be expected to have low power in the case of an association signal that is not consistent across SNPs—for example, when a signal is dominant at a single SNP. It is expected that single-locus analysis will be most powerful in this scenario. Our method is similar in spirit to other methods that borrow information from neighboring correlated SNPs.12–15 When a single SNP itself has full association information, all such methods tend to smooth down the largest local signal, which leads to loss of power. The difference between our method and other methods is that they involve averaging of local association signals, whereas our method smooths the genotype values directly. It is feasible to choose a weight function from various functions for the proposed statistic, although we considered only one possibility in our simulations. We expect that there is no uniformly optimal weight function for all cases. Further work to develop a data-driven adaptive version of our method could be useful. One option is to use a threshold method to capture several informative dimensions that are not necessarily the low-frequency components. Another limitation of our method is that it does not account for high-order information included in the haplotypes. Although it has been shown that it is beneficial to jointly analyze genotype data because this reduces the degrees of freedom,7 the information from haplotypes becomes critical when the genetic effects of several mutations at different loci depend on whether they are in the cis or trans position. It is desirable to develop new methods, or to extend current methods, to compress all the information into a few dimensions.
In summary, we have developed a new weighted score statistic based on FT coefficients to globally test a set of correlated tSNPs (Weighted Score Statistic Web site). Our method can be used for either discrete or continuous traits. Our simulations have demonstrated its substantially higher power.
Acknowledgments
We thank the reviewers for their helpful comments, which improved the manuscript. This work was supported in part by U.S. Public Health Service resource grant RR03655 from the National Center for Research Resources, research grant GM28356 from the National Institute of General Medical Sciences, and cancer center support grant P30CAD43703 from the National Cancer Institute.
Web Resources
The URLs for data presented herein are as follows:
- HapMap, http://www.hapmap.org/
- Online Mendelian Inheritance in Man (OMIM), http://www.ncbi.nlm.nih.gov/Omim/ (for CHI3L2) [PubMed]
- Weighted Score Statistic, http://darwin.cwru.edu/~twang/wst
References
- 1.Daly MJ, Rioux JD, Schaffner SF, Hudson TJ, Lander ES (2001) High-resolution haplotype structure in the human genome. Nat Genet 29:229–232 10.1038/ng1001-229 [DOI] [PubMed] [Google Scholar]
- 2.Reich DE, Cargill M, Bolk S, Ireland J, Sabeti PC, Richter DJ, Lavery T, Kouyoumjian R, Farhadian SF, Ward R, et al (2001) Linkage disequilibrium in the human genome. Nature 411:199–204 10.1038/35075590 [DOI] [PubMed] [Google Scholar]
- 3.Crawford DC, Carlson CS, Rieder MJ, Carrington DP, Yi Q, Smith JD, Eberle MA, Kruglyak L, Nickerson DA (2004) Haplotype diversity across 100 candidate genes for inflammation, lipid metabolism, and blood pressure regulation in two populations. Am J Hum Genet 74:610–622 [DOI] [PMC free article] [PubMed] [Google Scholar]
- 4.Clayton D, Chapman J, Cooper J (2004) Use of unphased multilocus genotype data in indirect association studies. Genet Epidemiol 27:415–428 10.1002/gepi.20032 [DOI] [PubMed] [Google Scholar]
- 5.Excoffier L, Slatkin M (1995) Maximum-likelihood estimation of molecular haplotype frequencies in a diploid population. Mol Biol Evol 12:921–927 [DOI] [PubMed] [Google Scholar]
- 6.Tzeng JY, Devlin B, Roeder K, Wasserman L (2003) On the identification of disease mutations by the analysis of haplotype similarity and goodness of fit. Am J Hum Genet 72:891–902 [DOI] [PMC free article] [PubMed] [Google Scholar]
- 7.Chapman JM, Cooper JD, Todd JA, Clayton DG (2003) Detecting disease associations due to linkage disequilibrium using haplotype tags: a class of tests and the determinants of statistical power. Hum Hered 56:18–31 10.1159/000073729 [DOI] [PubMed] [Google Scholar]
- 8.Xiong M, Zhao J, Boerwinkle E (2002) Generalized T2 test for genome association studies. Am J Hum Genet 70:1257–1268 [DOI] [PMC free article] [PubMed] [Google Scholar]
- 9.Schaid DJ, Rowland CM, Tines DE, Jacobson RM, Poland GA (2002) Score tests for association between traits and haplotypes when linkage phase is ambiguous. Am J Hum Genet 70:425–434 [DOI] [PMC free article] [PubMed] [Google Scholar]
- 10.Prentice RL, Pyke R (1979) Logistic disease incidence models and case-control studies. Biometrika 66:403–411 10.2307/2335158 [DOI] [Google Scholar]
- 11.Roeder K, Bacanu SA, Sonpar V, Zhang X, Devlin B (2005) Analysis of single-locus tests to detect gene/disease associations. Genet Epidemiol 28:207–219 10.1002/gepi.20050 [DOI] [PubMed] [Google Scholar]
- 12.Lazzeroni LC (1998) Linkage disequilibrium and gene mapping: an empirical least-squares approach. Am J Hum Genet 62:159–170 [DOI] [PMC free article] [PubMed] [Google Scholar]
- 13.Cordell HJ, Elston RC (1999) Fieller’s theorem and linkage disequilibrium mapping. Genet Epidemiol 17:237–252 [DOI] [PubMed] [Google Scholar]
- 14.Conti DV, Witte JS (2003) Hierarchical modeling of linkage disequilibrium: genetic structure and spatial relations. Am J Hum Genet 72:351–363 [DOI] [PMC free article] [PubMed] [Google Scholar]
- 15.Zhang X, Roeder K, Wallstrom G, Devlin B (2003) Integration of association statistics over genomic regions using Bayesian adaptive regression splines. Hum Genomics 1:20–29 [DOI] [PMC free article] [PubMed] [Google Scholar]