Abstract
We have developed methods for studying the interactions between small molecules and RNA and have applied them to characterize the binding of three classes of aminoglycoside antibiotics to ribosomal RNA subdomains. High-resolution MS was used to quantitatively identify the noncovalent binding interactions between mixtures of aminoglycosides and multiple RNA targets simultaneously. Signal overlap among RNA targets was avoided by the addition of neutral mass tags that direct each RNA target to a unique region of the spectrum. In addition to determining binding affinities, the locations of the binding sites on the RNAs were identified from a protection pattern generated by fragmenting the aminoglycoside/RNA complex. Specific complexes were observed for the prokaryotic rRNA A-site subdomain with ribostamycin, paromomycin, and lividomycin, whereas apramycin preferentially formed a complex with the eukaryotic subdomain. We show that differences in binding between paromomycin and ribostamycin can be probed by using an MS–MS protection assay. We have introduced specific base substitutions in the RNA models and have measured their impact on binding affinity and selectivity. The binding of apramycin to the prokaryotic subdomain strongly depends on the identity of position 1408, as evidenced by the selective increase in affinity for an A1408G mutant. An A1409–G1491 mismatch pair in the prokaryotic subdomain enhanced the binding of tobramycin and bekanamycin. These observations demonstrate the power of MS-based methods to provide molecular insights into small molecule/RNA interactions useful in the design of selective new antimicrobial drugs.
Keywords: 16S RNA, 18S RNA, Fourier transform ion cyclotron resonance MS, aminoglycoside
The aminoglycoside antibiotics are potent inhibitors of protein synthesis and RNA splicing in vitro and in vivo (1–6). As the first class of compounds known to bind specifically to subdomains of larger RNA sequences, they are useful for understanding the design principles required to produce new classes of therapeutic agents to bind RNAs (7, 8). The best characterized aminoglycoside binding site is the decoding region of the small ribosomal subunit. The structures of paromomycin and gentamicin C1a complexes with a model RNA subdomain have been determined by using NMR (9–12). These aminoglycosides make hydrogen-bonding, electrostatic, and hydrophobic contacts that contribute to their high binding affinity for the RNA target.
We have developed methods that facilitate quantitative analysis of the binding characteristics of multiple aminoglycosides with a series of structural variants of the RNA to decipher further the molecular details of how different classes of aminoglycosides can discriminate among structurally related RNAs. We show that electrospray ionization MS (ESI-MS) has unique advantages for rapid characterization of RNA binding with aminoglycosides or any chemical or biological substrate. Mixtures of compounds can be screened in parallel with a high-resolution Fourier transform ion cyclotron resonance (FT-ICR) mass spectrometer, because the exact molecular mass of each ligand serves as a unique intrinsic label. Because ESI-MS measurements are performed from solutions of the RNA(s) and small molecules, the relative concentrations of the components and buffers can be adjusted to determine binding constants over a broad range of conditions (13–15). The location of binding has been ascertained with ESI-MS/MS protection experiments performed selectively on ions from the free RNA and the complex (16, 17). We also demonstrate that several RNA targets can be screened simultaneously against mixtures of molecules (18).
MATERIALS AND METHODS
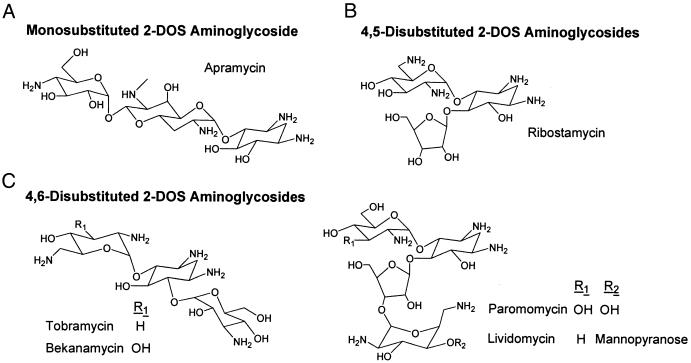
Aminoglycoside antibiotics shown in Fig. 1 (Sigma and ICN) were dissolved to generate 10 μM stock solutions. RNA constructs 16S and 18S and their analogs (Fig. 2) were prepared by using 2′-orthoester protection (Dharmacon Research, Boulder, CO) and precipitated twice from 10 M ammonium acetate after sequential deprotection with 0.2 M acetic acid and TRIS (pH 8.5). A (polyethylene glycol)6 chain was used as a neutral mass tag and attached to 18S via phosphoramidite coupling and oxidation (Dharmacon).
Figure 1.
Structures of 2-deoxystreptamine (2-DOS) aminoglycosides. (A) monosubstituted 2-DOS: apramycin. (B) 4,5-disubstituted 2-DOS: ribostamycin, paromomycin, and lividomycin. (C) 4,6-disubstituted 2-DOS: tobramycin and bekanamycin.
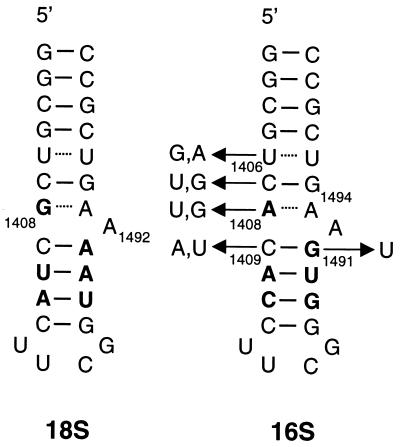
Figure 2.
Secondary structures and numbering system for the 27-base RNA models used in this work corresponding to the 18S (eukaryotic) and 16S (prokaryotic) A-sites. Base variations in mutants are indicated for each position.
All MS experiments were performed by using an Apex II 70e ESI-FT-ICR MS (Bruker Daltonics, Billerica, MA) with an actively shielded 7 tesla superconducting magnet. RNA solutions were prepared in 50 mM NH4OAc (pH 7), mixed with 10% isopropanol to aid desolvation, and infused at a rate of 1.5 μL/min by using a syringe pump. Ions were formed in a modified electrospray source (Analytica, Branford, CT) by using an off-axis grounded electrospray probe positioned ca. 1.5 cm from the metalized terminus of the glass desolvation capillary biased at 5,000 V. A countercurrent flow of dry oxygen gas heated to 150°C was used to assist in the desolvation process. Ions were accumulated in an external ion reservoir comprised of a radio frequency-only hexapole, a skimmer cone, and an auxiliary electrode for 1,000 ms before transfer into the trapped ion cell for mass analysis. Each spectrum was the result of the coaddition of 64 transients comprised of 524,288 data points acquired over a 217,391-kHz bandwidth, resulting in a 1.2-sec detection interval. All aspects of pulse sequence control, data acquisition, and postacquisition processing were performed by using a Bruker Daltonics data station running xmass Version 4.0 on a Silicon Graphics (Mountain View, CA) R5000 computer.
The 16S and C1409A 16S RNAs were prepared with single deoxyribose residues present at the indicated positions, and these 10 samples were mixed before analysis. RNA and RNA–aminoglycoside complexes were dissociated via application of a 20-msec pulse from a 33-W CO2 laser (Synrad, Bothel, WA). The laser power was adjusted to maximize the fragment ion signals from the primary dissociation pathways and to minimize multiple fragmentation events. Fragment ion abundances were assigned if the measured m/z was within 15 mDa of the calculated values and the signal-to-noise ratio was >3:1. The abundances of w, a-B, y, and c-H fragment ions were measured, summed for each position, and normalized to the abundances of the c2-H and y2 ions. Results from two independent experiments were averaged in each case.
RESULTS AND DISCUSSION
MS has considerable potential for monitoring complex formation between mixtures of small molecules and targets based solely on accurate measurement of differences in exact molecular mass. We demonstrate a rapid MS-based parallel screening strategy for a series of RNA models corresponding to natural and mutated prokaryotic and eukaryotic decoding sites and six aminoglycoside antibiotics. As shown in Fig. 1, aminoglycosides have been selected from three classes: monosubstituted 2-deoxystreptamines (apramycin), 4,5-disubstituted 2-deoxystreptamines (ribostamycin, paromomycin, and lividomycin), and 4,6-disubstituted 2-deoxystreptamines (tobramycin and bekanamycin). Fig. 2 illustrates the secondary structures for the 27-nt models (19) of the 16S and 18S rRNA decoding sites (16S and 18S) (9, 19, 20). These constructs consist of a 7-bp stem structure containing a noncanonical U-U, a purine-adenosine mismatch bp adjacent to a bulged adenosine residue, and a stem closed by a UUCG tetraloop. The masses for the two RNA models differ by only 15.011 Da and mass spectra from a solution containing both RNAs are complicated by overlap among the signals from free RNA ions and their sodium and potassium-adducted species (data not shown).
Mass Tags. To separate signals from 16S and 18S, we added an uncharged polyethylene chain at their 5′-termini (neutral mass tag) (18). The shifts in masses and concomitant m/z move the family of signals produced by the tagged RNA into a different region of the mass spectrum. The mass tag had no appreciable effect on RNA solubility, ionization efficiency, or UV absorbance, and did not alter ligand binding, as evidenced by the conserved ratio of free:bound RNA for untagged and tagged 16S under competitive binding conditions for paromomycin (data not shown). We anticipate the mass tag strategy can be used to multiplex up to 10 RNA targets in the same assay.
The identities of each RNA and ligand in a solution are defined unambiguously by their chemical formulas and can be ascertained by accurate measurement of the mass by using FT-ICR MS. Because ESI propagates the solution distribution of free and complexed RNAs into the mass analyzer, solution dissociation constants can be measured from integration of the observed ion abundances for free and complexed RNAs as a function of ligand concentration (21, 22). In addition, the site of binding can be determined via MS/MS measurement of differences in the induced dissociation of free RNA and RNA-aminoglycoside ions. We have investigated the binding affinities for the aminoglycoside set with a series of variants with base substitutions in the A-site RNA.
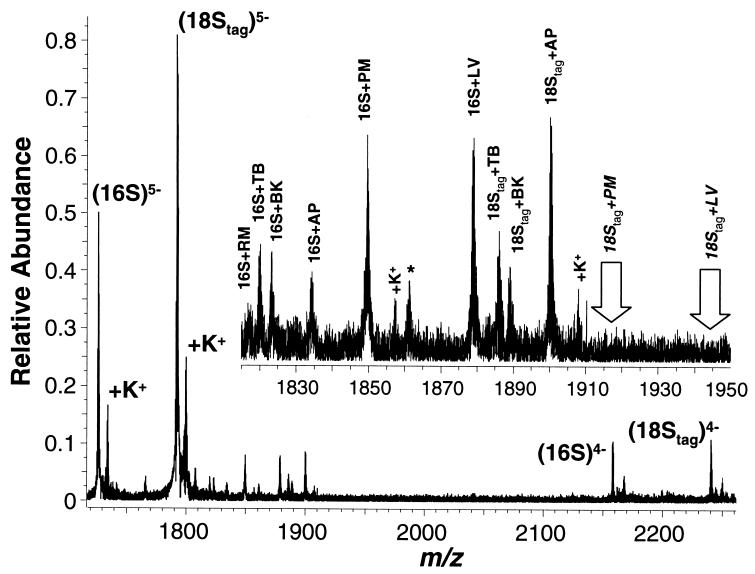
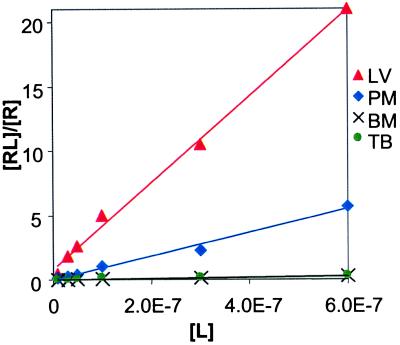
Aminoglycoside Binding to rRNA Models. The ESI-FT-ICR mass spectrum in Fig. 3 was acquired under noncompetitive binding conditions from a 5 μM mixture of untagged 16S and mass-tagged 18S with an equimolar mixture of six aminoglycosides present at 0.5 μM each. Complexes corresponding to a 1:1 binding of individual aminoglycosides are observed between 16S and all members of the aminoglycoside mixture. The relative affinities range from well below 500 nM (complete binding) to near 500 nM (partial binding) to well above 500 nM (little binding), as estimated from the abundances of ions for the respective complexes. Under these conditions, signal intensities from the complexes with paromomycin (m/z 1849.047) and lividomycin (m/z 1878.260) are consistent with complete binding, as expected for compounds with MS-measured dissociation constants of 110 nM and 28 ± 2 nM, respectively (Fig. 4 and Table 1). The intensities of 16S complexes with tobramycin (m/z 1819.445), bekanamycin (m/z 1822.644), and apramycin (m/z 1834.044) are lower, consistent with the MS and solution dissociation constants of ≈1.5–3 μM (11). Smaller signals from the complex with ribostamycin can be observed at m/z 1816.839, with a measured Kd of 16 ± 1.5 μM. Hence, under these assay conditions, the relative ion abundances observed with MS can be used to estimate the solution dissociation constants.
Figure 3.
Mass spectrum of RNAs 16S and 18S with a library of six aminoglycosides: apramycin (AP), ribostamycin (RM), tobramycin (TB), bekanamycin (BK), paromomycin (PM), and lividomycin (LV). Signals from free 16S and 18S are indicated with their respective charge states. Peaks marked * correspond to instrument noise, whereas peaks marked +K+ are generated by the potassium-adducted ions of each species. The region of the spectrum between m/z 1820 and 1950 containing the [M-5H]5- ions from the complexes has been expanded (Inset).
Figure 4.
Plot of (Complexed 16S)/(Free 16S) vs. aminoglycoside concentration for a mixture of paromomycin, lividomycin, tobramycin, and bekanamycin measured by using ESI-FT-ICR MS. Kd values were determined from the inverse of the slope for each line and have R2>0.95. Ribostamycin did not form a complex with 16S to an appreciable extent over this concentration range.
Table 1.
Calculated dissociation constants (μM) for aminoglycosides with variants of 16S
| Variation | Ribostamycin | Paromomycin | Lividomycin | Apramycin | Tobramycin | Bekanamycin |
|---|---|---|---|---|---|---|
| 16S | 16 ± 1.5 | 0.11 ± 0.01 | 0.03 ± 0.002 | 2 ± 0.20 | 2 ± 0.22 | 2 ± 0.2 |
| 18S | >20 | >20 | >20 | 0.5 | 1.4 | 1.6 |
| A1408G | 16 | 0.7 | 0.2 | 0.5 | 2 | 2 |
| A1408U | 4 | 0.7 | 0.7 | 2 | 2 | 2 |
| C1409A | >20 | >20 | >20 | 1.2 | 0.4 | 0.25 |
| C1409U | >20 | 1.1 | 0.4 | 2 | >20 | >20 |
| C1409A G1491U | >20 | 1.2 | 0.4 | 2 | 2 | 2 |
| C1491U | >20 | 2 | 2 | 2 | 2 | 2 |
The differences in affinity of ribostamycin, paromomycin, and lividomycin for 16S are interesting. These data show that lividomycin binds to the A-site subdomain similar to paromomycin, despite two significant structural differences. Lividomycin lacks a hydroxyl group on ring I that directly contacts A1492, and the orientation of paromomycin ring IV is disordered in the NMR-derived structure for the complex with 16S. The 4-fold increase in binding affinity relative to paromomycin is consistent with the generation of additional contacts between ring V and 16S that stabilize the complex.
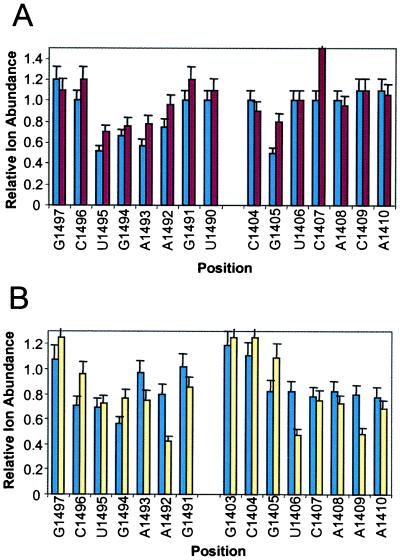
The origin of the lower affinity of ribostamycin for 16S has been studied by using an MS/MS protection assay. The phosphate–sugar linkages in nucleic acids are susceptible to gas-phase cleavage relative to peptide bonds, for example (16). The internal ion energy required to induce fragmentation of the RNA chain does not dissociate the aminoglycoside–RNA complexes. Binding of paromomycin to 16S provides strong protection of residues G1405, U1495, and A1493 from infrared multiphoton dissociation (Fig. 5A) (17). These results are consistent with NMR observations where aminoglycoside binding induces a conformational shift that stabilizes A1408, A1492, and A1493 (12). In the NMR structure, an amine of the 2-DOS ring contacts U1495, and an amine of ring IV contacts the 3′-phosphate of G1405. Ribostamycin, with no ring IV, offers no protection to G1405 in the assay. Protection of residues 1492–1495 on the 3′-strand are reduced. The enhanced fragmentation at C1407 relative to free RNA suggests a difference in structure or local conformational dynamics in the ribostamycin complex. The loss of a specific contact and change in RNA structure is consistent with the 100-fold reduction in affinity of 16S for ribostamycin relative to paromomycin.
Figure 5.
MS-based protection assay to determine the binding sites of aminoglycosides for RNAs. (A) Relative fragment ion abundances for 16S complexes with paromomycin (blue) and ribostamycin (red) vs. free 16S as a function of nucleotide position. (B) Relative fragment ion abundances for C1409A 16S complexes with paromomycin (yellow) and tobramycin (blue) vs. free C1409A 16S as a function of nucleotide position.
Complexes are observed between three of the aminoglycosides and 18S. Tobramycin and bekanamycin generate weaker complexes in the 1–2 μM range. The comparable affinities of these 4,6-disubstituted 2-DOS compounds for both RNAs suggest that the binding is less specific than that observed between 16S and the 4,5-disubstituted 2-DOS compounds paromomycin and lividomycin. Perhaps the most striking feature of the spectrum in Fig. 3 is the absence of complexes between 18S and ribostamycin, paromomycin, or lividomycin. Reduced activity of the 4,5-disubstituted 2-DOS class of aminoglycoside has been observed in mutant Escherichia coli, where the C1409-G1491 bp has been changed to C1409-A1491, analogous to the mismatch found in 18S (23). In contrast, the monosubstituted 2-DOS apramycin binds 18S with high affinity, with a Kd of 500 ± 50 nM determined by using MS. The Kd for 16S is ≈4-fold weaker. Binding of apramycin to 18S protects residues G1408, A1492, and A1493 from cleavage in the MS/MS experiment, similar to the pattern of protection for 16S produced by paromomycin binding (16). The noncanonical C1409-A1491 bp in 18S may shift A1491 toward the major groove (24). This shift would introduce a number of unfavorable steric contacts with ring I of the 4,5 and 4,6-substituted 2-DOS aminoglycosides and might disrupt other specific hydrogen bond interactions.
Aminoglycoside Binding to Mutant rRNA Models. We have investigated the binding affinities of the aminoglycosides for 16S and variants where A1408 and C1409 have been replaced by G and U or A and U, respectively, to generate mismatched bp. As listed in Table 1, apramycin binds with high affinity to the A1408G mutant, whereas paromomycin and lividomycin do not bind as tightly relative to the wild-type RNA. The affinities of tobramycin and bekanamycin are unchanged with respect to the wild-type RNA. Hence, the identity of the 1408 residue is also a determinant of binding specificity and provides discrimination between the monosubstituted and disubstituted 2-DOS aminoglycosides.
A C1409A mutant that generates an A–G mismatch pair reduces the affinity of the 4,5-disubstituted 2-DOS derivatives by >100-fold and increases the affinity of tobramycin and bekanamycin by 5- and 10-fold, respectively. The binding contacts between paromomycin, tobramycin, and the C1409A RNA have been examined by using the MS/MS protection assay (Fig. 5B). Paromomycin loses the important direct contact with G1405 but provides new protection for U1406–A1410 on the opposite strand relative to wild-type RNA. In addition, protection for U1495 and A1493 are reduced relative to A1492, consistent with a different set of contacts or a change in the structure of the complex. Tobramycin provides more specific protection for G1494 and A1492, consistent with direct contacts with the 2-DOS ring in the mutant. The change in binding affinities may result from alterations in the structure of the mutant RNA complexes or generation of fewer stable interactions in the case of paromomycin. The distortion and widening of the major groove induced by an A–G purine mismatch pair may facilitate binding of the wider 4,6-disubstituted 2-DOS derivatives while reducing the affinity provided by specific contacts between the 4,5-disubstituted 2-DOS derivatives and the control RNA.
Incorporation of a U1409–G1491 wobble pair alters the geometry of the major groove in a very different way. The affinities of the 4,5-disubstituted compounds are reduced 5- to 10-fold, and the 4,6-disubstituted compounds also bind very poorly. The affinity of apramycin, which binds tightly to 18S with a C1409–A1491 pair, is not enhanced by the U1409–G1491 bp (2). A canonical A1409–U1491 bp reduces the affinity of paromomycin and lividomycin, possibly through loss of two specific hydrogen bonding contacts rather than steric exclusion. Incorporation of a C1409-U1491 pyrimidine mismatch does not enhance the binding of any of the aminoglycosides and greatly reduces the affinity of paromomycin and lividomycin. This result is consistent with observations that incorporation of a C1409-U1491 bp reduced the antimicrobial activity of the 4,5-disubstituted 2-DOS compounds 32-fold (2, 23).
CONCLUSIONS
FT-ICR MS has been used to rapidly characterize complexes formed from mixtures of aminoglycosides and multiple RNA targets under competitive or noncompetitive binding conditions. The signals from RNA targets with similar molecular masses have been dispersed by using neutral mass tags. Screening multiple compounds against RNA mixtures simultaneously multiplexes the information content of the assay, resulting in a dramatic reduction in the number of analyses required and greater precision, because comparisons can be made within experiments. We have exploited this capability to measure the binding constants for six aminoglycosides with eight RNA subdomain variants of the ribosomal A-site. Significant differences in binding affinity and specificity have been observed between three classes of aminoglycosides and the variant subdomains. The site of ligand binding also is determined by using a MS-based protection assay on the basis of differences in patterns of gas-phase fragmentation for the free RNA and their aminoglycoside complexes. The results show that single base substitutions at positions 1408 and 1409 can produce changes in the conformation of the RNA sufficient for binding discrimination between three classes of 2-DOS aminoglycosides. This versatile MS methodology is suited to studies of RNA interactions with other biological molecules and currently is being used to discover new classes of compounds that bind to the prokaryotic decoding site with high affinity and specificity.
Acknowledgments
We thank Stephen Scaringe for his help with RNA synthesis. This work was supported in part by the Department of Commerce through a National Institute of Standards and Technology Advanced Technology Program grant (97-01-0135) awarded to the Ibis Therapeutics Division of Isis Pharmaceuticals, and a grant from the Defense Advanced Projects Research Agency (BAA 98-25-544).
ABBREVIATIONS
- ESI-MS
electrospray ionization MS
- FT-ICR MS
Fourier transform ion cyclotron resonance MS
References
- 1.Moaezed D, Noller H F. Nature (London) 1987;327:389–394. doi: 10.1038/327389a0. [DOI] [PubMed] [Google Scholar]
- 2.De Stasio E A, Moazed D, Noller H F, Dahlberg A E. EMBO J. 1989;8:1213–1216. doi: 10.1002/j.1460-2075.1989.tb03494.x. [DOI] [PMC free article] [PubMed] [Google Scholar]
- 3.Wallis M G, Schroeder R. Prog Biophys Mol Biol. 1997;67:141–154. doi: 10.1016/s0079-6107(97)00011-4. [DOI] [PubMed] [Google Scholar]
- 4.Wank H, Schroeder R. J Mol Biol. 1996;258:53–61. doi: 10.1006/jmbi.1996.0233. [DOI] [PubMed] [Google Scholar]
- 5.Hoch I, Berens C, Westhof E, Schroeder R. J Mol Biol. 1998;282:557–569. doi: 10.1006/jmbi.1998.2035. [DOI] [PubMed] [Google Scholar]
- 6.Hermann T, Westhof E, Tor Y. Chem Biol. 1998;5:R277–R283. doi: 10.1016/s1074-5521(98)90286-1. [DOI] [PubMed] [Google Scholar]
- 7.Park W K C, Auer M, Jaksche H, Wong C-H. J Am Chem Soc. 1996;118:10150–10155. [Google Scholar]
- 8.Wong C-H, Hendrix M, Manning D D, Rosenbohm C, Greenberg W A. J Am Chem Soc. 1998;120:8319–8327. [Google Scholar]
- 9.Fourmy D, Recht M I, Puglisi J D. J Mol Biol. 1998;277:347–362. doi: 10.1006/jmbi.1997.1552. [DOI] [PubMed] [Google Scholar]
- 10.Fourmy D, Recht M I, Blanchard S C, Puglisi J D. Science. 1996;274:1367–1371. doi: 10.1126/science.274.5291.1367. [DOI] [PubMed] [Google Scholar]
- 11.Wang Y, Hamasaki K, Rando R R. Biochemistry. 1997;36:768–779. doi: 10.1021/bi962095g. [DOI] [PubMed] [Google Scholar]
- 12.Fourmy D, Yoshizawa S, Puglisi J D. J Mol Biol. 1998;277:333–345. doi: 10.1006/jmbi.1997.1551. [DOI] [PubMed] [Google Scholar]
- 13.Bruce J E, Anderson G A, Chen R, Cheng X, Gale D C, Hofstadler S A, Schwartz B L, Smith R D. Rapid Commun Mass Spectrom. 1995;9:644–650. doi: 10.1002/rcm.1290090805. [DOI] [PubMed] [Google Scholar]
- 14.Cheng X, Chen R, Bruce J E, Schwartz B L, Anderson G A, Hofstadler S A, Gale D C, Smith R D, Gao J, Sigal G B, et al. J Am Chem Soc. 1995;117:8859–8860. [Google Scholar]
- 15.Gao J, Cheng X, Chen R, Sigal G B, Bruce J E, Schwartz B L, Hofstadler S A, Anderson G A, Smith R D, Whitesides G M. J Med Chem. 1996;39:1949–1955. doi: 10.1021/jm960013g. [DOI] [PubMed] [Google Scholar]
- 16.Hofstadler S A, Griffey R H, Pasa-Tolic L, Smith R D. Rapid Commun Mass Spectrom. 1998;12:1400–1404. [Google Scholar]
- 17.Griffey R H, Greig M J, An H, Sasmor H, Manalili S. J Am Chem Soc. 1999;121:474–475. [Google Scholar]
- 18.Hofstadler, S. A., Sannes-Lowery, K., Crooke, S. T., Ecker, D. J., Sasmor, H., Manalili, S. L. & Griffey, R. H. (1999) Anal. Chem.70, in press. [DOI] [PubMed]
- 19.Stern S, Purohit P. Biochem Cell Biol. 1995;73:899–905. doi: 10.1139/o95-097. [DOI] [PubMed] [Google Scholar]
- 20.Purohit P, Stern S. Nature (London) 1994;370:659–662. doi: 10.1038/370659a0. [DOI] [PubMed] [Google Scholar]
- 21.Loo J A. Mass Spectrom Rev. 1997;16:1–23. doi: 10.1002/(SICI)1098-2787(1997)16:1<1::AID-MAS1>3.0.CO;2-L. [DOI] [PubMed] [Google Scholar]
- 22.Greig M J, Gaus H, Cummins L L, Sasmor H, Griffey R H. J Am Chem Soc. 1995;117:10765–10766. [Google Scholar]
- 23.DeStasio E A, Dahlberg A E. J Mol Biol. 1990;212:127–133. doi: 10.1016/0022-2836(90)90309-A. [DOI] [PubMed] [Google Scholar]
- 24.Zimmerman G R, Shields T P, Jenison R D, Wick C L, Pardi A. Biochemistry. 1998;37:9186–9192. doi: 10.1021/bi980082s. [DOI] [PubMed] [Google Scholar]


