Abstract
Insertion analysis of short and long interspersed elements is a powerful method for phylogenetic inference. In a previous study of short interspersed element data, it was found that cetaceans, hippopotamuses, and ruminants form a monophyletic group. To further resolve the relationships among these taxa, we now have isolated and characterized 10 additional loci. A phylogenetic analysis of these data was able to resolve relationships among the major cetartiodactyl groups, thereby shedding light on the origin of whales. The results indicated (i) that cetaceans are deeply nested within Artiodactyla, (ii) that cetaceans and hippopotamuses form a monophyletic group, (iii) that pigs and peccaries form a monophyletic group to the exclusion of hippopotamuses, (iv) that chevrotains diverged first among ruminants, and (v) that camels diverged first among cetartiodactyls. These findings lead us to conclude that cetaceans evolved from an immediate artiodactyl, not mesonychian, ancestor.
The evolutionary origin of whales and the subsequent remarkable transformation that led to their adaptation to a fully aquatic existence are issues that biologists have been eager to resolve (1–16). Recent palaeontological (1–4), morphological (5, 6), and molecular (7–16) studies have suggested that the order Cetacea (whales, dolphins, and porpoises) might be more closely related to the order Artiodactyla (cows, camels, and pigs) than to other orders of ungulates, such as Perissodactyla (horses), Hyracoidea (hyraxes), Proboscidea (elephants), and Sirenia (sea cows). Based on morphological evidence, the order Artiodactyla is considered to be monophyletic and traditionally has been divided into three suborders: Ruminantia (chevrotains, deer, giraffes, cows, etc.), Tylopoda (camels and llamas), and Suiformes (pigs, peccaries, and hippopotamuses). However, recent studies using mitochondrial and nuclear DNA sequence data have challenged the previously accepted monophyly of Artiodactyla. Graur and Higgins (8) proposed a Ruminantia/Cetacea clade to the exclusion of Suiformes. Unfortunately, those authors were not able to sample a hippopotamid species; had they been able to do so, their results might have been different. For instance, Irwin and Arnason (9) and Gatesy et al. (11) found evidence that the Hippopotamidae, which traditionally are classified within Suiformes, cluster with Cetacea. A monophyletic Cetacea + Hippopotamidae clade was further supported by phylogenetic analyses of gamma-fibrinogen sequence data (14) and complete mitochondrial genome sequences (16). Thus, a changing view of the evolution of Artiodactyla and Cetacea is emerging based on molecular data, but the picture is by no means clear because of insufficient statistical support.
The purpose of this study was to attempt to resolve the issues of artiodactyl and cetacean relationships by using a totally different approach: analysis of SINE (short interspersed element; refs. 15 and 17–21) and LINE (long interspersed element; refs. 22 and 23) insertion events. SINEs and LINEs are mobile genetic elements that have been amplified and integrated into a host genome by retroposition, which is the integration of a reverse-transcribed copy of an RNA (17, 21, 24, 25), so SINEs and LINEs can be classified as retroposons. As a consequence of the replicative mechanism of retroposons, the integration of a SINE or LINE at a new locus is an irreversible event. This feature of SINEs and LINEs make them excellent tools for the determination of phylogenetic relationships (15, 17–21). Here, we provide another example of the remarkable power that SINEs and LINEs possess in that regard.
MATERIALS AND METHODS
Loci.
Of the 10 loci described herein, M11, KM14, and HIPs (HIP4, HIP5, and HIP24) were newly isolated by cloning and sequencing from genomic libraries of the minke whale (Balaenoptera acutorostrata), the sperm whale (Physeter macrocephalus), and the hippopotamus (Hippopotamus amphibius), respectively. The AF locus (accession no. AF039722), the Fas locus (accession no. U34794), the gpi locus (accession no. Z28396), the pro locus (accession no. X89718), and part of the sequence of the INO locus (accession no. Z54204) were identified from the GenBank database. PCR and other experimental procedures were performed by standard techniques (26–29). Sequence information for primers is available on request.
Protocol for SINE/LINE Characterization and Insertion Analysis. New SINE or LINE families are characterized. The newly characterized SINEs from the whale genome, designated CHR-1 and CHR-2, are used herein as an example. These SINEs are distributed exclusively in the genomes of whales, hippopotamuses, and ruminants (15).
DNA clones are screened from a genomic library for the presence of the given SINE unit by using either the CHR-1 or CHR-2 sequence as a probe.
Positively hybridizing clones are identified and sequenced. Primers nested in the flanking sequence of the particular SINE unit are designed.
PCR amplification is conducted followed by electrophoretic visualization of size dimorphic bands [fragments possessing (SINE-plus) or lacking (SINE-minus) target SINE inserts].
Southern hybridization of a blot of the PCR gel is performed by using a sequence unit of the given SINE to confirm its presence in the SINE-plus PCR band.
Southern hybridization of the same blot using the SINE flanking sequences then is performed to confirm that the orthologous locus of each species had been amplified faithfully.
Final confirmation of the presence or the absence of the SINE in the locus is obtained by sequencing.
Interpretation of the SINE/LINE Results. Copies of the same SINE shared in a unique locus of two different taxa are assumed to be derived from the same initial insertion event in the germ line of a common ancestor, thereby defining monophyletic groups (21).
Taxa lacking SINE insertions for the same locus (SINE-minus bands) are assumed to retain the ancestral condition (21).
Phylogenetic Analysis.
In this study, the retroposon insertion data (Figs. 1, 4, and 6, and ref. 15) were organized into a transformation series, where the absence of a retroposon at a particular locus was coded as 0 and the presence of a retroposon at that same locus was coded as 1. In cases where a PCR amplification band was not visible, the character state was coded as missing (denoted by ?). Characters were treated as irreversible because once a retroposon has been integrated into a host genome, the probability of loss is extremely small (17–21). The computer program paup* (30) was used to reconstruct phylogenetic relationships among taxa by using the branch and bound search algorithm. Because the absence of a SINE element was assumed to be primitive, outgroup analysis was not performed to determine character state polarity. Provided that this assumption holds true, it is valid that the use of an outgroup taxon is not required to root the resultant phylogeny (21).
Figure 1.
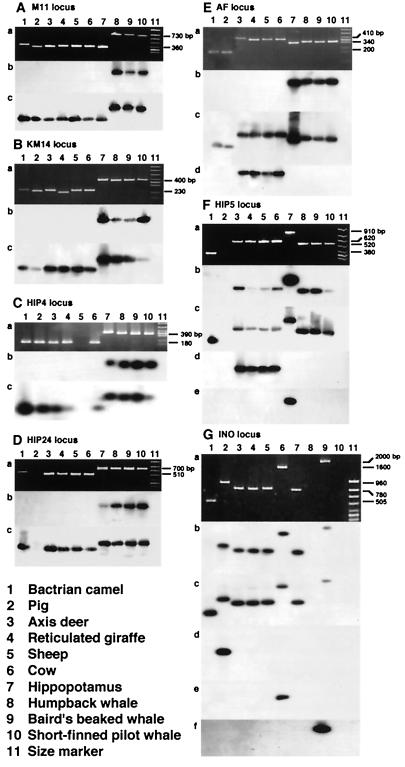
Analysis of the seven loci at which a SINE or a LINE was inserted during the evolution of Cetartiodactyla. (A-G) Data for the loci M11, KM14, HIP4, HIP24, AF, HIP5, and INO. Shown are (a) products of PCR and (b) and (c) the results of hybridization experiments using the SINE (or LINE) unit and the flanking sequence as probes, respectively. The results of hybridization with different retroposon probes are shown in d-f. The probes used were: Ed, MER; Fd, Bov-A; Fe, CHR-2; Gd, ARE; Ge, Bov-B LINE; and Gf, LINE1.
Figure 4.
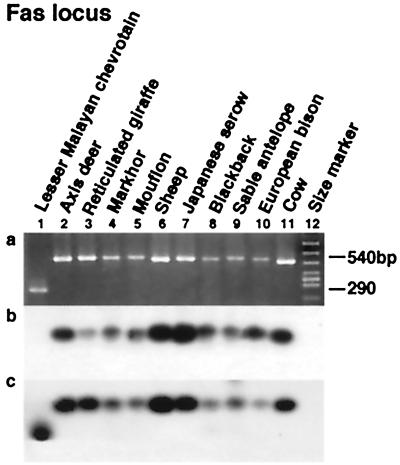
Chevrotains diverged first among ruminants. For the Fas locus, a shows the PCR products, while the results of hybridization experiments using the Bov-A2 unit and the flanking sequence as probes are given in b and c, respectively.
Figure 6.
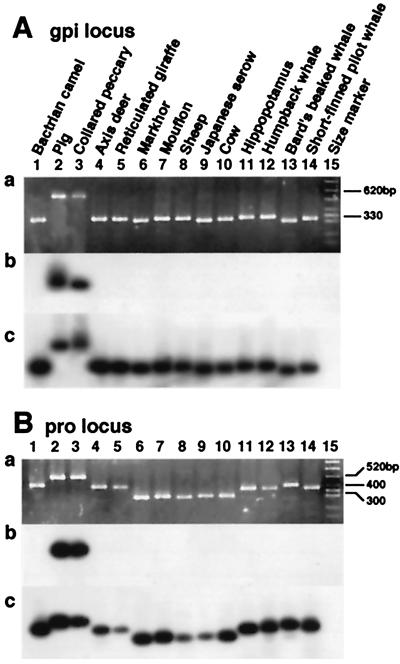
Monophyly of the pig + peccary clade. For both the gpi (A) and pro (B) loci, a shows the PCR product, while the results of the hybridization experiments using the ARE unit and the flanking sequences as probes are given in b and c, respectively.
RESULTS
Monophyly of Cetacea.
The M11 locus provides a good example of retroposon insertion analysis (Fig. 1A). Primers were synthesized for the flanking regions of the given SINE at this locus, and PCR then was performed. The pattern of products is shown in Fig. 1Aa, indicating that the CHR-2 SINE (15) was inserted into a common ancestor of cetaceans. This interpretation was confirmed by hybridization experiments with the SINE sequence (Fig. 1Ab). In addition, hybridization with the flanking sequence confirmed that the orthologous locus within each species had been amplified faithfully (Fig. 1Ac). The presence of the SINE unit in longer fragments of about 730 bp in cetaceans (Fig. 1A, lanes 8–10) and the absence of the SINE unit in shorter fragments of about 360 bp in artiodactyls (Fig. 1A, lanes 1–7) was confirmed by sequencing (data not shown). These data, together with the previously characterized Pm52 and Pm72 loci (15), unambiguously demonstrate that Cetacea, which includes Odontoceti (toothed whales) and Mysticeti (baleen whales), is monophyletic.
Hippopotamuses Are the Closest Extant Relatives of Whales.
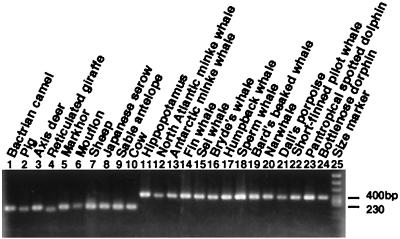
Analysis of the KM14 (Fig. 1B), HIP4 (Fig. 1C), HIP24 (Fig. 1D), and AF loci (Fig. 1E) show that hippopotamuses and cetaceans form a monophyletic group that excludes ruminants. In each case, the CHR-1 SINE (15) was inserted into the genome of a common ancestor of these species, as confirmed by hybridization experiments with probes specific for CHR-1 and its flanking region (Fig. 1 B-E b and c). Taxon sampling does not appear to have an effect (e.g., locus KM14; Fig. 2), as the results did not change when more species were included. The presence of the CHR-1 SINE in cetaceans and hippopotamus and its absence in ruminants was confirmed by sequencing; the results for the KM14 locus are shown in Fig. 3. The AF locus illustrates two independent retropositional events, namely, insertions of the CHR-1 SINE and of MERs (medium reiteration frequency families; ref. 31; Fig. 1E). MER has not yet been fully characterized, but our data suggest that it is a retroposon. As a result of independent and differential insertion events of MER and CHR-1, the lengths of PCR products were very similar in the cetacean, hippopotamus, and ruminant lineages (Fig. 1Ea). On closer examination, it was revealed that the CHR-1 SINE was integrated into a common ancestor of hippopotamuses and whales (Fig. 1E) (indicating a sister-group relationship between these taxa), whereas a MER unit was integrated into the genome of a common ancestor of ruminants only (Fig. 1Ed).
Figure 2.
Clustering of whales and hippopotamuses at the KM14 locus.
Figure 3.
An alignment of sequences at the KM14 locus. Dots and bars stand for identical nucleotides and deletions, respectively. Thick bars represent sites that correspond to primers, thin boxes represent direct repeats, and thick boxes represent a CHR-1 SINE.
Monophyly of Ruminants, Hippopotamuses, and Cetaceans.
Analysis of the HIP5 locus illustrates a complex series of retropositional events during the evolution of artiodactyls and cetaceans (Fig. 1F). Lanes 3–10 of Fig. 1 Fa and Fb reveal the presence of CHR-1 in the genomes of ruminants, hippopotamuses and cetaceans. However, there is no band in the lane representing the pig (Fig. 1F, lane 2). Accordingly, we do not know whether this SINE is present or absent at this locus in pig based on the present data. Therefore, two interpretations are possible: (i) CHR-1 was integrated into a common ancestor of ruminants, hippopotamuses, and cetaceans, or (ii) the same SINE was integrated into the genome of a common ancestor of these species and pigs (compare Fig. 1F b with c). It is not clear which scenario is more probable. However, the former case seems more plausible because no CHR-1 SINEs have been detected in the pig genome (15, 32). After insertion of a CHR-1 SINE at the HIP5 locus, a Bov-A unit (short repetitive elements derived from Bov-B LINE; refs. 32 and 33) was integrated into a common ancestor of ruminants (Fig. 1Fd), and the CHR-2 SINE was integrated into the hippopotamus lineage only (Fig. 1Fe). As an additional note, the monophyly of ruminants, hippopotamuses, and cetaceans was unambiguously confirmed by analysis of two previously characterized loci, Gm5 and aaa792 (15).
Chevrotains Form the Basal Ruminant Clade.
The newly characterized Fas locus indicated that pecorans (horned ruminants) are monophyletic, because a unit of Bov-A2 (32, 33) was integrated into a common ancestor of these species after the divergence of chevrotains (which are hornless) (Fig. 4). Therefore, the Fas locus together with the aaa792 locus that was previously reported (15) demonstrate that chevrotains diverged first among ruminants.
Utility of LINEs: Camels Form the Basal Cetartiodactyl Lineage.
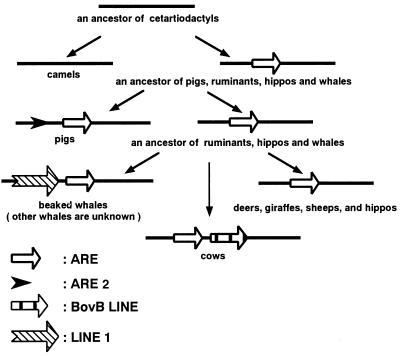
Integration of different retroposons classes at the INO locus (albeit at different nucleotide positions) is responsible for the fact that bands for pigs, cows, and beaked whales migrated more slowly than other bands. A schematic representation of the series of retropositional events is given in Fig. 5. More interestingly, an artiodactyla repetitive element (ARE) (34) is present at the INO locus in the genomes of pigs, ruminants, hippopotamuses, and cetaceans, indicating their monophyly to the exclusion of camels (compare Fig. 1G b with c). ARE elements recently have been characterized as fragments of the 3′ untranslated region of the LINE1 subfamily present in cetartiodactyl genomes (M.N. and N.O., unpublished results). Because relatively few SINEs are shared among pig, ruminant, hippopotamus, and cetacean genomes (32), it follows that the monophyly of this clade might be supported only by the presence of certain LINE families that are ubiquitous among cetartiodactyl genomes. Another ARE unit (designated ARE2 in Figs. 5 and 7) also was integrated into the pig lineage (Fig. 1Gd) and a fragment of the Bov-B LINE was integrated in the cow lineage (Fig. 1Ge). Furthermore, a fragment of yet another LINE family appears to have integrated into the lineage of beaked whales only (Fig. 1Gf), although bands were missing in lanes of humpback whale and short-finned pilot whale, preventing the formulation of concrete conclusions. This series of retropositional events is schematically represented in Fig. 4. The monophyly of pigs and peccaries (Fig. 6 A and B) also was supported by LINE insertion analysis, where a unit of ARE was integrated in a common ancestor of pigs and peccaries at the gpi and pro loci. However, in the case of the pro locus, the pattern of PCR products became rather complex because of the deletion of 70 nt in a common ancestor of Bovidae (Fig. 6B, lanes 6–10). Because a unit of ARE was integrated only into the lineage of pigs, but not in the lineage of peccaries, in the case of the INO locus (Fig. 1Gd and data not shown), the gpi and pro loci are the first to show the monophyly of pigs and peccaries by retroposon insertion analysis.
Figure 5.
Schematic representation of retropositional events at the INO locus.
Figure 7.
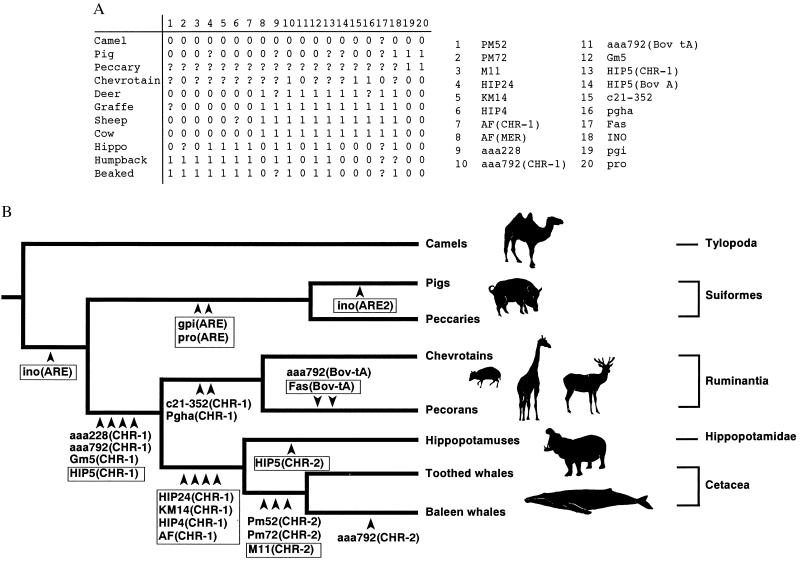
Phylogenetic relationships among the major cetartiodactyl subgroups. (A) Data matrix showing the character states for each of the loci including those reported previously (15). The 20 retropositional events were analyzed and used to generate the phylogeny shown in B. 0 = absence; 1 = presence; ? = missing. (B) All insertion sites of SINEs and LINEs characterized to date are mapped on the phylogeny inferred from these data. Boxed loci indicate those loci discussed at length in this report, and the specific retroposon unit inserted at each locus is given in parentheses. The homoplasy index was 0.0, whereas the consistency, retention, and rescaled consistency indices were 1.0 for this tree, which was 20 steps in length (where each step represents an insertion event).
Phylogenetic Analysis. In the present study, we isolated 10 genomic loci and characterized 16 independent retropositional events that occurred during the evolution of cetartiodactyls (35). Using all loci characterized to date including those obtained from our previous study (15), we constructed a transformation series, or data matrix (Fig. 7A), in which the 20 informative retropositional events were included. From this analysis, the single most parsimonious tree was generated (Fig. 7B). Consistency, rescaled consistency, and retention indices of 1.0 and a homoplasy index of 0.0 were obtained for this tree.
The phylogenetic position of cetaceans with respect to the other primary cetartiodactyl subgroups has been of special interest to many researchers. In this study, we provide strong evidence that hippopotamuses and cetaceans form a monophyletic clade. With respect to the relationships among the other primary cetartiodactyl groups, previous studies have indicated that camels diverged first (8, 14). However, the support for this conclusion has been tenuous, particularly from a statistical perspective (14). Results from our phylogenetic analysis now provide support for the hypothesis that camels represent the basal cetartiodactyl lineage (Fig. 7B). However, more work is needed to verify our finding that Tylopoda is the basal lineage among cetartiodactyls, because only one locus (INO) was characterized. Finally, our analyses confirmed the traditional classification scheme of Ruminantia regarding the placement of chevrotains, namely that they form the basal lineage in Ruminantia (Fig. 7 and ref. 36). It should be noted that all retroposon loci analyzed to date, including those in our previous report (15), are consistent with the tree shown in Fig. 7B.
DISCUSSION
The Power of SINE and LINE Analysis for Phylogenetic Inference. Extensive research has been conducted on developing statistical methods for reconstructing phylogenetic trees. In particular, a great deal of effort has been put into studying how DNA sequence data can be used to reconstruct reliable phylogenies (37, 38). However, when sequence divergence is high and the rate of nucleotide substitution varies with evolutionary lineage, any tree-building method may produce an incorrect tree topology because of the problem of long-branch attraction (39). In this case, an incorrect tree may display high bootstrap values (37, 40). Therefore, correctly inferring the true tree topology remains to be one of the most difficult problems when using DNA sequences to infer species phylogeny.
SINES and LINEs are virtually unique and irreversible mutations (15, 17–21, 23), which is well documented with primate Alu (SINE) sequences (41). During the last 10 years, one of us (N.O.) has studied several hundred SINE loci, but he has never observed any occurrence of independent SINE insertions among species at identical genomic positions (i.e., between the same two nucleotides). Because the probability that a SINE/LINE will be lost once it has been inserted into the genome is extremely small, and the probability that the same SINE/LINE will be inserted independently into an identical region in the genomes of two different taxa is also very small, the probability that homoplasy will obscure phylogenetic relationships is, for all practical purposes, zero (21, 47). Therefore, one can reconstruct phylogenetic trees with high confidence by considering multiple independent SINE/LINE insertion events that define given nodes in a tree.
Although SINE/LINE insertion analysis is excellent for phylogeny reconstruction, it has some disadvantages compared with DNA or amino acid sequence data. First, detailed characterization of SINEs is required before one should screen potentially informative loci. These procedures are expensive and time consuming. Second, very deep divergences (e.g., among different vertebrate classes) may not be resolvable with this method because it depends on the conservation of flanking sequences where primers are designed. Third, there may be hotspots of retroposon insertion where a retroposon may be inserted in the exact location of the genome independently in different lineages, although so far we have not observed such cases. If hotspots do occur, the accuracy of the resultant tree would decline. In this case, characterization of multiple loci will be required to enhance the accuracy of the tree. Fourth, incomplete lineage sorting of ancestral polymorphism might present a problem for certain loci (42). If this incomplete lineage sorting occurs, incongruence among loci regarding phylogenetic relationships may result, so the characterization of multiple loci is desirable. For this reason, more work is needed to verify our finding that Tylopoda is the basal lineage among cetartiodactyls, because only one locus (INO) was characterized. Finally, SINE/LINE insertion analysis cannot be applied to branch length estimation because the generation of new insertions may be episodic rather than clock-like (21, 43). However, once a topology is obtained for a given data set by using SINE/LINE insertion analysis, branch lengths can be estimated relatively easily from the analysis of DNA sequence data (37).
When gathering SINE/LINE data, missing bands sometimes are observed, owing to mismatches of primers nested in flanking sequences. Such mismatches arise as a result of either the accumulation of mutations of primer binding sites or the loss of primer binding sites by deletions. The probability of obtaining missing bands is roughly proportional to the divergence time between taxa analyzed and sometimes may depend on mutations that are specific to the taxon in which primers were synthesized. For example, when taxa that are far distantly related to those in question were analyzed (imagine if we had included mouse or human DNA in the analysis shown in Fig. 1A), usually no bands can be observed. Yet, missing bands sometimes are observed even when taxa analyzed are closely related (e.g., Fig. 1C, lane 5; Fig. 1D, lane 2; Fig. 1G, lanes 8 and 10). Because the SINE/LINE method considers only the presence or absence of a retroposon in orthologous loci, species with missing bands must be regarded as missing data in the analysis.
Convergence and Synapomorphy. A close phylogenetic relationship between cetaceans and ungulates was first suggested more than 100 years ago, although the exact nature of this relationship was unclear (44). We now have good evidence of the actual relationship, which is rather surprising: a monophyletic Cetacea, deeply nested within Artiodactyla, whose sister taxon is the Hippopotamidae. In fact, the Hippopotamidae and Cetacea share several specialized aquatic adaptations, including a lack of hair and sebaceous glands and underwater vocalizations that are apparently communicative (14, 45). These shared specializations have been interpreted as examples of convergence resulting from adaptation to an aquatic existence, and not as synapomorphies (shared derived characters). However, the phylogeny inferred in this study indicates that these specializations are indeed synapomorphies. Therefore, these observations suggest that a reconsideration of the morphological evolution of these taxa should be undertaken.
Our conclusions also prompt serious reconsideration of the history of morphological transformations within the group of extinct ungulates that are believed to be the progenitors of cetaceans, the mesonychians. Paleontological studies indicate that modern whales arose from the extinct Archaeoceti, primitive cetaceans that first appeared around 50 million years ago (Mya) (1–3). In turn archaeocete whales are believed to have arisen from an extinct group of land mammals called mesonychians (4, 5), which first appeared roughly 60 Mya (3). Numerous dental and skeletal characters link archaeocete whales to mesonychian ungulates (46). Our results, and those of previous studies, suggest that cetaceans are deeply nested within the Artiodactyla. However, the inclusion of mesonychians within the order Artiodactyla is difficult to reconcile with the timing of the first appearance of fossil artiodactyls, around 54 Mya (3), which is later than the first appearance of mesonychians in the fossil record (around 60 Mya). Interestingly, morphological and palaeontological evidence also suggest that mesonychians are not the immediate progenitors of cetaceans. A highly mobile joint evolved in the heels of artiodactyls, whereas most mammals retain a less mobile heel joint (47). This highly mobile heel joint is considered to be a synapomorphy for all modern artiodactyls (48, 49) and is also present to some extent in archaeocetes (50). However, mesonychians lack this machinery, which implies that mesonychians might not have given immediate rise to archeocetes (47). If such is the case, the striking resemblance between the teeth of primitive cetaceans and those of mesonychian ungulates (46) might be convergent.
Acknowledgments
We thank Drs. N. Kohno and D. Graur and Mr. M. Shimamura for helpful discussion; Drs. H. Kato, T. Kishiro, M. Goto, H. Abe, and I. Munechika for samples of various animals; Dr. A. Shedlock for critical reading of the manuscript; Dr. M. Cantrell for discussion regarding SINE hotspots; and three anonymous reviewers for their constructive criticisms. This work was supported by a Grant-in-Aid to N.O. for Specially Promoted Research from the Ministry of Education, Science Sports and Culture of Japan. A.P.R. was supported by grants from the National Institutes of Health and National Science Foundation to M. Nei.
ABBREVIATIONS
- SINE
short interspersed element
- LINE
long interspersed element
- MER
medium reiteration frequency family
- ARE
artiodactyla repetitive element
Footnotes
References
- 1.Gingerich P D, Smith B H, Simons E L. Science. 1990;249:154–157. doi: 10.1126/science.249.4965.154. [DOI] [PubMed] [Google Scholar]
- 2.Thewissen J G M, Hussain S T. Nature (London) 1993;361:444–445. doi: 10.1038/361444a0. [DOI] [PubMed] [Google Scholar]
- 3.Thewissen J G M. J Mammal Evol. 1994;2:157–184. [Google Scholar]
- 4.Fordyce R E, Barnes L G. Annu Rev Earth Planet Sci. 1994;22:419–455. [Google Scholar]
- 5.Prothero D R, Manning E M, Fischer M. In: The Phylogeny and Classification of the Tetrapods. Benton M J, editor. Vol. 2. Oxford: Clarendon; 1988. pp. 201–234. [Google Scholar]
- 6.Novacek M J. Nature (London) 1992;356:121–125. doi: 10.1038/356121a0. [DOI] [PubMed] [Google Scholar]
- 7.Milinkovitch M C, Orti G, Meyer A. Nature (London) 1993;361:346–348. doi: 10.1038/361346a0. [DOI] [PubMed] [Google Scholar]
- 8.Graur D, Higgins D G. Mol Biol Evol. 1994;11:357–364. doi: 10.1093/oxfordjournals.molbev.a040118. [DOI] [PubMed] [Google Scholar]
- 9.Irwin D M, Arnason U. J Mammal Evol. 1994;2:37–55. [Google Scholar]
- 10.Philippe H, Douzery E. J Mammal Evol. 1994;2:133–152. [Google Scholar]
- 11.Gatesy J, Hayashi C, Cronin M A, Arctander P. Mol Biol Evol. 1996;13:954–963. doi: 10.1093/oxfordjournals.molbev.a025663. [DOI] [PubMed] [Google Scholar]
- 12.Smith M R, Shivji M S, Waddel V G, Stanhope M J. Mol Biol Evol. 1996;13:918–922. doi: 10.1093/oxfordjournals.molbev.a025659. [DOI] [PubMed] [Google Scholar]
- 13.Hasegawa M, Adachi J. Mol Biol Evol. 1996;13:710–717. doi: 10.1093/oxfordjournals.molbev.a025632. [DOI] [PubMed] [Google Scholar]
- 14.Gatesy J. Mol Biol Evol. 1997;14:537–543. doi: 10.1093/oxfordjournals.molbev.a025790. [DOI] [PubMed] [Google Scholar]
- 15.Shimamura M, Yasue H, Ohshima K, Abe H, Kato H, Kishiro T, Goto M, Munechika I, Okada N. Nature (London) 1997;388:666–670. doi: 10.1038/41759. [DOI] [PubMed] [Google Scholar]
- 16.Ursing B M, Arnason U. Proc R Soc London B. 1998;265:2251–2255. doi: 10.1098/rspb.1998.0567. [DOI] [PMC free article] [PubMed] [Google Scholar]
- 17.Okada N. Trends Ecol Evol. 1991;6:358–361. doi: 10.1016/0169-5347(91)90226-N. [DOI] [PubMed] [Google Scholar]
- 18.Murata S, Takasaki N, Saitoh M, Okada N. Proc Natl Acad Sci USA. 1993;90:6995–6999. doi: 10.1073/pnas.90.15.6995. [DOI] [PMC free article] [PubMed] [Google Scholar]
- 19.Murata S, Takasaki N, Saitoh M, Tachida H, Okada N. Genetics. 1996;142:915–926. doi: 10.1093/genetics/142.3.915. [DOI] [PMC free article] [PubMed] [Google Scholar]
- 20.Takahashi K, Terai Y, Nishida M, Okada N. Mol Biol Evol. 1998;15:391–407. doi: 10.1093/oxfordjournals.molbev.a025936. [DOI] [PubMed] [Google Scholar]
- 21.Shedlock, A. & Okada, N. (1999) BioEssays, in press. [DOI] [PubMed]
- 22.Eickbush T H. In: The Evolutionary Biology of Viruses. Morse S S, editor. New York: Raven; 1994. pp. 121–157. [Google Scholar]
- 23.Verneau O, Catzeflis F, Furano A V. Proc Natl Acad Sci USA. 1998;95:11284–11289. doi: 10.1073/pnas.95.19.11284. [DOI] [PMC free article] [PubMed] [Google Scholar]
- 24.Weiner A M, Deininger P L, Efstratiadis A. Annu Rev Biochem. 1986;55:631–661. doi: 10.1146/annurev.bi.55.070186.003215. [DOI] [PubMed] [Google Scholar]
- 25.Schmid C, Maraia R. Curr Opin Genet Dev. 1992;2:874–882. doi: 10.1016/s0959-437x(05)80110-8. [DOI] [PubMed] [Google Scholar]
- 26.Blin N, Stafford D W. Nucleic Acids Res. 1976;3:2303–2308. doi: 10.1093/nar/3.9.2303. [DOI] [PMC free article] [PubMed] [Google Scholar]
- 27.Sanger F, Nicklen S, Coulson A R. Proc Natl Acad Sci USA. 1977;74:5463–5467. doi: 10.1073/pnas.74.12.5463. [DOI] [PMC free article] [PubMed] [Google Scholar]
- 28.Saiki R K, Gelfand D H, Stoffel S, Scharf S J, Higuchi R, Horn G T, Mullis K B, Erlich H A. Science. 1988;239:487–491. doi: 10.1126/science.2448875. [DOI] [PubMed] [Google Scholar]
- 29.Southern E M. J Mol Biol. 1975;98:503–517. doi: 10.1016/s0022-2836(75)80083-0. [DOI] [PubMed] [Google Scholar]
- 30.Swofford D L. paup*: Phylogenetic Analysis Using Parsimony. Sunderland, MA: Sinauer; 1998. , Version 4.0. [Google Scholar]
- 31.Jurka J, Kaplan D J, Duncan C H, Walichiewicz J, Milosavljevic A, Murali G, Solus J F. Nucleic Acids Res. 1993;21:1273–1279. doi: 10.1093/nar/21.5.1273. [DOI] [PMC free article] [PubMed] [Google Scholar]
- 32.Shimamura, M., Abe, H., Nikaido, M., Ohshima, K. & Okada, N. (1999) Mol. Biol. Evol., in press. [DOI] [PubMed]
- 33.Lenstra J A, van Boxtel J A F, Zwaagstra K A, Schwerin M. Anim Genet. 1993;24:33–39. doi: 10.1111/j.1365-2052.1993.tb00916.x. [DOI] [PubMed] [Google Scholar]
- 34.Alexander L J, Rohrer G A, Stone R T, Beattie C W. Mamm Genome. 1995;6:464–468. doi: 10.1007/BF00360655. [DOI] [PubMed] [Google Scholar]
- 35.Montgelard C, Catzeflis F M, Douzery E. Mol Biol Evol. 1997;14:550–559. doi: 10.1093/oxfordjournals.molbev.a025792. [DOI] [PubMed] [Google Scholar]
- 36.Kraus F, Miyamoto M M. Syst Zool. 1991;40:117–130. [Google Scholar]
- 37.Nei M. Annu Rev Genet. 1996;30:371–403. doi: 10.1146/annurev.genet.30.1.371. [DOI] [PubMed] [Google Scholar]
- 38.Swofford D L, Olsen G J, Waddell P J, Hillis D M. In: Molecular Systematics. Hillis D M, Moritz C, Mable B K, editors. Sunderland, MA: Sinauer; 1996. pp. 407–514. [Google Scholar]
- 39.Felsenstein J. Syst Zool. 1978;27:401–410. [Google Scholar]
- 40.Cao Y, Waddell P J, Okada N, Hasegawa M. Mol Biol Evol. 1998;15:1637–1646. doi: 10.1093/oxfordjournals.molbev.a025891. [DOI] [PubMed] [Google Scholar]
- 41.Schmid C W. Prog Nucleic Acid Res Mol Biol. 1996;53:283–319. doi: 10.1016/s0079-6603(08)60148-8. [DOI] [PubMed] [Google Scholar]
- 42.Nei M. Molecular Evolutionary Genetics. New York: Columbia Univ. Press; 1987. [Google Scholar]
- 43.Cook J M, Tristem M. TREE. 1997;12:295–297. doi: 10.1016/S0169-5347(97)01121-X. [DOI] [PubMed] [Google Scholar]
- 44.Flower W H. Proc Zool Soc London. 1883;1883:466–513. [Google Scholar]
- 45.Barklow W. Nat Hist. 1995;104:54. [Google Scholar]
- 46.Van Valen L. Am Mus Nat Hist Bull. 1966;132:1–126. [Google Scholar]
- 47.Milinkovitch M C, Thewissen J G M. Nature (London) 1997;388:622–624. doi: 10.1038/41650. [DOI] [PubMed] [Google Scholar]
- 48.Rose K D. Science. 1982;216:621–623. doi: 10.1126/science.216.4546.621. [DOI] [PubMed] [Google Scholar]
- 49.Golz D J. Nat Hist Mus Los Angeles County Sci Bull. 1976;26:1–85. [Google Scholar]
- 50.Thewissen J G M, Madar S I, Hussen S T. Nature (London) 1998;395:452. doi: 10.1038/26656. [DOI] [PubMed] [Google Scholar]


