Abstract
Peripheral T cell lymphoma, unspecified (PTCL/U), the most common form of PTCL, displays heterogeneous morphology and phenotype, poor response to treatment, and poor prognosis. We demonstrate that PTCL/U shows a gene expression profile clearly distinct from that of normal T cells. Comparison with the profiles of purified T cell subpopulations (CD4+, CD8+, resting [HLA-DR–], and activated [HLA-DR+]) reveals that PTCLs/U are most closely related to activated peripheral T lymphocytes, either CD4+ or CD8+. Interestingly, the global gene expression profile cannot be surrogated by routine CD4/CD8 immunohistochemistry. When compared with normal T cells, PTCLs/U display deregulation of functional programs often involved in tumorigenesis (e.g., apoptosis, proliferation, cell adhesion, and matrix remodeling). Products of deregulated genes can be detected in PTCLs/U by immunohistochemistry with an ectopic, paraphysiologic, or stromal location. PTCLs/U aberrantly express, among others, PDGFRα, a tyrosine-kinase receptor, whose deregulation is often related to a malignant phenotype. Notably, both phosphorylation of PDGFRα and sensitivity of cultured PTCL cells to imatinib (as well as to an inhibitor of histone deacetylase) were found. These results, which might be extended to other more rare PTCL categories, provide insight into tumor pathogenesis and clinical management of PTCL/U.
Introduction
Peripheral T cell lymphomas (PTCLs) represent approximately 12% of lymphoid neoplasms (1). Their incidence varies in different countries and races, being higher in areas where human T cell lymphoma/leukemia virus-1 is endemic (Asia, the Caribbean basin, and some parts of the United States) (2). PTCLs are a heterogeneous group of tumors that in the Revised European-American Lymphoma (REAL)/WHO classification are roughly subdivided into specified and unspecified (U) forms (1, 3). The latter group, corresponding to about 60%–70% of PTCLs, cannot be further classified on the basis of morphology, phenotype, or conventional molecular studies (1, 4, 5).
PTCLs/U usually occur in the fifth to sixth decade, with a male-to-female ratio of 1:1 (4, 6, 7). They present as nodal or extranodal disease in 22% and 16% of the cases, respectively, but more often have a widespread dissemination (stage III–IV) with nodal, skin, liver, spleen, bone marrow, and peripheral blood involvement (4, 6, 8). B symptoms are recorded in about 45% of cases at diagnosis. A hemophagocytic syndrome characterized by fever, cytopenia, and spleen/liver enlargement may also be encountered (4, 6, 8).
Tumor morphology is highly variable, comprising cells of different sizes and shapes (3). PTCLs/U may contain prominent reactive components, including small lymphocytes, eosinophils, plasma cells, histiocytes, and epithelioid elements (3, 9, 10).
Immunohistochemistry generally shows T cell–associated molecule expression, although the phenotypic profile is aberrant in about 80% of cases, with CD5 and CD7 as the most common defective antigens (11, 12). Nodal cases are more often CD4+, whereas extranodal cases are more often CD8+. In 50% of cases, however, the 2 antigens are either coexpressed (double-positive) or not expressed at all (double-negative) (12).
Clonal rearrangements of T cell receptor–encoding genes are generally detected (13). The karyotype is aberrant in more than 80% of cases and often characterized by complex abnormalities. However, specific alterations have not been identified (14). Recently, some recurrent lesions have been documented by comparative genomic hybridization (15).
Clinically, PTCLs/U are among the most aggressive of non-Hodgkin lymphomas. Their response to conventional chemotherapy is indeed frustrating, with 5-year relapse-free and overall survival rates of 26% and 20%, respectively (8). Neither the morphology nor the international prognostic index significantly correlates with clinical outcome. Recently, new clinical/biological scores have been proposed to help stratify cases into prognostically different subgroups (12, 16). These scoring systems, however, require further validation.
On a molecular level, the pathobiology of PTCLs/U is poorly understood, like that of T cell neoplasms in general. In particular, few studies have investigated T cell tumor gene expression profiling (17–21), and the molecular basis for their clinical aggressiveness remains elusive.
In the present study, we investigate PTCLs/U (the most common subtype of PTCL) to assess whether gene expression profiling can (a) reveal biological diversity; (b) identify their normal, corresponding cellular counterparts; (c) provide a molecular rationale for their aggressive clinical behavior; and (d) indicate novel therapeutic targets.
Results
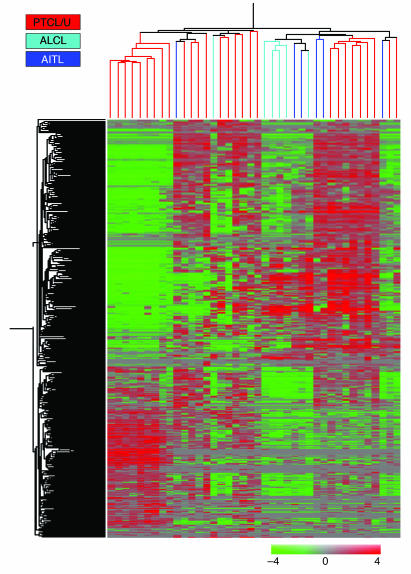
Gene expression profile analysis was performed on 28 PTCLs/U, to which 6 angioimmunoblastic lymphomas (AITLs) and 6 anaplastic large cell lymphomas (ALCLs) were added for comparison. Tumor samples corresponded to frozen lymph node biopsies collected from 40 patients at diagnosis. Twenty samples of purified normal T cells (including CD4+, CD8+, HLA-DR+, and HLA-DR– cells), 20 samples of purified normal B cells (including naive cells, centroblasts, centrocytes, and memory cells), and 10 cases of B cell chronic lymphocytic leukemia (B-CLL; chosen as an example of B cell–derived tumor) were also used in the analysis. As expected, an unsupervised clustering method (22, 23) (see Supplemental Figure 1; supplemental material available online with this article; doi:10.1172/JCI26833DS1) promptly distinguished between T cell and B cell populations, on the basis of the expression of 327 genes. Within each group, samples clustered on the basis of their nature (i.e., B cells versus B-CLL and T lymphocytes versus PTCLs). When unsupervised analysis was applied to PTCL/U, AITL, and ALCL cases, complete separation could not be achieved among the 3 PTCL histological subtypes. In particular, PTCL/U and AITL displayed a gene expression profile that was quite similar, whereas ALCL tended to cluster more tightly (Figure 1). Based on the expression of 417 genes, 2 main subgroups were identified, the first containing 19 PTCL/U, 1 ALCL, and 1 AITL (Group 1), and the second containing 5 ALCL, 5 AITL, and the remaining 9 PTCL/U (Group 2) (Figure 1). Interestingly, the 2 subgroups differed in the expression of genes mainly involved in immune and defense responses (Supplemental Table 1), possibly reflecting a difference in the amount of reactive components present in the analyzed samples. In a similar manner, a difference in reactive components may have also prevented a clear-cut distinction among the 3 PTCL histological subtypes in the unsupervised analysis.
Figure 1. Unsupervised hierarchical clustering of PTCL/U, AITL, and ALCL.
Unsupervised analysis performed on 28 PTCL/U, 6 AITL, and 6 ALCL samples. The 40 samples are clustered according to the expression of 417 genes. While ALCLs roughly cluster together, AITLs are scattered within PTCL/U.
PTCL/U derives from mature, activated T lymphocytes of either the CD4 or the CD8 type.
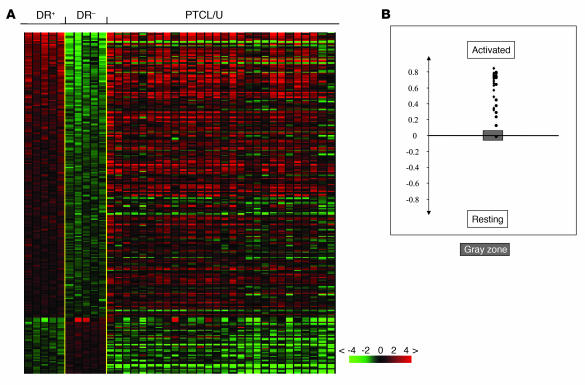
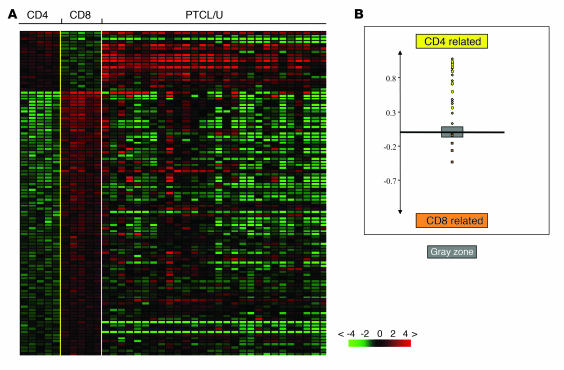
As a first step in our investigation, we studied the expression of genes specifically regulated during different phases of intrathymic development (24). Absence of these genes allowed us to exclude the theoretical derivation of our PTCLs/U from immature T cells, despite the presence of some CD4/CD8 double-positive and double-negative cases at immunohistochemistry (see below). Secondly, we studied PTCL/U for the expression of genes previously shown to be differentially expressed in purified resting (HLA-DR–) and activated (HLA-DR+) T cells by supervised analysis (Supplemental Table 2). We found that PTCL/U gene expression was definitely closer to that of activated T lymphocytes (Figure 2). An analogous investigation was performed using a profile of genes differentially expressed between purified CD4 and CD8 T cell subsets (Supplemental Table 3). The analysis revealed that some PTCLs/U were more closely related to CD4 cells, whereas others were closer to CD8 (Figure 3). Accordingly, PTCL/U could be divided into 2 subgroups, based on similarity to normal cellular counterparts. Interestingly, the comparison between the gene expression patterns (CD4/“helper-like” and CD8/“cytotoxic-like”) and the immunohistochemical search for CD4 and CD8 antigens in routine sections showed a partial dissociation of the 2 parameters. In fact, both samples with a “helper” and “cytotoxic” gene pattern included cases that displayed a CD4+, CD8+, CD4–CD8– (double-negative), or CD4+CD8+ (double-positive) profile at immunohistochemistry (see also Supplemental Table 4). Finally, we looked for the expression of genes characteristic of different functional stages of T cells, such as Th1, Th2, T follicular helper, T central memory, and T effector memory (25, 26), in our PTCLs/U. None of these signatures was unequivocally present in our series.
Figure 2. Relatedness of PTCL/U to resting and activated normal lymphocytes.
Relatedness of the gene expression profile of PTCL/U to normal T cell populations. (A) A supervised analysis was used to identify the genes differentially expressed between 2 groups of samples. HLA-DR+ (activated) T cells are compared with HLA-DR– (resting) T cells. The expression of the selected genes is investigated in PTCLs/U, represented on the right side of the matrix. (B) A cell-type classification is used to measure the relatedness of PTCL/U to HLA-DR+ and HLA-DR– T cells. The gray area marks 95% confidence: the P value decreases with increasing distance from the x axis.
Figure 3. Relatedness of PTCL/U to CD4 and CD8 normal lymphocytes.
Relatedness of the gene expression profile of PTCL/U to normal T cell populations. A supervised analysis was used to identify the genes differentially expressed between 2 groups of samples. (A) CD4+ T cells are compared with CD8+ T cells. The expression of the selected genes is investigated in PTCLs/U, represented on the right side of the matrix. (B) A cell-type classification is used to measure the relatedness of PTCL/U to CD4+ and CD8+ T cells. The gray area marks 95% confidence: the P value decreases with increasing distance from the x axis.
Together, our results indicate that on a molecular level, some PTCLs/U are more closely related to activated peripheral CD4 T cells, while others are closer to activated peripheral CD8 T cells. Thus, one might speculate that such malignancies can derive from the transformation and clonal expansion of mature activated CD4- or CD8-committed T lymphocytes. Interestingly, immunophenotypic analysis — by simple anti-CD4 and -CD8 antibodies — cannot reproduce the subgroup distinction allowed by gene expression profiling.
PTCL/U differs from normal T cells by the expression of genes involved in matrix remodeling, adhesion, apoptosis, and transcription.
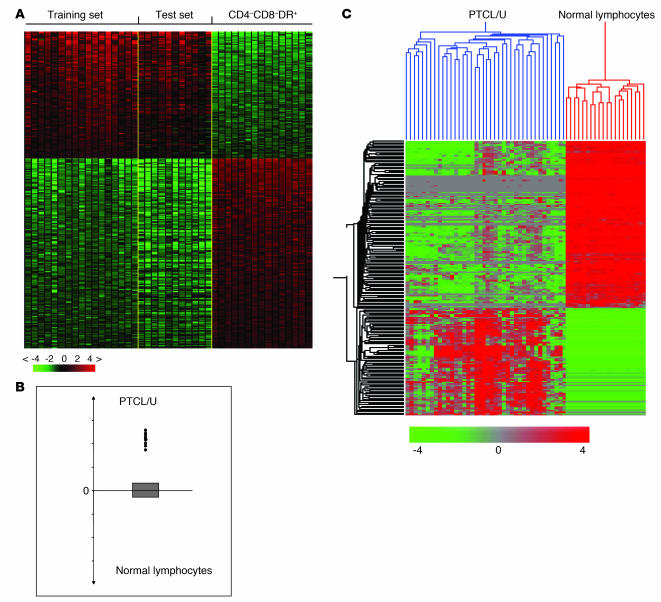
In order to identify the genes and cell programs deregulated in PTCL/U, we used a supervised analysis to directly compare tumor cases with the corresponding normal cellular counterparts (CD4, CD8, and activated). To make the analysis more robust, we divided our panel into a training set (17 cases) and a test set (11 cases). The analysis identified 155 genes (91 downregulated and 64 upregulated) that were differentially expressed in PTCL/U compared with normal T cells (Figure 4A; for details, see also Supplemental Tables 5 and 6). This signature was indeed tumor specific, as it was able to correctly classify all cases included in the test set by using both the classifier (Figure 4B) and an unsupervised hierarchical clustering (Figure 4C).
Figure 4. Supervised analysis of PTCL/U and normal lymphocytes identifies differentially expressed genes.
Identification of genes differentially expressed in PTCL/U and normal T lymphocytes. Supervised analysis was performed using 17 samples of PTCL/U (training set) versus the 3 normal T cell subpopulations identified as the closest normal counterparts (CD4+, CD8+, and HLA-DR+). The support value for the analysis was chosen as n = n0 (n0, number of samples in the phenotype set). (A) The analysis identified 155 genes that are differentially expressed in PTCL/U versus all the other samples (Supplemental Tables 5 and 6). The expression of the 155 genes was then investigated and validated in an independent test set (11 PTCL/U cases), represented on the right side of the matrix. (B) A cell-type classification is used to measure the relatedness of test set cases to PTCL/U (training set) and normal T cells. The gray area marks 95% of confidence: the P value decreases with increasing distance from the x axis. (C) In addition, the identified 155 genes correctly classified all the 11 PTCLs/U of the test set in unsupervised analysis.
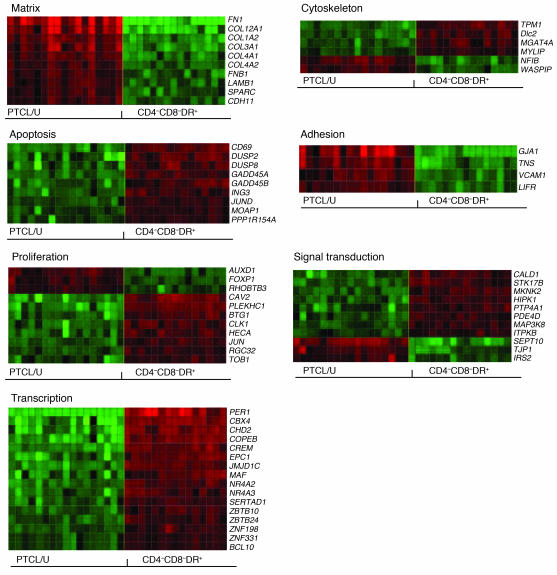
Subsequently, these genes were classified according to relevant functional/operational categories and, for the most part, corresponded to cell programs often implicated in tumorigenesis, such as cell adhesion, matrix remodeling, proliferation, apoptosis, and transcription (Figure 5). Such categories remained significantly overrepresented even when the number of genes belonging to each category that were comprised within the GeneChip (Affymetrix) was taken into consideration (P < 0.05) (27) (Supplemental Tables 7 and 8).
Figure 5. Cellular programs deregulated in PTCL/U.
Fifty-seven of the 155 genes found to be differentially expressed in PTCL/U and normal T lymphocytes could be classified according to 7 functional categories known to be particularly relevant to malignant behavior. Gene names are indicated. For description of the matrix, see the legend to Figure 4.
Among others, newly identified genes that are notably overexpressed in PTCL/U include (see also Discussion): (a) FN1 (fibronectin 1), COL3A1, COL4A1, COL4A2 and COL12A1 (all encoding for collagen components), whose expression may be related to the typical invasiveness of PTCL/U (1, 28–30); (b) CYR61 (cysteine-rich 61) and NNMT (nicotinamide N-methyl transferase), which may contribute to resistance to chemotherapy, a common feature of PTCL/U (31–38); and (c) PDGFRA (platelet-derived growth factor receptor, α polypeptide), encoding for a tyrosine kinase possibly involved in neoplastic transformation, whose activity can be inhibited by imatinib mesylate (39, 40). Within the group of downregulated genes, there were GADD45A and GADD45B (growth arrest and DNA damage–inducible α and β), which are involved in control of apoptosis and whose expression is induced by histone deacetylase inhibitors (HDACi’s) (41–45).
Immunohistochemical validation on tissue microarrays.
To investigate whether or not the upregulated mRNA levels of PTCL/U–associated genes corresponded to elevated levels of the encoded proteins, we stained tissue microarrays (TMAs) containing 148 PTCLs/U (including the cases subjected to gene expression analysis) by using specific monoclonal and polyclonal antibodies raised against the selected molecules (12). In addition, we tried to assess whether the overexpression of some genes was really due to the neoplastic cells or was perhaps secondary to reactive elements.
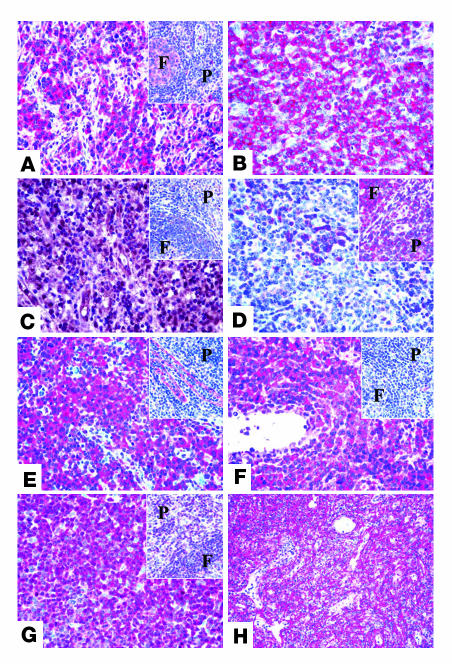
The expression in PTCL/U cells was confirmed for both PDGFRα and CYR61. In particular, of 148 PTCL/U cases, 133 and 137 could be evaluated for PDGFRα and CYR61, respectively. The remaining 15 and 11 cases were excluded because of core loss, unrepresentative sample, or suboptimal antigen preservation. PDGFRα was strongly expressed by most if not all neoplastic cells in 121 cases (91%). Staining was diffusely cytoplasmic with a certain enhancement at the membrane level in some instances (Figure 6A). In 95% of evaluable cases, PDGFRα turned out to be phosphorylated (Figure 6B). The anti-CYR61 antibody provided positive results in 132 cases (96%). Interestingly, the staining was not confined to the cytoplasm but also occurred at the nuclear level in a varying proportion of neoplastic cells (Figure 6C), a finding previously reported in muscle cell cultures by Tamura et al. (46). In normal T cells, a faint CYR61 positivity was sometimes observed, always confined to the cytoplasm (Figure 6C, inset).
Figure 6. Immunohistochemical validation of gene expression results on TMAs.
Examples of the immunostaining patterns for PDGFRα (A), p-PDGFRα (B), CYR61 (C), BCL10 (D), IGFBP7 (E), LIFR (F), p27 (G), and caldesmon (H). The insets show the staining for the corresponding marker in normal lymphoid tissue (F, follicle; P, paracortex/T zone). Original magnification, ×400.
With regard to other antibodies, BCL10 was found to be absent in most instances, with the internal positive control provided by a few residual germinal center B cells (Figure 6D). More variable results were obtained with antibodies against IGFBP7 and LIFR, which strongly reacted with 56% and 31% of the examined cases, respectively (Figure 6, E and F). p27 was detected in the nuclei of most neoplastic cells in 46% of PTCLs/U (Figure 6G); in the remaining cases, the number of stained cells did not reach the adopted cutoff value, although a certain number of positive elements was always recorded. Interestingly, the intensity of p27 staining was higher in small to medium-sized cells (Figure 6G). In normal controls, about 30% of T lymphocytes showed p27 positivity at the cytoplasmic level (Figure 6G, inset). Finally, the anti-caldesmon antibody stained the stromal component of the examined cores, but not the neoplastic cells (Figure 6H). The immunohistochemical analysis results are summarized in Table 1.
Table 1 .
Immunohistochemical analysis on TMAs
Taken together, these results indicate that there is a rather good correspondence between mRNA and protein expression. Certainly, the immunohistochemical determination of the latter allows a clear-cut definition of the cellular compartment carrying the phenotypic attribute.
Supervised comparison among PTCL/U, AITL, and ALCL.
Notably, the 155-gene signature identified in PTCL/U at supervised analysis (Figure 4A and Supplemental Tables 5 and 6) was largely shared by ALCL and AITL (Supplemental Figure 2). This finding might reflect either the influence of reactive components or the existence of common tumor-associated pathways. The latter hypothesis finds some support in the fact that among the deregulated genes, there were those that were demonstrated to be tumor cell–specific by immunohistochemistry on TMAs. Moreover, the deregulated genes included the 91 downregulated genes that were not likely referable to a nontumoral component. A further supervised analysis revealed 28 genes differently expressed between PTCL/U on one hand and AITL and ALCL on the other (Supplemental Table 9). Among the latter were MT1E, MT1F, MAP2K2, RAB31, MAFB, SOCS3, and BCL3.
Cell culture experiments.
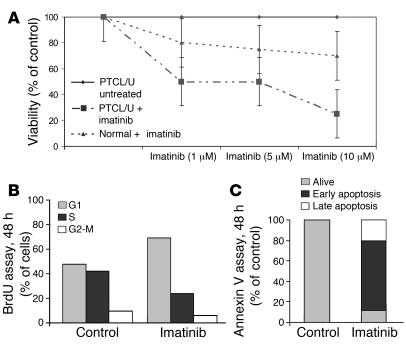
PTCL/U primary cells and normal T lymphocytes were incubated for 48 hours in media containing 10% FBS with or without imatinib at different concentrations (i.e., 1, 5, and 10 μM). Imatinib mesylate induced concentration-dependent growth inhibition of PTCL/U primary cells. In particular, cell viability at 48 hours was reduced by 50% with 1–5 μmol imatinib and by 75% with 10 μmol (Figure 7A). Repeated experiments prompted us to regard 1 μmol as IC50. Imatinib-induced cell cycle arrest and apoptosis were determined by BrdU and annexin V assays, respectively (Figure 7, B and C). Notably, the viability of normal cells was not significantly affected by imatinib mesylate exposure (Figure 7A).
Figure 7. Imatinib mesylate reduces PTCL/U primary cells' viability ex vivo.
(A) PTCL/U and normal T cells were incubated for 48 hours in media containing 10% FBS with or without imatinib at concentrations of 1, 5, and 10 μM. Imatinib induced concentration-dependent growth inhibition of PTCL/U primary cells with a very scarce effect on normal T lymphocyte viability. The results are plotted as the percentage of control untreated cells. Bars indicate the SEM of triplicate samples. (B and C) This effect was consistent with the G0/G1 cell cycle arrest and apoptosis induction.
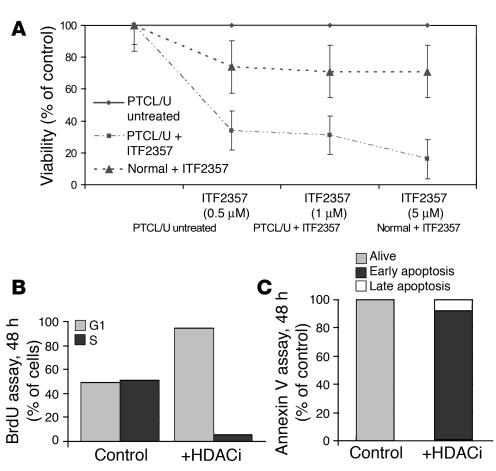
A similar experiment was carried out with ITF2357 (an HDACi) at increasing concentrations (0.5, 1, and 5 μM). By inducing cell cycle arrest and apoptosis, ITF2357 incubation resulted in concentration-dependent growth inhibition of PTCL/U primary cells (Figure 8, A–C). The viability of normal lymphocytes was only moderately affected by the drug (Figure 8A).
Figure 8. ITF2357 reduces PTCL/U primary cells’ viability ex vivo.
(A) PTCL/U and normal T cells were incubated for 48 hours in media containing 10% FBS with or without ITF2357 at concentrations of 0.5, 1, and 5 μM. ITF2357 induced concentration-dependent growth inhibition of PTCL/U primary cells with a scarce effect on normal T lymphocyte viability. The results are plotted as the percentage of control untreated cells. Bars indicate the SEM of triplicate samples. (B and C) This effect was consistent with the G0/G1 cell cycle arrest and apoptosis induction.
The combination of imatinib and ITF2357 did not produce better results than ITF2357 alone (Supplemental Figure 3). Analogously, the combinations of imatinib and daunorubicin, and ITF2357 and daunorubicin did not improve the results produced by imatinib and ITF2357 alone (Supplemental Figure 3). In contrast, the triple combination imatinib, ITF2357, and daunorubicin determined a striking cell-viability reduction (Supplemental Figure 3), secondary to apoptosis induction as revealed by annexin V assay (not shown).
Discussion
This paper has addressed critical questions regarding the cell of origin and pathogenesis of PTCL/U by using gene expression profiling technology in a panel of 28 cases. This panel is relatively large considering the rarity of this tumor in Western countries and the necessity of obtaining high-quality RNA from fresh or frozen material. In addition, this study significantly differs from the few previously published studies (18, 19) since it (a) represents the first analysis performed on the whole genome in such a field; (b) investigates a homogeneous group of PTCLs/U that all underwent biopsy at the nodal level and consist mostly of neoplastic elements; (c) includes a comprehensive group of normal T cells (CD4, CD8, resting, and activated) as a matched control; and (d) provides, for the first time to our knowledge, the rationale for possible targeted therapies in PTCL/U by offering clear evidence of their effectiveness ex vivo. Overall, the panel of cases herein described was sufficient to demonstrate the distinct phenotype of PTCL/U, identify the corresponding normal cellular counterparts, and discover alterations in cellular programs that might be of biological and clinical relevance.
The cellular derivation of PTCL/U.
The morphology of PTCLs/U suggests their derivation from mature T lymphocytes. However, the variable and often aberrant immunophenotype of the neoplastic cells in terms of T cell (47) and activation marker expression (48, 49) does not allow clear recognition of a normal cellular counterpart. The gene expression profile shows that PTCLs/U are clearly distinct from normal T cells, B lymphocytes, and B-CLL, taken as an example of B-derived tumor. Although 28 genes appear to be differently expressed, the molecular profile of PTCL/U is relatively similar to that of ALCL and AITL (Figure 1). Whether such similarity is due to the influence of non-neoplastic elements or possibly to the existence of common tumor-associated pathways remains to be elucidated, even if our findings seem to suggest the latter hypothesis. To solve this problem, further investigation with collection and analysis of a sufficient number of cases with purified tumor cells is warranted.
Interestingly, the gene expression profile shows that PTCL/U is more closely related to activated than to resting T cells. As in normal mature T lymphocytes, it is possible to identify 2 main subgroups of PTCL/U, with gene expression profiles related to either CD4 or CD8 elements. Notably, this characteristic does not reflect the immunophenotype with regard to the expression of the CD4 and CD8 antigens. In fact, in our study, PTCLs/U are distributed into the 2 genomic subgroups irrespective of their CD4+, CD8+, double-positive, or double-negative phenotype. This phenomenon correlates well with the variable detection of T cell–associated markers, as recently shown by our group on a large PTCL/U series (12). Accordingly, the expression of CD4 and CD8 molecules cannot be considered a reliable surrogate of the genetic program for the histogenetic subclassification of PTCL/U.
Functional alterations in PTCL/U.
This analysis provides several insights into the functional alterations of PTCL/U. A careful comparison of PTCL/U with the closest normal cellular counterparts revealed an extensive deregulation of genes that control functions typically damaged in malignant cells, such as matrix remodeling, cell adhesion, transcription regulation, proliferation, and apoptosis. However, since at the time of this writing only a part of the genes found to be deregulated had been validated, a possible contribution by reactive components cannot be completely ruled out.
Adhesion and matrix remodeling.
Several findings in this analysis may explain the unique dissemination pattern of PTCL/U, with extranodal and bone marrow involvement and spreading to peripheral blood (1). The gene expression analysis showed the upregulation of FN1, LAMB1, COL1A2, COL3A1, COL4A1, COL4A2, and COL12A1, which promote local invasion and metastasis in different types of human cancers (28–30). Notably, LAMB1 and COL1A2 have been recently included in a so-called “metastasis signature” for solid tumors. In addition, intriguingly, LAMB1 and FN1 can also regulate the apoptotic process through the PI3K/AKT and MEK1/ERK pathways, respectively (50).
Apoptosis.
Impairment of the apoptosis-proliferation balance is a common event in tumorigenesis. The gene expression analysis in PTCL/U showed the downregulation of several genes involved in apoptosis, including MOAP1, ING3, GADD45A, and GADD45B. MOAP1 contains a Bcl-2 homology 3–like motif that interacts with BAX, mediating caspase-dependent apoptosis (51). ING3 is a candidate tumor suppressor gene, whose expression inhibits cell growth and induces apoptosis (52); its allelic loss or reduced expression was found in human head and neck cancers and is associated with increased resistance to apoptosis (53). GADD45A and GADD45B regulate apoptosis through p38 activation and JNK inhibition (41–43). Intriguingly, the HDACi’s can induce the expression of GADD45A and GADD45B in a p53-independent manner (44) and were shown to be effective in the treatment of a PTCL/U patient (45).
Chemosensitivity.
PTCL/U is characterized by a very poor response to conventional chemotherapeutic agents and a dismal prognosis (1). For the first time to our knowledge, gene expression analysis has identified genes that may be responsible for this phenomenon. In particular, we found CYR61 and NNMT to be upregulated in PTCL/U. CYR61 is a growth factor–inducible gene that belongs to the CNN family and encodes a matrix-associated protein. It regulates angiogenesis (34, 35), promoting tumorigenesis and progression in breast cancer (34); its hyperexpression confers resistance to chemotherapy-induced apoptosis in breast cancer cells (34, 36). NNMT is involved in resistance to radiation and chemotherapy, in bladder cancer and papillary thyroid carcinoma, respectively (37, 38).
Immunohistochemical validation on TMAs.
Immunohistochemistry provided substantial in situ validation of the genomic data by showing correspondence between mRNA and protein expression, as seen, for example, with PDGFRA and BCL10. In addition, by comparison with normal tissues, immunohistochemistry allowed the identification of staining patterns corresponding to neoplastic cell synthesis of ectopic or paraphysiologic products (see PDGFRα and its activated form p-PDGFRα, CYR61, and IGFBP7 for the former attribute, and p27 for the latter). Finally, the phenotypic test highlighted the possibility that some of the results obtained by gene expression profiling may depend on non-neoplastic cellular components present in the analyzed sample; the results for caldesmon recorded in our series represent an example of such an event.
PDGFRα and histone deacetylase inhibition as possible therapeutic strategies.
The regular detection of PDGFRα overexpression at both the mRNA and the protein levels, as well as its frequent phosphorylation, prompted us to design an ex vivo experiment with the aim of testing the sensitivity of PTCL/U cells to imatinib, a presently available, well-known PDGFRα inhibitor (54). The obtained results are interesting, with around 50% cytotoxic effect seen at 48 hours with a 1-μmol concentration. This rate became even higher (about 75%) with a 10-μmol dose. Such concentrations are certainly higher than those used for chronic myeloid leukemia; however, they are similar to those proposed for some categories of solid tumors (e.g., Leydig cell tumor and small cell carcinoma of the lung) (55, 56). Notably, imatinib exerted a limited effect on the viability of normal lymphocytes, whereas daunorubicin resulted in a significant reduction in their vitality (data not shown). It will be of interest to perform further tests on some of the recently developed, more powerful tyrosine-kinase inhibitors.
In addition, evidence for the silencing of genes, possibly regulated by epigenetic mechanisms such as acetylation (see above), prompted us to test a novel hydroxamic acid HDACi (ITF2357) against PTCL/U primary cells. Notably, the compound induced a dramatic reduction in cell viability, with G0/G1 cell cycle arrest and apoptosis at therapeutic concentrations, suggesting a possible role for this class of drugs in PTCL/U therapy. Interestingly, the association of ITF2357 and daunorubicin apparently had a slight additive effect, as already observed with other HDACi’s (57). Finally, the triple combination of imatinib, ITF2357, and daunorubicin produced a remarkable effect on cell viability; it might represent a promising option for future therapeutic applications.
Pathogenetic and clinical implications.
The similarity of PTCLs/U with different normal T cell subsets (i.e., CD4 or CD8) may suggest that they derive from different cells, though presenting with a relatively similar gene expression profile. This would not be completely surprising, since CD4 and CD8 cells show a relatively similar genetic program, with their profiles differing only by the expression of 71 genes (Supplemental Table 3). The complexity of the chromosomal abnormalities might then explain the losses and gains of markers and the final aberrant phenotype. It will now be critical to investigate a larger panel of tumors to see whether these 2 subgroups of PTCL/U have peculiar clinical characteristics as well.
Recently, other groups have investigated PTCL/U by gene expression profile (19, 21). They proposed the existence of different PTCL/U subtypes, as well as NF-κB activation in a proportion of cases. Such findings might be related to non-neoplastic components more than to intrinsic differences in the neoplastic cells. In particular, the specific signatures were largely based on genes expressed by histiocytes and B cells (19, 21), while NF-κB activation was detected in samples with highly variable percentages of tumor cells, but not in purified PTCL/U (19, 58).
Our gene expression profile analysis identified several genes deregulated in PTCL/U that may be responsible for its pathogenesis. Examples include impairment of transcription regulation with disruption of several apoptotic pathways, induction of ECM remodeling and neoangiogenesis, and modification of cellular adhesion properties. Finally, the practical impact of PDGFRα and histone deacetylase inhibition may be the goal of future pilot clinical studies (59–63).
Methods
Case selection.
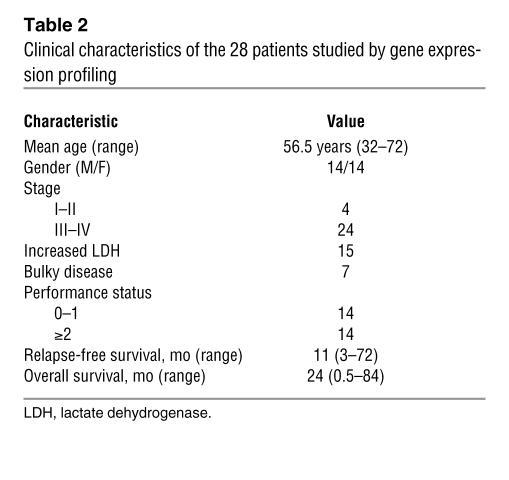
Cryopreserved samples of 28 PTCLs/U, 6 AITLs, and 6 ALCLs (4 ALK– and 2 ALK+) were retrieved from the files of 6 different institutions (Bologna University, Bologna, Italy; Centro di Riferimento Oncologico, Aviano, Italy; Brescia University, Brescia, Italy; Pavia University, Pavia, Italy; Perugia Univerisity, Perugia, Italy; and Turin University, Turin, Italy). Twenty samples of normal T cells were isolated at the National Cancer Research Institute in Genoa; they included 5 samples each of CD4+, CD8+, HLA-DR+ (activated), and HLA-DR– (resting) T lymphocytes. The tumor cases were selected on the basis of stringent criteria to guarantee the homogeneity of the series studied: (a) lymph node biopsy site; (b) excellent RNA preservation; (c) presence of more than 70% neoplastic cells in the specimen (as assessed on a routine section mirroring the frozen sample); and (d) availability of complete clinical information. The diagnosis of PTCL/U, AITL, and ALCL had been previously confirmed according to the REAL/WHO classification (1, 3) by at least 2 experienced hematopathologists, who also revised the phenotypic profiles and quantified the reactive components (eosinophils, neutrophils, histiocytes, epithelioid elements, dendritic cells, normal B and T lymphocytes, and high endothelial venules). All samples were obtained at the time of diagnosis, before any treatment. The clinical and histopathological characteristics of the 28 PTCL/U cases are summarized in Table 2 and Supplemental Table 4, respectively. B-CLL cases and normal B cell populations used for gene expression comparison had been the object of previous publication (64).
Table 2 .
Clinical characteristics of the 28 patients studied by gene expression profiling
In addition, the paraffin blocks of 300 putative PTCLs, either unspecified or AITL (1, 3), which had been enrolled in the course of a previous national trial (16), were centralized at the Hematopathology Unit of the University of Bologna. The diagnosis was confirmed in 193 cases (148 PTCLs/U and 45 PTCLs/AITL) by 2 experienced hematopathologists, on the basis of the morphologic and immunophenotypic examination of conventional sections. In particular, the phenotype was assessed by a large panel of reagents against CD2, CD3, CD4, CD5, CD7, CD8, CD10, CD15, CD20, CD30, CD56, CD57, CD79a, TIA-1, granzyme B, ALK protein, and EBER (12).
Before biopsy, informed consent was obtained from all enrolled patients. The procedure for tissue collection was approved by the ethical committees of the following institutions: Azienda Ospedaliera S. Orsola-Malpighi, Bologna, Italy; Centro di Riferimento Oncologico; Azienda Ospedaliera Spedali Civili, Brescia, Italy; Policlinico S. Matteo, Pavia, Italy; Azienda Ospedaliera, Perugia, Italy; Azienda Sanitaria Ospedaliera Molinette S. Giovanni Battista, Turin, Italy.
Normal T cell isolation.
Mononuclear cells from peripheral blood of normal donors were obtained by Ficoll-Hypaque density gradient. T cells were purified from PBMCs by rosetting with neuraminidase-treated sheep erythrocytes followed by depletion of contaminant monocytes (CD11b+), NK cells (CD16+), and B cells (CD19+) with the use of magnetic beads (Dynabeads; Unipath) and specific mAbs (BD Biosciences). To obtain CD4+ and CD8+ T cell subsets, PBMC T cells were incubated with anti-CD4 mAb or anti-CD8 mAb, respectively, followed by anti-mouse Ig conjugated with magnetic microbeads. CD4+ or CD8+ T cells were positively selected by collection of the cells retained on an MS magnetic column with a MiniMACS system (Miltenyi Biotec). Resting and activated T cells were prepared from tonsils as described previously (65). Briefly, tonsils were obtained from 5- to 12-year-old children undergoing routine tonsillectomies, with informed consent. T cell suspensions were purified from tonsillar mononuclear cells as described for peripheral blood. Activated T cells were isolated by incubation with anti-DR mAb, then with anti-mouse Ig conjugated with magnetic microbeads. Magnetically labeled DR+ activated T cells were selected by collection of the cells retained over an MS column. The flow-through DR– T cells were recovered as resting T cells. The degree of purification of the cell preparations was greater than 95%, as assessed by flow cytometry.
Gene expression profile generation and analysis.
Gene expression profiles were generated and analyzed as previously reported (22, 23, 27, 64, 66–69). For details, see Supplemental Methods. We used HG-U133 2.0 Plus microarrays, covering over 47,000 transcripts (Affymetrix). Raw gene expression data are available at http://www.ncbi.nlm.nih.gov/projects/geo/ (accession number GSE6338).
TMA construction.
TMA construction was performed as detailed in a previous publication referring to the same series (12).
Immunohistochemistry.
After appropriate antigen retrieval (70), the sections obtained from each TMA were tested with specific antibodies against the following molecules: PDGFRA/CD140A (rabbit polyclonal; Santa Cruz Biotechnology Inc.; dilution 1:80 [alkaline phosphatase antialkaline phosphatase, APAAP]), p-PDGFRA (representing the phosphorylated activated form of PDGFRα) (rabbit polyclonal; Santa Cruz Biotechnology Inc.; dilution 1:60 [APAAP]), CYR61 (rabbit polyclonal; Santa Cruz Biotechnology Inc.; dilution 1:100 [EnVision]), LIFR (rabbit polyclonal; Santa Cruz Biotechnology Inc.; dilution 1:320 [APAAP]), IGFBP7 (rabbit polyclonal; Santa Cruz Biotechnology Inc.; dilution 1:30 [APAAP]), BCL10 (mouse monoclonal; Dako; dilution 1:80 [APAAP]), p27 (mouse monoclonal; Santa Cruz Biotechnology Inc.; dilution 1:10 [APAAP]), and l-caldesmon (mouse monoclonal; Santa Cruz Biotechnology Inc.; dilution 1:40 [APAAP]) — selected because of their potential biological and clinical relevance. The specificity and optimal dilution of the antibodies had been previously assessed on the following samples: reactive lymph node, normal palatine tonsil, breast carcinoma and glioblastoma multiforme for CYR61 (34, 71); reactive lymph node, normal palatine tonsil, and Hodgkin lymphoma for PDGFRα and p-PDGFRα (72); ovarian carcinoma and reactive lymph node for LIFR (73); normal palatine tonsil for BCL10 (74), IGFBP7 (75), and l-caldesmon (76); and breast carcinoma and reactive lymph node for p27 (77). Bound antibodies were visualized by either the alkaline phosphatase antialkaline phosphatase (APAAP) complexes technique or the EnVision method (78). For negative controls, the primary antibodies were omitted.
Notably, each TMA was also tested with anti-CD20 and -CD3 antibodies in order to define the amount of reactive B cells present within the neoplastic T cell population.
Criteria for immunohistochemical marker evaluation.
Each section was independently evaluated by at least 2 experienced hematopathologists. Cases were considered positive if 30% or more of the tumor cells were stained with antibody. The number of positive cells was estimated by each observer. The intensity of staining was also evaluated, but not used to determine positivity, as it can vary with the degree of tissue fixation.
Cell culture experiments.
Neoplastic cells were isolated from the peripheral blood of 3 patients with leukemic-phase PTCL/U resistant to all conventional therapy, after immunohistochemical confirmation of PDGFRα expression. In particular, PBMCs were obtained by Ficoll-Hypaque density gradient. No further selection was required, since 95% of PBMCs corresponded to lymphomatous elements as assessed by morphology and phenotypic analysis. The cells were cultured in RPMI 1640 medium (Cambrex) supplemented by 10% FBS, with or without imatinib mesylate (kindly provided by Novartis), chosen as a PDGFRα inhibitor (79–81). The latter was applied at 3 different concentrations: 1, 5, and 10 μM. The initial cell density was 0.5 × 10⁶ per milliliter. Cell counts and vitality assessments (by trypan blue) were performed at 0, 6, 12, 24, and 48 hours. In addition, proliferation/cell cycle and apoptosis were evaluated by BrdU and annexin V assays, respectively. All experiments were performed in triplicate. As expected in resistant disease, the viability of the neoplastic cells was slightly affected by 48-hour exposure to daunorubicin. As a control, normal lymphocytes isolated from peripheral blood of healthy donors were cultured under the same experimental conditions. Most, if not all, of these cells died after daunorubicin exposure.
Analog experiments were carried out with ITF2357, a novel hydroxamic acid HDACi (kindly provided by Italfarmaco) tested at concentrations of 0.5, 1, and 5 μM. Finally, analog experiments were performed combining imatinib and ITF2357, imatinib and daunorubicin, ITF2357 and daunorubicin, and all of them together.
Supplemental material.
The categories of genes distinguishing PTCL samples in unsupervised analysis are contained in Supplemental Table 1. The genes differentially expressed in HLA-DR+ versus HLA-DR– lymphocytes and CD4 versus CD8 T cells are listed in Supplemental Tables 2 and 3, respectively. Pathologic, immunophenotypic, and histogenetic data on the 28 PTCL/U patients studied by gene expression profiling are provided in Supplemental Table 4. The up- and downregulation of genes in PTCL/U compared with normal T cells are listed in Supplemental Tables 5 and 6; the top 10 categories of genes up- and downregulated in PTCL/U, ranked according to analysis performed with EASE, are reported in Supplemental Tables 7 and 8. Genes differentially expressed in PTCL/U versus AITL and ALCL are listed in Supplemental Table 9. Supplemental Methods provides details on gene expression generation and analysis.
Supplementary Material
Acknowledgments
This work was supported in part by Associazione per la Ricerca sul Cancro (AIRC), Bologna–Associazione Italiana Leucemie e Linfomi (AIL) ONLUS, Fondazione Cassa di Risparmio in Bologna, Fondazione della Banca del Monte e Ravenna, and Ministero dell’Università e della Ricera Scientifica. P.P. Piccaluga was also supported by a Rotary International–Rotary Foundation Academic Year Scholarship, and “Vanda Vanini e Sandro Cavagnino” and “Cristina Bassi Association” grants. The authors are grateful to Vladan Milkjovic, Yonghui Zang, Francesco Alviano, Milena Piccioli, and Federica Sandri for their skilled technical assistance, and to Jeffrey Brown for kind critical revision of the manuscript and language assistance. P.P. Piccaluga and S.A. Pileri are grateful for the methodological lesson received from Alessandro Piccaluga that inspired this present study. The following clinicians and/or pathologists, listed according to their respective institutions, also contributed to the study: Stefano Ascani, Sante Tura, and Ilaria Iacobucci, Institute of Hematology and Medical Oncology “L. and A. Seràgnoli,” Bologna, Italy; Fabio Facchetti, Department of Pathology, University of Brescia, Brescia, Italy; Brunangelo Falini, Institute of Hematology, Perugia University, Perugia, Italy; Manlio Ferrarini, Division of Medical Oncology C, National Cancer Research Institute, Genoa University, Genoa, Italy; Andrea Gallamini, Hematology Unit, S. Croce and Carle Hospital, Cuneo, Italy; Domenico Novero, Department of Biomedical Science and Human Oncology, Pathologic Anatomy Section, Turin University, Turin, Italy; Marco Paulli, Department of Human and Genetic Pathology, Pathologic Anatomy Section, Pavia University, Pavia, Italy; Enrico Tagliafico and Sergio Ferrari, Department of Biomedical Sciences, University of Modena and Reggio Emilia, Emilia-Romagna, Italy; Annunziata Gloghini and Antonino Carbone, Diagnostic Immunohistochemistry and Molecular Pathology Unit, Centro di Riferimento Oncologico, Aviano/Department of Pathology, Istituto Nazionale dei Tumori, Milano, Italy.
Footnotes
Nonstandard abbreviations used: AITL, angioimmunoblastic lymphoma; ALCL, anaplastic large cell lymphoma; APAAP, alkaline phosphatase antialkaline phosphatase; B-CLL, B cell chronic lymphocytic leukemia; CYR61, cysteine-rich 61; HDACi, histone deacetylase inhibitor; PTCL, peripheral T cell lymphoma; PTCL/U, PTCL unspecified; REAL, Revised European-American Lymphoma (classification); TMA, tissue microarray.
Conflict of interest: The authors have declared that no conflict of interest exists.
Citation for this article: J. Clin. Invest. 117:823–834 (2007). doi:10.1172/JCI26833
Riccardo Dalla Favera and Stefano A. Pileri contributed equally to this work.
References
- 1. Jaffe, E.S., and Ralfkiaer, E. 2001. Pathology and genetics of tumours of haematopoietic and lymphoid tissues. IARC Press. Lyon, France. 191–194. [Google Scholar]
- 2.Kadin M.E., Berard C.W., Nanba K., Wakasa H. Lymphoproliferative diseases in Japan and Western countries: Proceedings of the United States–Japan Seminar, September 6 and 7, 1982, in Seattle, Washington. Hum. Pathol. 1983;14:745–772. doi: 10.1016/s0046-8177(83)80299-8. [DOI] [PubMed] [Google Scholar]
- 3.Harris N.L., et al. A revised European-American classification of lymphoid neoplasms: a proposal from the International Lymphoma Study Group. Blood. 1994;84:1361–1392. [PubMed] [Google Scholar]
- 4.Lopez-Guillermo A., et al. Peripheral T-cell lymphomas: initial features, natural history, and prognostic factors in a series of 174 patients diagnosed according to the R.E.A.L. Classification. Ann. Oncol. 1998;9:849–855. doi: 10.1023/a:1008418727472. [DOI] [PubMed] [Google Scholar]
- 5.Rizvi M.A., Evens A.M., Tallman M.S., Nelson B.P., Rosen S.T. T-cell non-Hodgkin lymphoma. Blood. 2006;107:1255–1264. doi: 10.1182/blood-2005-03-1306. [DOI] [PubMed] [Google Scholar]
- 6.Gisselbrecht C., et al. Prognostic significance of T-cell phenotype in aggressive non-Hodgkin’s lymphomas. Groupe d’Etudes des Lymphomes de l’Adulte (GELA). Blood. 1998;92:76–82. [PubMed] [Google Scholar]
- 7.The Non-Hodgkin’s Lymphoma Classification Project. . A clinical evaluation of the International Lymphoma Study Group classification of non-Hodgkin’s lymphoma. Blood. 1997;89:3909–3918. [PubMed] [Google Scholar]
- 8.Ascani S., et al. Peripheral T-cell lymphomas. Clinico-pathologic study of 168 cases diagnosed according to the R.E.A.L. Classification. Ann. Oncol. 1997;8:583–592. doi: 10.1023/a:1008200307625. [DOI] [PubMed] [Google Scholar]
- 9.Suchi T., et al. Histopathology and immunohistochemistry of peripheral T cell lymphomas: a proposal for their classification. J. Clin. Pathol. 1987;40:995–1015. doi: 10.1136/jcp.40.9.995. [DOI] [PMC free article] [PubMed] [Google Scholar]
- 10.Patsouris E., Engelhard M., Zwingers T., Lennert K. Lymphoepithelioid cell lymphoma (Lennert’s lymphoma): clinical features derived from analysis of 108 cases. Br. J. Haematol. 1993;84:346–348. doi: 10.1111/j.1365-2141.1993.tb03079.x. [DOI] [PubMed] [Google Scholar]
- 11.Hastrup N., Ralfkiaer E., Pallesen G. Aberrant phenotypes in peripheral T cell lymphomas. J. Clin. Pathol. 1989;42:398–402. doi: 10.1136/jcp.42.4.398. [DOI] [PMC free article] [PubMed] [Google Scholar]
- 12.Went P., et al. Marker expression in peripheral T-cell lymphoma: a proposed clinical-pathologic prognostic score. J. Clin. Oncol. 2006;24:2472–2479. doi: 10.1200/JCO.2005.03.6327. [DOI] [PubMed] [Google Scholar]
- 13.Greiner T.C., Raffeld M., Lutz C., Dick F., Jaffe E.S. Analysis of T cell receptor–gamma gene rearrangements by denaturing gradient gel electrophoresis of GC-clamped polymerase chain reaction products. Correlation with tumor-specific sequences. Am. J. Pathol. 1995;146:46–55. [PMC free article] [PubMed] [Google Scholar]
- 14.Lepretre S., et al. Chromosome abnormalities in peripheral T-cell lymphoma. Cancer Genet. Cytogenet. 2000;117:71–79. doi: 10.1016/s0165-4608(99)00151-x. [DOI] [PubMed] [Google Scholar]
- 15.Zettl A., et al. Genomic profiling of peripheral T-cell lymphoma, unspecified, and anaplastic large T-cell lymphoma delineates novel recurrent chromosomal alterations. Am. J. Pathol. 2004;164:1837–1848. doi: 10.1016/S0002-9440(10)63742-X. [DOI] [PMC free article] [PubMed] [Google Scholar]
- 16.Gallamini A., et al. Peripheral T-cell lymphoma unspecified (PTCL-U): a new prognostic model from a retrospective multicentric clinical study. Blood. 2004;103:2474–2479. doi: 10.1182/blood-2003-09-3080. [DOI] [PubMed] [Google Scholar]
- 17.Ferrando A.A., et al. Gene expression signatures define novel oncogenic pathways in T cell acute lymphoblastic leukemia. Cancer Cell. 2002;1:75–87. doi: 10.1016/s1535-6108(02)00018-1. [DOI] [PubMed] [Google Scholar]
- 18.Tracey L., et al. Mycosis fungoides shows concurrent deregulation of multiple genes involved in the TNF signaling pathway: an expression profile study. Blood. 2003;102:1042–1050. doi: 10.1182/blood-2002-11-3574. [DOI] [PubMed] [Google Scholar]
- 19.Martinez-Delgado B., et al. Expression profiling of T-cell lymphomas differentiates peripheral and lymphoblastic lymphomas and defines survival related genes. Clin. Cancer Res. 2004;10:4971–4982. doi: 10.1158/1078-0432.CCR-04-0269. [DOI] [PubMed] [Google Scholar]
- 20.Mahadevan D., et al. Transcript profiling in peripheral T-cell lymphoma, not otherwise specified, and diffuse large B-cell lymphoma identifies distinct tumor profile signatures. Mol. Cancer Ther. 2005;4:1867–1879. doi: 10.1158/1535-7163.MCT-05-0146. [DOI] [PubMed] [Google Scholar]
- 21.Ballester B., et al. Gene expression profiling identifies molecular subgroups among nodal peripheral T-cell lymphomas. Oncogene. 2006;25:1560–1570. doi: 10.1038/sj.onc.1209178. [DOI] [PubMed] [Google Scholar]
- 22. Hartigan, J.A. 1975. Clustering algorithms. John Wiley & Sons Inc. New York, New York, USA. 351 pp. [Google Scholar]
- 23.Eisen M.B., Spellman P.T., Brown P.O., Botstein D. Cluster analysis and display of genome-wide expression patterns. Proc. Natl. Acad. Sci. U. S. A. 1998;95:14863–14868. doi: 10.1073/pnas.95.25.14863. [DOI] [PMC free article] [PubMed] [Google Scholar]
- 24.Lee M.S., Hanspers K., Barker C.S., Korn A.P., McCune J.M. Gene expression profiles during human CD4+ T cell differentiation. . Int. Immunol. 2004;16:1109–1124. doi: 10.1093/intimm/dxh112. [DOI] [PubMed] [Google Scholar]
- 25.Chtanova T., et al. T follicular helper cells express a distinctive transcriptional profile, reflecting their role as non-Th1/Th2 effector cells that provide help for B cells. J. Immunol. 2004;173:68–78. doi: 10.4049/jimmunol.173.1.68. [DOI] [PubMed] [Google Scholar]
- 26.Chtanova T., et al. Identification of T cell–restricted genes, and signatures for different T cell responses, using a comprehensive collection of microarray datasets. J. Immunol. 2005;175:7837–7847. doi: 10.4049/jimmunol.175.12.7837. [DOI] [PubMed] [Google Scholar]
- 27.Hosack D.A., Dennis G., Jr., Sherman B.T., Lane H.C., Lempicki R.A. Identifying biological themes within lists of genes with EASE. Genome Biol. 2003;4:R70. doi: 10.1186/gb-2003-4-10-r70. [DOI] [PMC free article] [PubMed] [Google Scholar]
- 28.Tapper J., et al. Changes in gene expression during progression of ovarian carcinoma. Cancer Genet. Cytogenet. 2001;128:1–6. doi: 10.1016/s0165-4608(01)00386-7. [DOI] [PubMed] [Google Scholar]
- 29.Sado Y., et al. Organization and expression of basement membrane collagen IV genes and their roles in human disorders. J. Biochem. (Tokyo). 1998;123:767–776. doi: 10.1093/oxfordjournals.jbchem.a022003. [DOI] [PubMed] [Google Scholar]
- 30.van den Boom J., et al. Characterization of gene expression profiles associated with glioma progression using oligonucleotide-based microarray analysis and real-time reverse transcription-polymerase chain reaction. Am. J. Pathol. 2003;163:1033–1043. doi: 10.1016/S0002-9440(10)63463-3. [DOI] [PMC free article] [PubMed] [Google Scholar]
- 31.Schober J.M., Lau L.F., Ugarova T.P., Lam S.C. Identification of a novel integrin alphaMbeta2 binding site in CCN1 (CYR61), a matricellular protein expressed in healing wounds and atherosclerotic lesions. J. Biol. Chem. 2003;278:25808–25815. doi: 10.1074/jbc.M301534200. [DOI] [PubMed] [Google Scholar]
- 32.Leu S.J., et al. Identification of a novel integrin alpha 6 beta 1 binding site in the angiogenic inducer CCN1 (CYR61). J. Biol. Chem. 2003;278:33801–33808. doi: 10.1074/jbc.M305862200. [DOI] [PubMed] [Google Scholar]
- 33.Han J.S., Macarak E., Rosenbloom J., Chung K.C., Chaqour B. Regulation of Cyr61/CCN1 gene expression through RhoA GTPase and p38MAPK signaling pathways. Eur. J. Biochem. 2003;270:3408–3421. doi: 10.1046/j.1432-1033.2003.03723.x. [DOI] [PubMed] [Google Scholar]
- 34.Tsai M.S., Bogart D.F., Castaneda J.M., Li P., Lupu R. Cyr61 promotes breast tumorigenesis and cancer progression. Oncogene. 2002;21:8178–8185. doi: 10.1038/sj.onc.1205682. [DOI] [PubMed] [Google Scholar]
- 35.Tsai M.S., Hornby A.E., Lakins J., Lupu R. Expression and function of CYR61, an angiogenic factor, in breast cancer cell lines and tumor biopsies. Cancer Res. 2000;60:5603–5607. [PubMed] [Google Scholar]
- 36.Lin M.T., et al. Cyr61 expression confers resistance to apoptosis in breast cancer MCF-7 cells by a mechanism of NF-kappaB-dependent XIAP up-regulation. J. Biol. Chem. 2004;279:24015–24023. doi: 10.1074/jbc.M402305200. [DOI] [PubMed] [Google Scholar]
- 37.Kassem H., Sangar V., Cowan R., Clarke N., Margison G.P. A potential role of heat shock proteins and nicotinamide N-methyl transferase in predicting response to radiation in bladder cancer. Int. J. Cancer. 2002;101:454–460. doi: 10.1002/ijc.10631. [DOI] [PubMed] [Google Scholar]
- 38.Xu J., Capezzone M., Xu X., Hershman J.M. Activation of nicotinamide N-methyltransferase gene promoter by hepatocyte nuclear factor-1beta in human papillary thyroid cancer cells. Mol. Endocrinol. 2005;19:527–539. doi: 10.1210/me.2004-0215. [DOI] [PubMed] [Google Scholar]
- 39.Heldin C.H., Westermark B. Mechanism of action and in vivo role of platelet-derived growth factor. Physiol. Rev. 1999;79:1283–1316. doi: 10.1152/physrev.1999.79.4.1283. [DOI] [PubMed] [Google Scholar]
- 40.Pardanani A., Tefferi A. Imatinib targets other than bcr/abl and their clinical relevance in myeloid disorders. Blood. 2004;104:1931–1939. doi: 10.1182/blood-2004-01-0246. [DOI] [PubMed] [Google Scholar]
- 41.Jin S., et al. GADD45-induced cell cycle G2-M arrest associates with altered subcellular distribution of cyclin B1 and is independent of p38 kinase activity. Oncogene. 2002;21:8696–8704. doi: 10.1038/sj.onc.1206034. [DOI] [PubMed] [Google Scholar]
- 42.Papa S., et al. Gadd45 beta mediates the NF-kappa B suppression of JNK signalling by targeting MKK7/JNKK2. Nat. Cell Biol. 2004;6:146–153. doi: 10.1038/ncb1093. [DOI] [PubMed] [Google Scholar]
- 43.Chen F., et al. Opposite effect of NF-kappa B and c-Jun N-terminal kinase on p53-independent GADD45 induction by arsenite. . J. Biol. Chem. 2001;276:11414–11419. doi: 10.1074/jbc.M011682200. [DOI] [PubMed] [Google Scholar]
- 44.Hirose T., et al. p53-independent induction of Gadd45 by histone deacetylase inhibitor: coordinate regulation by transcription factors Oct-1 and NF-Y. Oncogene. 2003;22:7762–7773. doi: 10.1038/sj.onc.1207091. [DOI] [PubMed] [Google Scholar]
- 45.Piekarz R.L., et al. Inhibitor of histone deacetylation, depsipeptide ( FR901228), in the treatment of peripheral and cutaneous T-cell lymphoma: a case report. Blood. 2001;98:2865–2868. doi: 10.1182/blood.v98.9.2865. [DOI] [PubMed] [Google Scholar]
- 46.Tamura I., Rosenbloom J., Macarak E., Chaqour B. Regulation of Cyr61 gene expression by mechanical stretch through multiple signaling pathways. Am. J. Physiol. Cell Physiol. 2001;281:C1524–C1532. doi: 10.1152/ajpcell.2001.281.5.C1524. [DOI] [PubMed] [Google Scholar]
- 47.Jones D., et al. Recurrences in nodal T-cell lymphoma. Changes in histologic appearance and immunophenotype over the course of disease. Am. J. Clin. Pathol. 2000;114:438–447. doi: 10.1093/ajcp/114.3.438. [DOI] [PubMed] [Google Scholar]
- 48.Chadburn A., Inghirami G., Knowles D.M. T-cell activation-associated antigen expression by neoplastic T-cells. Hematol. Pathol. 1992;6:131–141. [PubMed] [Google Scholar]
- 49.Jones D., Fletcher C.D., Pulford K., Shahsafaei A., Dorfman D.M. The T-cell activation markers CD30 and OX40/CD134 are expressed in nonoverlapping subsets of peripheral T-cell lymphoma. Blood. 1999;93:3487–3493. [PubMed] [Google Scholar]
- 50.Gu J., Fujibayashi A., Yamada K.M., Sekiguchi K. Laminin-10/11 and fibronectin differentially prevent apoptosis induced by serum removal via phosphatidylinositol 3-kinase/Akt- and MEK1/ERK-dependent pathways. J. Biol. Chem. 2002;277:19922–19928. doi: 10.1074/jbc.M200383200. [DOI] [PubMed] [Google Scholar]
- 51.Tan K.O., et al. MAP-1, a novel proapoptotic protein containing a BH3-like motif that associates with Bax through its Bcl-2 homology domains. . J. Biol. Chem. 2001;276:2802–2807. doi: 10.1074/jbc.M008955200. [DOI] [PubMed] [Google Scholar]
- 52.Nagashima M., et al. A novel PHD-finger motif protein, p47ING3, modulates p53-mediated transcription, cell cycle control, and apoptosis. Oncogene. 2003;22:343–350. doi: 10.1038/sj.onc.1206115. [DOI] [PubMed] [Google Scholar]
- 53.Gunduz M., et al. Allelic loss and reduced expression of the ING3, a candidate tumor suppressor gene at 7q31, in human head and neck cancers. Oncogene. 2002;21:4462–4470. doi: 10.1038/sj.onc.1205540. [DOI] [PubMed] [Google Scholar]
- 54.Peng B., et al. Pharmacokinetics and pharmacodynamics of imatinib in a phase I trial with chronic myeloid leukemia patients. J. Clin. Oncol. 2004;22:935–942. doi: 10.1200/JCO.2004.03.050. [DOI] [PubMed] [Google Scholar]
- 55.Basciani S., et al. Imatinib mesylate inhibits Leydig cell tumor growth: evidence for in vitro and in vivo activity. Cancer Res. 2005;65:1897–1903. doi: 10.1158/0008-5472.CAN-04-2181. [DOI] [PubMed] [Google Scholar]
- 56.Decaudin D., et al. In vivo efficacy of STI571 in xenografted human small cell lung cancer alone or combined with chemotherapy. Int. J. Cancer. 2005;113:849–856. doi: 10.1002/ijc.20652. [DOI] [PubMed] [Google Scholar]
- 57.Sanchez-Gonzalez B., et al. Antileukemia activity of the combination of an anthracycline with a histone deacetylase inhibitor. Blood. 2006;108:1174–1182. doi: 10.1182/blood-2005-09-008086. [DOI] [PMC free article] [PubMed] [Google Scholar]
- 58.Martinez-Delgado B., et al. Differential expression of NF-kappaB pathway genes among peripheral T-cell lymphomas. Leukemia. 2005;19:2254–2263. doi: 10.1038/sj.leu.2403960. [DOI] [PubMed] [Google Scholar]
- 59.Gotlib J., et al. The FIP1L1-PDGFRalpha fusion tyrosine kinase in hypereosinophilic syndrome and chronic eosinophilic leukemia: implications for diagnosis, classification, and management. Blood. 2004;103:2879–2891. doi: 10.1182/blood-2003-06-1824. [DOI] [PubMed] [Google Scholar]
- 60.George D. Targeting PDGF receptors in cancer: rationales and proof of concept clinical trials. Adv. Exp. Med. Biol. 2003;532:141–151. doi: 10.1007/978-1-4615-0081-0_12. [DOI] [PubMed] [Google Scholar]
- 61.Heinrich M.C., et al. Kinase mutations and imatinib response in patients with metastatic gastrointestinal stromal tumor. J. Clin. Oncol. 2003;21:4342–4349. doi: 10.1200/JCO.2003.04.190. [DOI] [PubMed] [Google Scholar]
- 62.Stone R.M., Gilliland D.G., Klion A.D. Platelet-derived growth factor receptor inhibition to treat idiopathic hypereosinophilic syndrome. Semin. Oncol. 2004;31:12–17. doi: 10.1053/j.seminoncol.2004.03.035. [DOI] [PubMed] [Google Scholar]
- 63.Pardanani A., et al. Imatinib therapy for hypereosinophilic syndrome and other eosinophilic disorders. Blood. 2003;101:3391–3397. doi: 10.1182/blood-2002-10-3103. [DOI] [PubMed] [Google Scholar]
- 64.Klein U., et al. Gene expression profiling of B cell chronic lymphocytic leukemia reveals a homogeneous phenotype related to memory B cells. . J. Exp. Med. 2001;194:1625–1638. doi: 10.1084/jem.194.11.1625. [DOI] [PMC free article] [PubMed] [Google Scholar]
- 65.Liu C.G., et al. An oligonucleotide microchip for genome-wide microRNA profiling in human and mouse tissues. Proc. Natl. Acad. Sci. U. S. A. 2004;101:9740–9744. doi: 10.1073/pnas.0403293101. [DOI] [PMC free article] [PubMed] [Google Scholar]
- 66.Basso K., et al. Gene expression profiling of hairy cell leukemia reveals a phenotype related to memory B cells with altered expression of chemokine and adhesion receptors. J. Exp. Med. 2004;199:59–68. doi: 10.1084/jem.20031175. [DOI] [PMC free article] [PubMed] [Google Scholar]
- 67.Califano A. SPLASH: structural pattern localization analysis by sequential histograms. Bioinformatics. 2000;16:341–357. doi: 10.1093/bioinformatics/16.4.341. [DOI] [PubMed] [Google Scholar]
- 68.Califano A., Stolovitzky G., Tu Y. Analysis of gene expression microarrays for phenotype classification. Proc. Int. Conf. Intell. Syst. Mol. Biol. 2000;8:75–85. [PubMed] [Google Scholar]
- 69.Jenssen T.K., Laegreid A., Komorowski J., Hovig E. A literature network of human genes for high-throughput analysis of gene expression. Nat. Genet. 2001;28:21–28. doi: 10.1038/ng0501-21. [DOI] [PubMed] [Google Scholar]
- 70.Pileri S.A., et al. Antigen retrieval techniques in immunohistochemistry: comparison of different methods. J. Pathol. 1997;183:116–123. doi: 10.1002/(SICI)1096-9896(199709)183:1<116::AID-PATH1087>3.0.CO;2-2. [DOI] [PubMed] [Google Scholar]
- 71.Xie D., et al. Levels of expression of CYR61 and CTGF are prognostic for tumor progression and survival of individuals with gliomas. Clin. Cancer Res. 2004;10:2072–2081. doi: 10.1158/1078-0432.ccr-0659-03. [DOI] [PubMed] [Google Scholar]
- 72.Brown R.E., Nazmi R.K. The Reed-Steinberg cell: molecular characterization by proteomic analysis with therapeutic implications. Ann. Clin. Lab. Sci. 2002;32:339–351. [PubMed] [Google Scholar]
- 73.Savarese T.M., et al. Coexpression of oncostatin M and its receptors and evidence for STAT3 activation in human ovarian carcinomas. Cytokine. 2002;17:324–334. doi: 10.1006/cyto.2002.1022. [DOI] [PubMed] [Google Scholar]
- 74.Ye H., et al. BCL10 expression in normal and neoplastic lymphoid tissue. Nuclear localization in MALT lymphoma. Am. J. Pathol. 2000;157:1147–1154. doi: 10.1016/S0002-9440(10)64630-5. [DOI] [PMC free article] [PubMed] [Google Scholar]
- 75.Degeorges A., Wang F., Frierson H.F., Jr., Seth A., Sikes R.A. Distribution of IGFBP-rP1 in normal human tissues. J. Histochem. Cytochem. 2000;48:747–754. doi: 10.1177/002215540004800603. [DOI] [PubMed] [Google Scholar]
- 76.Zheng P.P., et al. Differential expression of splicing variants of the human caldesmon gene (CALD1) in glioma neovascularization versus normal brain microvasculature. Am. J. Pathol. 2004;164:2217–2228. doi: 10.1016/S0002-9440(10)63778-9. [DOI] [PMC free article] [PubMed] [Google Scholar]
- 77.Fredersdorf S., et al. High level expression of p27(kip1) and cyclin D1 in some human breast cancer cells: inverse correlation between the expression of p27(kip1) and degree of malignancy in human breast and colorectal cancers. Proc. Natl. Acad. Sci. U. S. A. 1997;94:6380–6385. doi: 10.1073/pnas.94.12.6380. [DOI] [PMC free article] [PubMed] [Google Scholar]
- 78.Sabattini E., et al. The EnVision++ system: a new immunohistochemical method for diagnostics and research. Critical comparison with the APAAP, ChemMate, CSA, LABC, and SABC techniques. . J. Clin. Pathol. 1998;51:506–511. doi: 10.1136/jcp.51.7.506. [DOI] [PMC free article] [PubMed] [Google Scholar]
- 79.Cools J., Stover E.H., Wlodarska I., Marynen P., Gilliland D.G. The FIP1L1-PDGFRalpha kinase in hypereosinophilic syndrome and chronic eosinophilic leukemia. Curr. Opin. Hematol. 2004;11:51–57. doi: 10.1097/00062752-200401000-00008. [DOI] [PubMed] [Google Scholar]
- 80.Gilliland G., Cools J., Stover E.H., Wlodarska I., Marynen P. FIP1L1-PDGFRalpha in hypereosinophilic syndrome and mastocytosis. Hematol. J. 2004;5(Suppl. 3):S133–S137. doi: 10.1038/sj.thj.6200439. [DOI] [PubMed] [Google Scholar]
- 81.Lev D.C., et al. 2005Inhibition of platelet-derived growth factor receptor signaling restricts the growth of human breast cancer in the bone of nude mice. Clin. Cancer Res. 11306 – 314. [PubMed] [Google Scholar]
Associated Data
This section collects any data citations, data availability statements, or supplementary materials included in this article.


