

Abstract
The dependence of fMRI activation on sound level was examined throughout the auditory pathway of normal human listeners using continuous broadband noise, a stimulus widely used in neuroscientific investigations of auditory processing, but largely neglected in neuro-imaging. Several specialized techniques were combined here for the first time to enhance detection of brainstem activation, mitigate scanner noise, and recover temporal resolution lost by the mitigation technique. The main finding was increased activation with increasing level in cochlear nucleus, superior olive, inferior colliculus, medial geniculate body and auditory cortical areas. We suggest that these increases reflect monotonically increasing activity in a preponderance of individual auditory neurons responsive to broadband noise. While the time-course of activation changed with level, the change was subtle and only significant in a part of the cortex. To our knowledge, these are the first fMRI data showing the effects of sound level in subcortical centers or for a non-tonal, non-speech stimulus at any stage of the pathway. The present results add to the body of parametric data in normal human listeners and are fundamental to the design of any fMRI experiment employing continuous noise.
Keywords: BOLD, Sound intensity, Level coding, Cardiac gating, Sparse imaging, Interleaved sampling
1. Introduction
The present study examined the dependence of fMRI activation on sound level in the auditory pathway of normal human listeners. Our goal was to expand the body of parametric fMRI data available for designing auditory neuro-imaging experiments. Our choice of stimulus was largely motivated by our interest in using continuous noise, a common tinnitus masker, as a stimulus in fMRI studies of tinnitus. As an aid in designing these experiments, we wanted to determine how continuous noise normally activates the auditory pathway in fMRI. While continuous noise is widely used in the classical auditory literature, it has been largely neglected in neuro-imaging.
The present study differs from previous work on the level dependence of fMRI activation not only in its choice of stimulus but in its examination of subcortical as well as cortical structures. The existing fMRI literature on sound-level dependencies focuses exclusively on cortical areas (Millen et al., 1995; Jäncke et al., 1998; Mohr et al., 1999; Bilecen et al., 2002; Brechmann et al., 2002; Hall et al., 2001; Hart et al., 2002; Lasota et al., 2003; Hart et al., 2003; Mulert et al., 2005). In this study, we determined the level-dependence of fMRI activation at every major auditory processing stage – brainstem, thalamus, and cortex.
Our experiments used a combination of three techniques to obtain reliable auditory activation in the hostile acoustic environment of the scanner and do so both subcortically and cortically. While these techniques are often used alone or in pairs in auditory fMRI studies, this, to our knowledge, is the first use of all three together. First, to improve the detection of brainstem activation, image acquisitions were synchronized to the subject's cardiac cycle (Guimaraes et al., 1998). Second, to prevent contamination from the sounds produced by the scanner, a sparse imaging protocol was used i.e., images were acquired in brief clusters (<1 s) separated by long intervals (∼8 s) of quiet (Edmister et al., 1999; Hall et al., 1999). Finally, to recover the temporal resolution lost by sparse imaging, the timing of image acquisitions was staggered across stimulus presentations (Belin et al., 1999; Harms et al., 2005). This recovery of temporal resolution allowed us to study the time course of activation in addition to the magnitude. The existing neuro-imaging literature on level-dependencies focuses primarily on magnitude (and/or the related variable, activation extent). The motivation for also examining the time course comes from observations that the time course of activation in auditory cortex can change substantially for some acoustic stimulus variations i.e., from sustained (activation remains elevated throughout stimulus presentation) to phasic (activation peaks just after stimulus onset and offset; Giraud et al., 2000; Harms and Melcher, 2002).1 The combination of chosen techniques revealed increases in fMRI activation with increasing continuous noise level throughout the auditory pathway (in cochlear nucleus (CN), superior olivary complex (SOC), inferior colliculus (IC), medial geniculate body (MGB), and primary and non-primary cortical areas).
2. Methods
2.1. Subjects
Five subjects (24–38 years; 4 male; all right-handed) each participated in one imaging session. Subjects had no known neurological disorders and no tinnitus. Hearing thresholds of all subjects were normal (<20 dB HL) at all standard audiological frequencies from 250 to 8000 Hz.
This study was approved by the institutional committees on the use of human subjects at the Massachusetts Institute of Technology, Massachusetts Eye and Ear Infirmary, and Massachusetts General Hospital. All subjects gave their written informed consent.
2.2. Acoustic stimulation
Broadband continuous noise was presented binaurally at 30, 50 and 70 dB sensation level (SL; 50–99 dB SPL) referenced to threshold measured in the scanner room (outside the scanner and in the absence of scanner-generated acoustic noise) separately for each ear. Stimuli at all levels were clearly audible during functional imaging and did not exceed the subject's comfort level.
Stimuli were alternately turned on for 30 s and off for 30 s in a standard fMRI block paradigm. Four on/off repetitions comprised a scanning “run”. For every imaging session, subjects were presented with 4 runs at each stimulus level. Stimuli were generated by a digital-to-analog board (running under LabVIEW), amplified, and fed to a pair of audio piezoelectric transducers housed in earmuffs that attenuated the scanner sounds by approximately 30 dB (Ravicz and Melcher, 2001). Subjects were instructed not to move and to attend to the stimuli.
2.3. Imaging
Subjects were imaged in a 3 Tesla (Siemens Allegra) scanner using a transmit/receive head coil. In each imaging session: (1) Contiguous sagittal images of the whole head were acquired. (2) The brain slices to be functionally imaged were selected based on the sagittal images. Eleven parallel near-coronal slices covered the brainstem, thalamus and temporal lobe. (3) T1-weighted, high resolution anatomical images were acquired of the selected brain slices for subsequent overlay of the functional data (thickness = 4 mm; gap = 1 mm; in-plane resolution = 0.78 × 0.78 mm; TR = 700 ms; TI = 930 ms; TE = 12 ms). (4) Functional images were acquired using a blood oxygenation level-dependent (BOLD) sequence (gradient echo, TE = 30 ms, flip = 90°, slice thickness = 4 mm; gap = 1 mm, in-plane resolution = 3.125 × 3.125 mm). Images of the eleven selected slices were acquired in brief (<1 s) clusters with a TR of approximately 8 s (Fig. 1). The onset of stimulus presentation was delayed by 0, 2, 4 or 6 s relative to the first cluster of each run, so the effective temporal sampling interval within the overall data set was approximately 2 s. Four runs (one for each delay) were collected at each stimulus level, yielding 156 images per level. Functional image acquisition was synchronized to the first QRS complex following a minimum inter-image interval of 7.5 s, yielding a TR of 8036 ± 305 ms (Guimaraes et al., 1998). The scanner coolant pump, which generates on-going low-frequency noise, was turned off during functional imaging (and threshold measurement).
Fig. 1.

The experimental paradigm. Top: Broadband continuous noise was presented during four 30 s-long epochs (gray) separated by 30 s “stimulus off” periods. Bottom: Images of eleven slices were acquired in clusters (each represented by a single vertical line) spaced by a long TR. The start of the stimulus presentation was delayed by Δ (0, 2, 4, or 6 s) relative to the first cluster of image acquisitions.
2.4. Detecting activation
The functional image data were first corrected for any head movements that may have occurred over the course of the imaging session using standard software (SPM95; Friston et al., 1995). Activation was then detected using a general linear model which operated on a set of basis functions designed to reflect different temporal components of fMRI activation in the auditory system (Harms and Melcher, 2003). This approach models the signal vs. time within each voxel as a weighted sum of basis functions, and identifies “active” voxels based on the goodness of fit of this model. Activation maps were created for each stimulus and sound level by estimating (using an F-statistic; Fomby et al., 1984), for every voxel, whether the amplitude of any of the basis functions is significantly different from zero.
2.5. Defining regions of interest
Activation was analyzed within regions of interest (ROIs) defined using gross anatomical landmarks and measurements obtained from atlases based on postmortem tissue. ROIs were first identified in the high-resolution, T1-weighted MRI images (in-plane resolution 0.78 × 0.78 mm). They were then down-sampled to the lower resolution of the functional images (3.125 × 3.125 mm) to yield the ROIs used for all subsequent analyses.
Cortical ROIs were defined based on 3 D reconstructions of the temporal lobes for each subject (created using FreeSurfer, Fischl et al., 1999; Dale et al., 1999; Fig. 2). Since, at present, there is no definitive approach for parcellating living human auditory cortex into its major divisions (e.g., primary auditory cortex surrounded by medial and lateral belt), we adopted an approach that approximated these divisions using gross anatomy as a guide. HGpm was defined as the postero-medial two-thirds of the first (i.e., most anterior) Heschl's gyrus and was intended to approximate primary auditory cortex, which typically overlaps this part of the gyrus in histological studies in humans (Rademacher et al., 1993). HGal was the remaining antero-lateral one-third of the first Heschl's gyrus and was defined to approximate primary-like areas on the gyrus. PT (planum temporale) covers the superior temporal cortex lateral and posterior to the transverse temporal sulcus (without extending onto the lateral face of the temporal lobe) and approximates the lateral belt of auditory cortex. Posteriorly, PT was limited by the vertical wall of the temporo-parietal cortex, and anteriorly it extended to the antero-lateral limit of the most lateral Heschl's gyrus (either first or second). AMA (antero-medial area) was located antero-medial to Heschl's gyrus and approximated the medial belt. It was limited medially by the circular sulcus, and anteriorly by an imaginary line extending perpendicularly from the circular sulcus to the anterior limit of the first Heschl's gyrus. Whenever there was a second Heschl's gyrus (6/10 hemispheres), it was excluded from the analyses. On average, the number of voxels in each cortical ROI was: 44 in HGpm, 27 in HGal, 107 in PT and 54 in AMA.
Fig. 2.

Regions of interest in auditory cortex superimposed on a 3D reconstruction of the superior temporal plane (left hemisphere, Subj. 1).
The ROIs for subcortical structures were defined using histological atlases as described in detail in the fMRI study of Hawley et al. (2005). The CN ROI was located immediately rostral to the pontomedullary junction at the caudal edge of the pons (Fig. 3, bottom). The medial and lateral limits were 6 and 15 mm from the midline. The SOC ROI (located medial and rostral to the CN) was approximately 7 mm rostral to the pontomedullary junction and had medial and lateral limits 3 mm and 9 mm from the midline (Fig. 3, second from the bottom). The ICs were readily identified as distinct anatomical circular areas (Fig. 3, third from the bottom). The MGB ROI lay at the caudal edge of the thalamus abutting the ambient cistern (Fig. 3, fourth from the bottom). The lateral edge of the mid-brain defined the medial boundary of this ROI. The lateral boundary was defined to be two-thirds of the distance from the lateral edge of the midbrain to the lateral edge of the ambient cistern measured at its superior border. On average, the number of voxels in each subcortical ROI was: 9 in CN, 6 in SOC, 12 in IC and 16 in MGB.
Fig. 3.
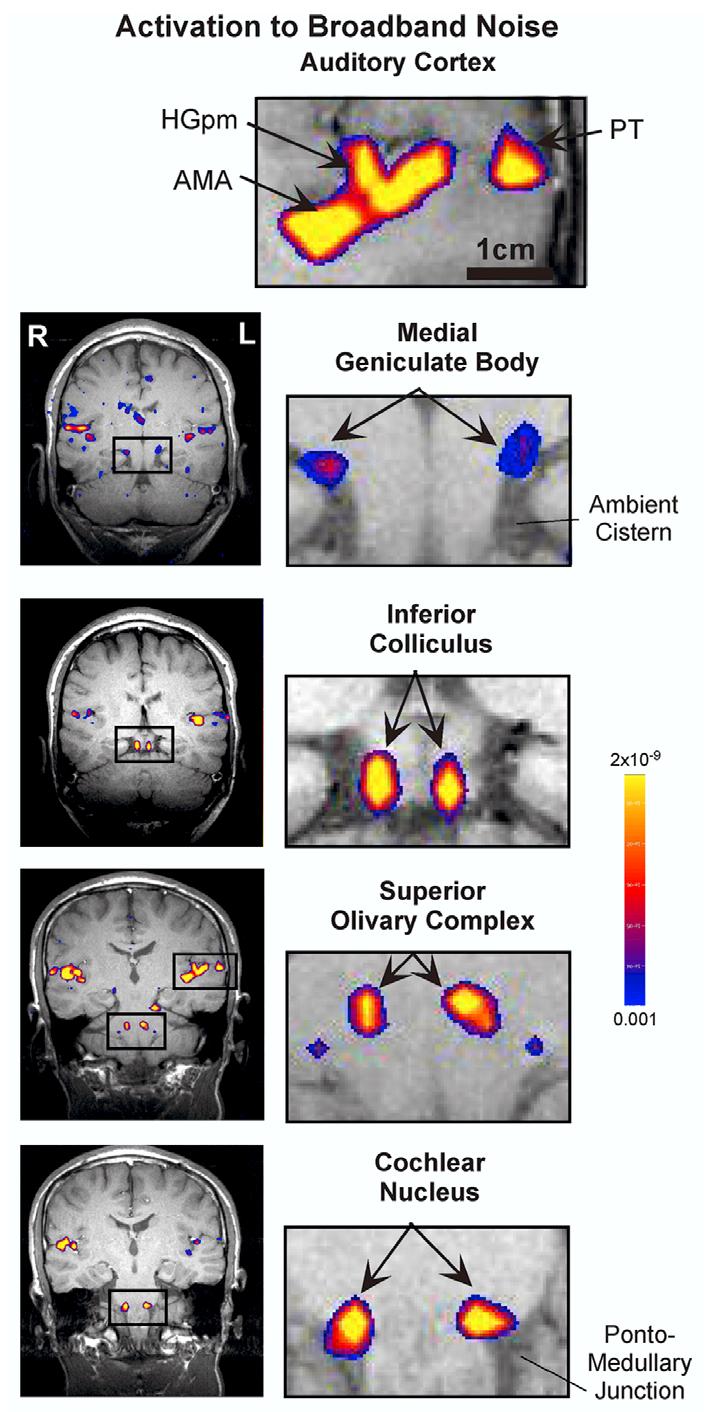
Activation in major auditory centers throughout the human auditory pathway. The stimulus was broadband continuous noise presented binaurally. Panels on the right are enlargements of the insets on the left. (The enlargement for cortex (top, right) corresponds to the upper right inset in the panel next to the SOC enlargement.) Activation (color) is thresholded at p < 0.001 and is superimposed on a T1-weighted anatomical (grayscale) image. Each panel shows data from a single subject (not the same for all panels). Stimulus level: 70 dB SL (for all but one panel) or 50 dB (IC panel). In the SOC panel, the small blue circles inferior and lateral to the SOC reflect activation in the CNs, which were partly intersected by this slice. Both the activation maps (in-plane resolution of 3.1 × 3.1 mm) and the anatomical images (1.5 × 1.5 mm) have been interpolated for these displays. The scale bar shown in the top right panel applies to all panels on the right.
2.6. Quantification of activation
Within each ROI, activation was quantified for voxels that achieved significant (p < 0.01) change in image signal for at least one sound level. For these voxels, an activation time course was calculated for each level as a weighted sum of basis functions (weighting determined by the GLM) and averaged across voxels. Amplitudes were then converted to percent change relative to baseline (an average across all stimulus off conditions at a given level). Activation magnitude was calculated from the time courses as (1) the maximum percent change occurring within 12 s of stimulus onset (“onset” percent change), and (2) the maximum percent change within 12 s of stimulus offset (“offset” percent change). One subject did not show SOC activation at any stimulus level (p > 0.05 for all voxels in the SOC ROI) and was therefore excluded from the analyses for SOC.
In addition to the primary analysis just described, two supplementary analyses were conducted using different criteria to select the voxels for quantification. One criterion identified only the most highly activated voxels within each ROI. For subcortical structures, this was the single voxel with the lowest p-value at 70 dB SL. For cortical ROIs, these were the three lowest p-value voxels at 70 dB. A second criterion identified the voxels for quantification separately for each stimulus level (i.e., for each level, magnitude and time course were calculated from voxels with p < 0.01 (for subcortical structures) or p < 0.001 (cortical structures) at that level).
A third supplementary analysis examined the extent of activation vs. sound level. Extent was quantified as the number of voxels with p < 0.01.
The shape of the time course of activation was quantified using a single numerical value, a “waveshape index” (WI). The WI, calculated from the basis function amplitudes, describes responses on a continuum from completely sustained (WI = 0) to completely phasic (WI = 1) (details in Harms and Melcher, 2003).
3. Results
Broadband continuous noise evoked activation in four subcortical structures (CN, SOC, IC, MGB) and four cortical areas (HGpm, HGal, AMA, and PT). Sample activation is shown in Fig. 3. Activation was reliably evoked in individuals. Specifically, for every subject and structure, at least 2 out of 3 stimulus levels produced significant activation (p < 0.01). The only exception was the SOC in one subject (see Methods).
3.1. Activation magnitude vs. stimulus level
The magnitude of activation increased with increasing stimulus level in every studied structure (Figs. 4-6). The increases were quantified in terms of: (1) onset percent change, a measure that captured the peak in activation that often occurred early during the stimulus, and (2) offset percent change, a measure that captured either the magnitude of activation at the time of stimulus offset (e.g., in CN, SOC, MGB at 30 dB) or the peak in activation occurring just after stimulus offset (e.g., in AMA, PT and MGB at 70 dB). For each ROI, these measures were averaged across all voxels that were significantly (p < 0.01) activated by at least one sound level. All structures, both cortical and subcortical, showed an increase in both onset and offset percent change when stimulus level was increased from 30 to 70 dB SL (average across subjects and sides; Fig. 6). In most structures, the increase for one or both measures was significant at p < 0.05 (black and intermediate shading in Fig. 6; rank sum test). The only exception was AMA, which showed an increase in offset percent change of borderline significance and no significant change in onset percent change. Activation increased monotonically with level in approximately half of the individual subjects and sides, a trend reflected in the average. In all structures, onset percent change, averaged across subjects and sides, increased monotonically from 30 to 50 to 70 dB (Fig. 5; The increases from 30 to 50 and from 50 to 70 dB were not statistically significant for most structures). Offset percent change, similarly averaged, also generally increased monotonically (not shown). The only exception was a non-significant decrease between 50 and 70 dB in MGB. Overall, the predominant trend throughout the auditory pathway was one of increasing activation with increasing stimulus level.
Fig. 4.

Time course of activation for different auditory structures at 30 (dashed line) and 70 (solid line) dB SL. Each time course is an average across subjects and sides (i.e., left and right). Dark gray shading shows ± one standard error of the mean (SEM) for the 70 dB time courses, and crossed hatching shows ± one SEM for the 30 dB time courses. Each subject and side was considered a separate data point in calculating SEM. Time course of activation for 50 dB SL (not shown) was intermediate between those for 30 and 70 dB SL.
Fig. 6.

Tabulation of activation magnitude and waveshape for each auditory structure and two sound levels (30 and 70 dB SL). The value (magnitude or WI) given for each structure and level is an average across subjects and sides. The shading at the bottom of each cell indicates the p-value result of a rank sum comparison of the 30 and 70 dB data.
Fig. 5.
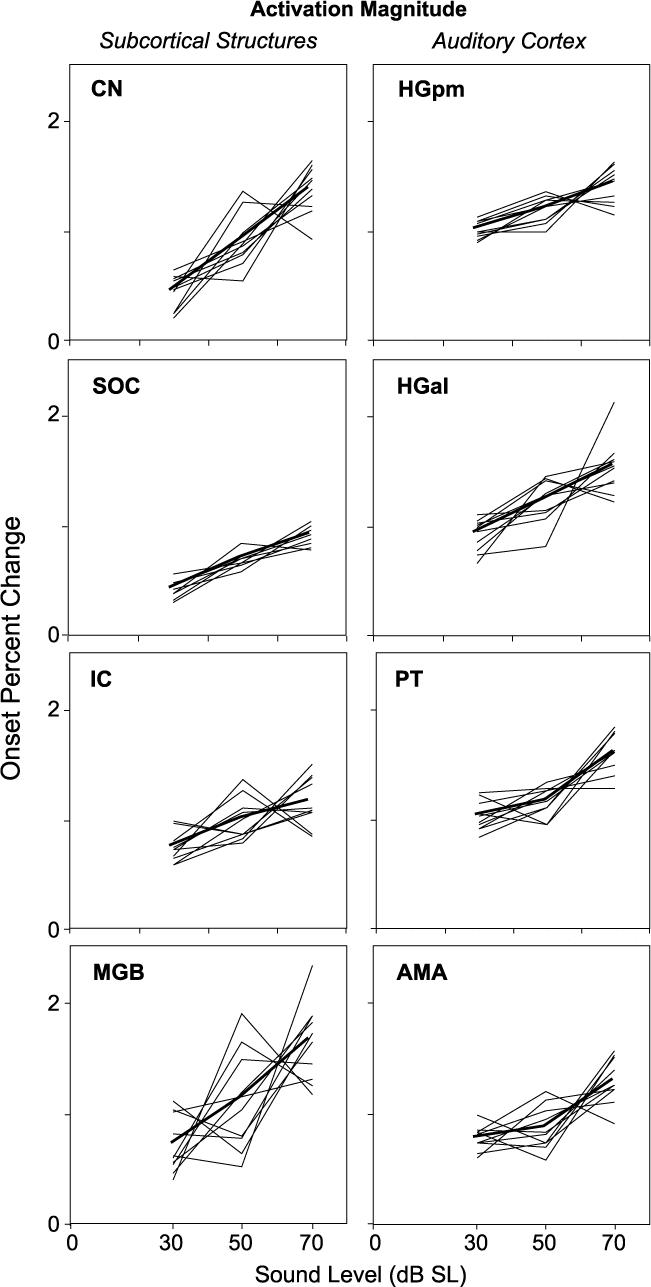
Activation magnitude as a function of sound level in subcortical (left) and cortical (right) centers. Thin lines show onset percent change vs. level for individual subjects and sides; thick lines show the average. To facilitate examination of the trends vs. level, the individual curves in each panel have been displaced vertically by subtracting the mean across levels for the individual curve and adding the mean across levels averaged across subjects and sides. Averaged level function was not affected by this procedure.
An increase in activation with level was also seen using several alternative analysis procedures. For instance, both onset and offset percent change, calculated for various subsets of voxels (defined according to different criteria; see Methods for details) increased progressively with level, on average, and differed significantly between 30 and 70 dB in every structure. An analysis of activation extent showed a significant difference between 30 and 70 dB SL in most structures. The increase with level was usually progressive (i.e., monotonic). However, in two structures (MGB and AMA) there was a dip (nonsignificant) in activation extent for the intermediate sound level, 50 dB SL.
3.2. Activation time-course vs. stimulus level
In cortical areas, as well as some subcortical structures, there was a tendency for the time course of activation to change with increasing stimulus level, but the tendency was slight and generally not significant (Fig. 4). In the CN and MGB, the change was seen mainly as the emergence with increasing level of a peak shortly after stimulus onset. In cortical areas, it was seen as an increase in an already existing (at 30 dB) onset peak accompanied by the emergence of a peak just after stimulus offset (most easily seen in the time course for AMA, Fig. 4, bottom right). Analyses of a quantitative measure of time course waveshape (WI) revealed that the change in waveshape was not significant in most structures, reflecting the subtlety of the waveshape change with level (Fig. 6). In two structures, AMA and PT, the change in WI with level, while small, was repeatable and therefore approached (PT) or reached (AMA) statistical significance.
In addition to the generally non-significant changes in time course with stimulus level, there were also differences in time course between structures, especially at higher sound levels. At 70 dB, almost every subject and side showed lower WI values for brainstem structures than for MGB (CN: 9/10, p = 0.02, SOC: 7/8, p = 0.03, IC: 10/10, p < 0.001; sign test). The WI values for MGB were comparable to those for regions on Heschl's gyrus (HGpm, HGal), but were almost always less than those for non-Heschl's gyrus regions of the auditory cortex (AMA: 10/10, p = 0.001; PT: 9/10, p = 0.02). The overall difference in WI between brainstem, thalamus and cortex can be seen from the average WI values in Fig. 6.
3.3. Location of active voxels within cortical areas
Although not a primary goal for the present study, we also qualitatively examined the cortical data for systematic relationships between sound level and the location of activation (i.e., ampliotopy). The location of the most significantly activated voxels did not show a systematic shift in position with increasing level in any cortical area and usually remained stationary across levels. Furthermore, we did not observe any systematic shifts in the overall activated volume. On the contrary, the activated volume appeared to grow approximately equally in all directions and showed a high degree of overlap across sound levels. In any given area, voxels activated at 70 dB contained at least 74% of the voxels activated at 50 dB, and at least 80% of the voxels activated at 30 dB. In summary, for the stimulus and levels used, there was no obvious ampliotopic organization in any cortical area.
4. Discussion
Our results show increases in fMRI activation with increasing continuous noise level at every major stage of auditory processing i.e., in brainstem, thalamic and cortical structures. Our results also show some changes in the time course of activation i.e. a shift from more sustained to more phasic responses with increasing sound level. However, these changes were not statistically significant in subcortical centers and only approached or reached significance in two cortical areas (PT and AMA). To our knowledge, these are the first fMRI data showing the effects of sound level in subcortical auditory centers, and the first showing the effects for a non-tonal, non-speech stimulus at any stage of the pathway.
4.1. Comparison to previous imaging studies of sound level
While there are no previous fMRI data on the level-dependence of activation in subcortical structures, one PET study did report data on subcortical level effects. Using 500 and 4000 Hz tones, Lockwood et al. (1999) showed greater PET activation at high, as compared to low sound levels in the brainstem and thalamus (as well as cortex). While the activation in that study could not be definitively localized to specific auditory nuclei because of relatively low spatial resolution, it overlapped all but the lowest part of the subcortical auditory pathway (i.e., the CN), suggesting that much of the subcortical auditory system shows activation increases with increasing level for tonal stimuli. Our results show that activation in subcortical structures also increases with increasing level of a broadband stimulus.
In contrast to subcortical structures, auditory cortex has been examined in a substantial number of fMRI studies concerning sound-level dependencies (Millen et al., 1995; Jäncke et al., 1998; Mohr et al., 1999; Bilecen et al., 2002; Brechmann et al., 2002; Hall et al., 2001; Hart et al., 2002; Lasota et al., 2003; Hart et al., 2003; Mulert et al., 2005). All of these showed increases in fMRI activation magnitude and/or extent with increasing level using pure tone, complex tone, frequency modulated or speech stimuli. The cortical PET data of Lockwood et al. (1999) also show this trend.
Most fMRI and PET studies of sound level (including the present one) examined activation for widely-spaced levels (usually 20 dB). However, one set of studies did examine the dependence of cortical activation on pure tone level using finer level increments (6 dB; Hart et al., 2002, 2003). While the precise shape and growth rate of these detailed activation vs. level functions differed with tone frequency (Hart et al., 2003) and between cortical areas (Hart et al., 2002), there was still always an overall trend of increased activation with increasing level. Thus, the overall impression from all of the pertinent fMRI and PET data, including those of the present study, is one of increasing cortical activation with increasing sound level.
Whether an ampliotopic organization exists in human auditory cortex is another topic raised in neuro-imaging studies of sound level. Among the previous fMRI and PET studies that looked for evidence of an ampliotopic organization, the results are mixed. Some have reported evidence for ampliotopy (Lockwood et al., 1999; Bilecen et al., 2002), but others have not (Hart et al., 2002). The present study falls in the latter category since no apparent shifts in activation location with level were observed.
4.2. Neural mechanisms behind fMRI activation level dependencies
While the hemodynamic processes linking fMRI activation to neural activity are still being worked out, it is generally acknowledged that activation increases and decreases reflect concordant changes in neural activity of mainly synaptic origin (Logothetis et al., 2001; Arthurs and Boniface, 2002; see also Nudo and Masterton, 1986). Because of the resolution of functional images, fMRI effectively sums this neural activity over a spatial scale of millimeters. Thus, in the present study, the increases in fMRI activation with sound level presumably reflect increases in population neural activity of each studied structure.
While only a small number of microelectrode studies have used broadband noise to study sound level, there are some data with which to compare the present fMRI findings, in particular data on neuronal discharge rate vs. noise level. (Note that discharge data are relevant here, even though fMRI likely reflects mainly synaptic activity, because the discharges of one neuron indicate the synaptic activity of another.) Rate-level functions for noise have been found to be either monotonic (discharge rate increases with increasing noise level) or non-monotonic (discharge rate increases then decreases with increasing level; Phillips et al., 1985,; Imig et al., 1990; Aitkin, 1991; Clarey et al., 1994; Kajikawa et al., 2005). However, those responding monotonically to noise appear to be in the substantial majority throughout the auditory pathway (Phillips et al., 1985; Schreiner and Mendelson, 1990; Aitkin, 1991; Clarey et al., 1994; Kajikawa et al., 2005). Thus, it is not surprising that fMRI activation, an indicator of the summed activity of neural populations, would also show monotonic dependencies on noise level in all studied structures, from cochlear nucleus to auditory cortex. Based on the (limited) available microelectrode data, we suggest that the monotonic increases in fMRI activation with increasing broadband noise level seen in the present study reflect a preponderance of individual neurons with monotonic level dependencies for noise.
While tones, like noise, produce increases in fMRI activation with increasing level in auditory cortex (Hall et al., 2001; Hart et al., 2002, 2003), the level-dependencies of the underlying single neuron activity may be somewhat different. In contrast to the predominantly monotonic neuronal rate-level functions produced by noise in auditory cortex, there is a high proportion of non-monotonic rate-level functions for tones (Phillips et al., 1985,; Phillips et al., 1994; Heil et al., 1994). Thus, neurons showing non-monotonic behavior, as well as those showing monotonic behavior, may contribute substantially to the level dependence of cortical fMRI activation for tones.
4.3. Possible effects of attention
The present study was designed to determine the level dependence of activation during passive listening (subjects performed no overt task) and did not attempt to separate the effects of attention on activation from the effects of sound level per se. Nevertheless, it is worth considering what the effects of attention might have been, particularly since they may have co-varied with stimulus level. For instance, one possibility is that subjects' attention was particularly drawn to the stimuli perceived to be loudest (i.e., 70 dB SL). Another possibility is that subjects, in attempting to diligently follow the instructions (“attend to the stimuli”), paid especially close attention to the softest sound (i.e., 30 dB SL, although it was clearly audible). Since tasks promoting attention to a sound generally increase the fMRI activation produced by that sound (e.g., Grady et al., 1997; Jäncke et al., 1999), the first possibility would most likely enhance the level dependencies seen in the data by enhancing activation at higher stimulus levels. However, the second possibility would likely produce the opposite effect (enhance activation at lower levels) and thus suppress an increase in activation with sound level. Thus, no definitive prediction can be made concerning the influence of attention in our experiments. We can, however, say that, if attentional effects were operative, they were either insufficient in magnitude or sufficiently consistent across subjects to produce a common trend of increased activation from the lowest to highest sound level. We can also say that any effects were likely less in brainstem than cortical areas, where attention is generally believed to have its main influence. Thus, it is possible that differences in attention across stimulus levels influenced our results, particularly those for cortex. However, irrespective of this, the primary result of the present study stands: during passive listening, structures throughout the auditory pathway manifested greater activation at higher sound levels.
4.4. Time-course of activation: comparison with previous observations
The present study is generally consistent with two previous observations concerning the waveshape of activation time courses in the auditory pathway. The first concerns how waveshape differs across stages of the pathway. For certain stimuli, it has been shown that time-course waveshape is more sustained in the brainstem and more phasic in cortex (Harms and Melcher, 2002). This trend was apparent in the present study, particularly at high stimulus levels. Specifically, there was a systematic change in WI from brainstem (CN, SOC, IC), to MGB and Heschl's gyrus (HGpm, and HGal, regions approximating primary and primary-like areas), to cortical regions medial and lateral to Heschl's gyri (AMA, PT, which likely comprise non-primary areas).
A second previous observation concerns the changes in waveshape that occur within a particular part of the auditory pathway (i.e., auditory cortex) when the stimulus parameters are varied, a change subtly apparent in the present data. Previously, it has been shown that the waveshape of activation time courses in auditory cortex can change from highly sustained to highly phasic when stimulus repetition rate is increased or other temporal envelope characteristics are changed (Harms and Melcher, 2002; Harms et al., 2005). Here, we found that increases in stimulus level produce changes in the waveshape of cortical time courses, but that the changes were subtle and far less than the changes reported previously for variations in temporal envelope (Harms et al., 2005). (For instance, the offset peak that emerged here at higher stimulus levels blends into a signal rise that begins during the stimulus. In contrast, the offset peak that emerges with changes in temporal envelope can be quite distinct; Harms et al., 2005.) The subtlety of the waveshape changes with level reinforces the conclusion of Harms et al. (2005) that sound level, unlike temporal envelope, does not strongly influence the waveshape of cortical fMRI time courses. Since the data of Harms et al. (2005) were limited to posterior Heschl's gyrus and posterior PT, the present data also extend the previous findings by showing that the limited effects of level on waveshape hold throughout auditory cortex, not just in the posterior aspect.
4.5. Comments on the fMRI methodology
The present study provides the first demonstration of the combined application of three techniques important for auditory fMRI: (1) synchronization of image acquisitions to the cardiac cycle, (2) sparse imaging, and (3) interleaved sampling (i.e., staggered timing of image acquisitions across stimulus presentations). The benefit of cardiac synchronization is a reduction in brainstem signal variability associated with cardiac-related motion (Guimaraes et al., 1998). Note that at the 3 Tesla scanner field strength of the present study (in contrast to lower field strengths), cardiac synchronization is probably not essential for the detection of brainstem activation (observations of the authors; see also Budd et al., 2003 as an example), but is expected to improve it. The benefit of sparse imaging is that the measured activation approaches what would be measured under quiet conditions typical of auditory neuro-physiological and psychophysical experiments (Edmister et al., 1999; Hall et al., 1999). Interleaved sampling follows as a necessity if the temporal resolution, degraded by sparse imaging, is to be recovered (so that activation time courses can be examined; Belin et al., 1999; Harms et al., 2005). It is worth noting that interleaved sampling, combined with the non-uniform sampling interval that results from cardiac synchronization, complicates the fMRI data analyses. However, incorporating these techniques benefits data quality and temporal resolution and, as illustrated here, post-acquisition complexities can be effectively managed.
5. Summary
The main finding of the present study was increased fMRI activation with increasing broadband noise level at every major stage of auditory processing: brainstem, thalamus and, cortex. In general, fMRI activation reflects activity summed over large neuronal populations sometimes comprising heterogeneous responses (e.g., both monotonic and non-monotonic responses to tonal stimuli). However, for the broadband noise stimulus of the present study, fMRI activation throughout the auditory pathway may have reflected a fairly homogeneous population response in which most of the contributing neurons increased their activity monotonically with level. The present results provide data fundamental to the design of any fMRI experiment employing continuous broadband noise as the stimulus.
Acknowledgements
The authors thank John Guinan, Jr., Robert A. Levine and Joe Mandeville for their helpful comments on an earlier draft of this manuscript, and Barbara Norris for her assistance in preparing the figures. This work was supported in part by NIH/NIDCD (PO1 DC00119, P30 DC005209), the Royal National Institute for Deaf People, and a Martinos Fellowship to I.S.
Abbreviations
- MRI
magnetic resonance imaging
- fMRI
functional magnetic resonance imaging
- PET
positron emission tomography
- BOLD
blood-oxygen level dependent
- TR
repetition time
- TI
inversion time
- TE
echo time
- ROI
region of interest
- CN
cochlear nucleus
- SOC
superior olivary complex
- IC
inferior colliculus
- MGB
medial geniculate body
- HGal
antero-lateral Heschl's gyrus
- HGpm
postero-medial Heschl's gyrus
- AMA
antero-medial area
- PT
planum temporale
- GLM
general linear model
- SEM
standard error of the mean
- WI
waveshape index
- Hz
Hertz
- dB
decibel
- SPL
sound pressure level
- SL
sensation level
Footnotes
While a previous report provided some data on activation time course vs. level for a continuous noise stimulus, those data pertained to only a limited part of auditory cortex (Harms et al., 2005).
References
- Aitkin L. Rate-level functions of neurons in the inferior colliculus of cats measured with the use of free-field sound stimuli. J. Neurophysiol. 1991;65(2):383–392. doi: 10.1152/jn.1991.65.2.383. [DOI] [PubMed] [Google Scholar]
- Arthurs OJ, Boniface S. How well do we understand the neural origins of the fMRI BOLD signal? Trends Neurosci. 2002;25:27–31. doi: 10.1016/s0166-2236(00)01995-0. [DOI] [PubMed] [Google Scholar]
- Belin P, Zatorre RJ, Hoge R, Evans AC, Pike B. Event-related fMRI of the auditory cortex. NeuroImage. 1999;18:417–429. doi: 10.1006/nimg.1999.0480. [DOI] [PubMed] [Google Scholar]
- Bilecen D, Seifritz E, Scheffler K, Henning J, Schulte A-C. Amplitopicity of the human auditory cortex: an fMRI study. Neuroimage. 2002;17:710–718. [PubMed] [Google Scholar]
- Brechmann A, Baumgart F, Scheich H. Sound-level-dependent representation of frequency modulations in human auditory cortex: a low-noise fMRI study. J. Neurophysiol. 2002;87:423–433. doi: 10.1152/jn.00187.2001. [DOI] [PubMed] [Google Scholar]
- Budd TW, Hall DA, Goncalves MS, Akeroyd MA, Foster JR, Palmer AR, Head K, Summerfield AQ. Binaural specialization in human auditory cortex: an fMRI investigation of interaural correlation sensitivity. NeuroImage. 2003;20:1783–1794. doi: 10.1016/j.neuroimage.2003.07.026. [DOI] [PubMed] [Google Scholar]
- Clarey JC, Barone P, Imig TJ. Functional organization of sound direction and sound pressure level in primary auditory cortex of the cat. J. Neurophysiol. 1994;72(5):2383–2405. doi: 10.1152/jn.1994.72.5.2383. [DOI] [PubMed] [Google Scholar]
- Dale AM, Fischl B, Sereno MJ. Cortical surface-based analysis. I. Segmentation and surface reconstruction. NeuroImage. 1999;9:179–194. doi: 10.1006/nimg.1998.0395. [DOI] [PubMed] [Google Scholar]
- Edmister WB, Talavage TM, Ledden PJ, Weisskoff RM. Improved auditory cortex imaging using clustered volume acquisitions. Hum. Brain Mapp. 1999;7:89–97. doi: 10.1002/(SICI)1097-0193(1999)7:2<89::AID-HBM2>3.0.CO;2-N. [DOI] [PMC free article] [PubMed] [Google Scholar]
- Fischl B, Sereno MJ, Dale AM. Cortical surface-based analysis. II: Inflation, flattening, and a surface-based coordinate system. NeuroImage. 1999;9:195–207. doi: 10.1006/nimg.1998.0396. [DOI] [PubMed] [Google Scholar]
- Fomby TB, Hill RC, Johnson SR. Advanced Econometric Methods. Springer-Verlag; New York: 1984. [Google Scholar]
- Friston KJ, Ashburner J, Frith CD, Poline J-B, Frackowiak RSJ. Spatial registration and normalization of images. Hum. Brain Mapp. 1995;2:165–189. [Google Scholar]
- Giraud A-L, Lorenzi C, Ashburner J, Wable J, Johnsrude I, Frackowiak R, Kleinschmidt A. Representation of the temporal envelope of sounds in the human brain. J. Neurophysiol. 2000;84:1588–1598. doi: 10.1152/jn.2000.84.3.1588. [DOI] [PubMed] [Google Scholar]
- Grady CL, Van Meter JW, Maisog JM, Pietrini P, Krasuski J, Rauschecker JP. Attention-related modulation of activity in primary and secondary auditory cortex. Neuroreport. 1997;8(11):2511–2516. doi: 10.1097/00001756-199707280-00019. [DOI] [PubMed] [Google Scholar]
- Guimaraes AR, Melcher JR, Talavage TM, Baker JR, Ledden P, Rosen BR, Kiang NYS, Fullerton BC, Weisskoff RM. Imaging subcortical auditory activity in humans. Hum. Brain Mapp. 1998;6:33–41. doi: 10.1002/(SICI)1097-0193(1998)6:1<33::AID-HBM3>3.0.CO;2-M. [DOI] [PMC free article] [PubMed] [Google Scholar]
- Hall DA, Haggard MP, Akeroyd MA, Palmer AR, Summerfield AQ, Elliott MR, Gurney EM, Bowtell RW. “Sparse” temporal sampling in auditory fMRI. Hum. Brain Mapp. 1999;7:213–223. doi: 10.1002/(SICI)1097-0193(1999)7:3<213::AID-HBM5>3.0.CO;2-N. [DOI] [PMC free article] [PubMed] [Google Scholar]
- Hall DA, Haggard MP, Summerfield AQ, Akeroyd MA, Palmer AR. Functional magnetic resonance imaging measurements of sound-level encoding in the absence of background scanner noise. J. Acoust. Soc. Am. 2001;109:1559–1570. doi: 10.1121/1.1345697. [DOI] [PubMed] [Google Scholar]
- Harms MP, Melcher JR. Sound repetition rate in the human auditory pathway: representations in the waveshape and amplitude of fMRI activation. J. Neurophysiol. 2002;88:1433–1450. doi: 10.1152/jn.2002.88.3.1433. [DOI] [PubMed] [Google Scholar]
- Harms MP, Melcher JR. Detection and quantification of a wide range of fMRI temporal responses using a physiologically-motivated basis set. Hum. Brain Mapp. 2003;20:168–183. doi: 10.1002/hbm.10136. [DOI] [PMC free article] [PubMed] [Google Scholar]
- Harms MP, Guinan JJ, Jr., Sigalovsky IS, Melcher JR. Short-term temporal envelope characteristics determine multisecond time patterns of activity in human auditory cortex as shown by fMRI. J. Neurophysiol. 2005;93:210–222. doi: 10.1152/jn.00712.2004. [DOI] [PubMed] [Google Scholar]
- Hart HC, Hall DA, Palmer AR. The sound-level-dependent growth in the extent of fMRI activation in Heschl's gyrus is different for low- and high-frequency tones. Hear. Res. 2003;179:104–112. doi: 10.1016/s0378-5955(03)00100-x. [DOI] [PubMed] [Google Scholar]
- Hart HC, Palmer AR, Hall DA. Heschl's gyrus is more sensitive to tone level than non-primary auditory cortex. Hear. Res. 2002;171:177–190. doi: 10.1016/s0378-5955(02)00498-7. [DOI] [PubMed] [Google Scholar]
- Hawley ML, Melcher JR, Fullerton BC. Effects of sound bandwidth on fMRI activation in human auditory brainstem nuclei. Hear. Res. 2005;204:101–110. doi: 10.1016/j.heares.2005.01.005. [DOI] [PMC free article] [PubMed] [Google Scholar]
- Heil P, Rajan R, Irvine DRF. Topographic representation of tone intensity along the isofrequency axis of cat primary auditory cortex. Hear Res. 1994;76(1–2):188–202. doi: 10.1016/0378-5955(94)90099-x. [DOI] [PubMed] [Google Scholar]
- Imig TJ, Irons WA, Samson FR. Single-unit selectivity to azimuthal direction and sound pressure level of noise bursts in cat high-frequency primary auditory cortex. J. Neurophysiol. 1990;63(6):1448–1466. doi: 10.1152/jn.1990.63.6.1448. [DOI] [PubMed] [Google Scholar]
- Jäncke L, Mirzazade S, Shah NJ. Attention modulates activity in the primary and the secondary auditory cortex: a functional magnetic resonance imaging study in human subjects. Neurosci Lett. 1999;266(2):125–128. doi: 10.1016/s0304-3940(99)00288-8. [DOI] [PubMed] [Google Scholar]
- Jäncke L, Shah NJ, Posse S, Grosse-Ryuken M, Muller-Gartner HW. Intensity coding of auditory stimuli: an fMRI study. Neuropsychologia. 1998;36:875–883. doi: 10.1016/s0028-3932(98)00019-0. [DOI] [PubMed] [Google Scholar]
- Kajikawa Y, de La Mothe L, Blumell S, Hackett TA. A comparison of neuron response properties in areas A1 and CM of the marmoset monkey auditory cortex: tones and broadband noise. J. Neurophysiol. 2005;93:2–34. doi: 10.1152/jn.00248.2004. [DOI] [PubMed] [Google Scholar]
- Lasota KJ, Ulmer JL, Firszt JB, Biswal BB, Daniels DL, Prost RW. Intensity-dependent activation of the primary auditory cortex in functional magnetic resonance imaging. J. Comput. Assist. Tomogr. 2003;27:213–218. doi: 10.1097/00004728-200303000-00018. [DOI] [PubMed] [Google Scholar]
- Lockwood AH, Salvi RJ, Coad ML, Arnold SA, Wack DS, Murphy BW, Burkard RF. The functional anatomy of the normal human auditory system: responses to 0.5 and 4.0 kHz tones at varied intensities. Cereb. Cortex. 1999;9:65–76. doi: 10.1093/cercor/9.1.65. [DOI] [PubMed] [Google Scholar]
- Logothetis NK, Pauls J, Augath M, Trinath T, Oeltermann A. Neurophysiological investigation of the basis of the fMRI signal. Nature. 2001;412:150–157. doi: 10.1038/35084005. [DOI] [PubMed] [Google Scholar]
- Millen SJ, Haughton VM, Yetking Z. Functional magnetic resonance imaging of the central auditory pathway following speech and pure-tone stimuli. Laryngoscope. 1995;105:1305–1310. doi: 10.1288/00005537-199512000-00008. [DOI] [PubMed] [Google Scholar]
- Mohr C, King WM, Freeman AJ, Briggs RW, Leonard CM. Influence of speech stimuli intensity on the activation of auditory cortex investigated with functional magnetic resonance imaging. J. Acoust. Soc. Am. 1999;105:2738–2745. doi: 10.1121/1.426942. [DOI] [PubMed] [Google Scholar]
- Mulert C, Jager L, Propp S, Karch S, Stormann S, Pogarell O, Moller HJ, Juckel G, Hegerl U. Sound level dependence of the primary auditory cortex: simultaneous measurement with 61-channel EEG and fMRI. NeuroImage. 2005;28:49–58. doi: 10.1016/j.neuroimage.2005.05.041. [DOI] [PubMed] [Google Scholar]
- Nudo RJ, Masterton RR. Stimulation-induced [14C] 2-deoxyglucose labeling of synaptic activity in the central auditory system. J. Comp. Neurol. 1986;245:553–565. doi: 10.1002/cne.902450410. [DOI] [PubMed] [Google Scholar]
- Phillips DP, Cynader MS. Some neural mechanisms in the cat's auditory cortex underlying sensitivity to combined tone and wide-spectrum noise stimuli. Hear Res. 1985;18(1):87–102. doi: 10.1016/0378-5955(85)90112-1. [DOI] [PubMed] [Google Scholar]
- Phillips DP, Orman SS, Musicant AD, Wilson GF. Neurons in the cat's primary auditory cortex distinguished by their responses to tones and wide-spectrum noise. Hear. Res. 1985;18(1):87–102. doi: 10.1016/0378-5955(85)90111-x. [DOI] [PubMed] [Google Scholar]
- Phillips DP, Semple MN, Calford MB, Kitzes LM. Level-dependent representation of stimulus frequency in cat primary auditory cortex. Exp. Brain Res. 1994;102(2):210–226. doi: 10.1007/BF00227510. [DOI] [PubMed] [Google Scholar]
- Rademacher J, Caviness VS, Jr., Steinmetz H, Galaburda AM. Topographical variation of the human primary cortices: implications for neuroimaging, brain mapping, and neurobiology. Cereb. Cortex. 1993;3(4):313–329. doi: 10.1093/cercor/3.4.313. [DOI] [PubMed] [Google Scholar]
- Ravicz ME, Melcher JR. Isolating the auditory system from acoustic noise during functional magnetic resonance imaging: examination of noise conduction through the ear canal, head, and body. J. Acoust. Soc. Am. 2001;109:216–231. doi: 10.1121/1.1326083. [DOI] [PMC free article] [PubMed] [Google Scholar]
- Schreiner CE, Mendelson JR. Functional topography of cat primary auditory cortex: distribution of integrated excitation. J. Neurophysiol. 1990;64(5):1442–1459. doi: 10.1152/jn.1990.64.5.1442. [DOI] [PubMed] [Google Scholar]