

Abstract
Although the Archaea exhibit an intriguing combination of bacterial- and eukaryotic-like features, it is not known how these prokaryotic cells segregate their chromosomes before the process of cell division. In the course of our analysis of the third replication origin in the archaeon Sulfolobus solfataricus, we identify and characterise sister chromatid junctions in this prokaryote. This pairing appears to be mediated by hemicatenane-like structures, and we provide evidence that these junctions persist in both replicating and postreplicative cells. These data, in conjunction with fluorescent in situ hybridisation analyses, suggest that Sulfolobus chromosomes have a significant period of postreplicative sister chromatid synapsis, a situation that is more reminiscent of eukaryotic than bacterial chromosome segregation mechanisms.
Keywords: Archaea, cell division, DNA replication, origin of replication, Sulfolobus
Introduction
It is now well established that bacteria and eukaryotes have nonorthologous systems for transcription and DNA replication. However, archaea have information processing machineries that are closely related to those of eukaryotes (Bell and Jackson, 2001; Duggin and Bell, 2006). This eukaryotic/bacterial evolutionary dichotomy extends to the mechanisms of chromosome segregation, with the majority of studies indicating that bacterial cells segregate their chromosomes concomitant with, or shortly after, DNA replication (reviewed in Sherratt, 2003; Thanbichler et al, 2005). For example, a recent study by Austin and colleagues has demonstrated that newly synthesised chromosomal markers are segregated after a brief delay, lasting approximately 20% of the cell cycle. Consequently, regions of the bacterial genome that are duplicated early become segregated before the completion of DNA synthesis phase of the cell cycle (Nielsen et al, 2006). In addition, it has been demonstrated that intermolecular recombination during duplication is a rare event in Escherichia coli (Valens et al, 2004). This observation provides further support for an extrusion capture model for chromosome separation in bacteria (Lemon and Grossman, 2001). In contrast, the process of eukaryotic mitosis involves a G2 period when sister chromatids are paired postreplicatively. As yet, it remains undetermined whether archaeal cells utilise segregation mechanisms akin to those of bacteria, or employ a mode of chromosome separation more reminiscent of the eukaryotic system. Although many archaeal genomes have been shown to encode homologues of bacterial cell division and DNA segregation proteins, such as ftsZ and minD (Bernander, 2003), it is apparent that species of the crenarchaeal kingdom, including the Sulfolobus genus, lack genes encoding obvious homologues of these bacterial proteins (She et al, 2001). Furthermore, cell-cycle analyses have revealed that, in contrast to bacteria, Sulfolobus species do not undergo overlapping rounds of replication before cell division. Indeed, Sulfolobus cells display tight control of chromosome number, oscillating between one and two copies of the chromosome in the G1 and G2 phases of the cell cycle, respectively (Bernander and Poplawski, 1997).
Our previous work has demonstrated that the single chromosome of Sulfolobus solfataricus is replicated from at least two replication origins, oriC1 and oriC2 (Robinson et al, 2004). The activity of both origins has been corroborated by an independent genome-wide marker frequency analysis (MFA), which also revealed the presence of a third and final origin (Lundgren et al, 2004). However, because of the low resolution of MFA, it was not possible to map the exact position of this third initiation site. Importantly, the MFA also suggested that Sulfolobus cells activate all three replication origins simultaneously, rather than stochastically, following a G2 cell-cycle block induced by acetic acid treatment (Lundgren et al, 2004).
In the present study, we map the precise location of the third origin, oriC3, and demonstrate that this locus is recognised by the three Sulfolobus Orc1/Cdc6 proteins (homologues of the eukaryotic replication initiator proteins Orc1 and Cdc6). We also provide evidence for hemicatenane sister chromatid junctions at all three replication initiation sites, and demonstrate that these structures are also present, although at lower abundance, within genomic regions distal to the origins. Moreover, we reveal that these joint molecules are detectable in both replicating and postreplicative cells. In addition, we provide further evidence for postreplicative sister chromatid synapsis in this archaeon, using fluorescent in situ hybridisation (FISH) with probes specific to the three origins on G2/M phase-enriched Sulfolobus populations.
Results
Identification of oriC3
We have utilised neutral/neutral two-dimensional (2D) gel analysis to identify the precise location of the third origin, oriC3. Previously, the MFA performed by Lundgren et al (2004) had suggested that this replication site was located inside an approximately 20 kb region, separated about 80 kb from the nearest presumptive initiator gene, cdc6-2 (She et al, 2001). We scanned this region in a series of overlapping restriction fragments to reveal the exact origin locus. As can be seen in Figure 1, a 6.5 kb BamHI–SphI fragment (Figure 1D) centred on the intergenic region between Sso0866 and Sso0867 shows a clear full bubble arc. This characteristic intermediate is indicative of an active bidirectional origin of replication. However, only Y-shaped replication fork arcs were detectable in the 6.3 kb PvuII (Figure 1H) and 3.5 kb AseI (Figure 1E) restriction fragments that border, and partially overlap, the flanks of the BamHI–SphI fragment. Thus, the origin lies in the central portion of the BamHI–SphI fragment. We also mapped the origin at higher resolution by probing smaller restriction fragments within the origin-containing region. Again, a full bubble arc is observed in a 3.9 kb PvuII fragment, centred on the intergenic region between open reading frames (ORFs) Sso0866 and Sso0867 (Figure 1F). In contrast, a second fragment, generated by EcoRI digestion, in which the intergenic region is somewhat off-centre, has an incomplete bubble arc. Taken together, these data indicate that replication initiates at oriC3 within the noncoding region between Sso0866 and Sso0867. This intergenic region encompasses a short inverted 12 bp repeat (TTA(C/T)TACTACTA) that is distinct from the repeat motifs observed at the other two origins, oriC1 and oriC2. We also note that a prominent replication stall site is observed on the replication fork arcs in fragments D, F and G (Figure 1). This appears to correspond with a site located within ORF Sso0867, which has previously been reported to contain repeated sequence elements (Lundgren et al, 2004). We speculate that these repeats may be a binding site for an as yet unidentified protein, thereby forming a transient barrier to fork progression.
Figure 1.
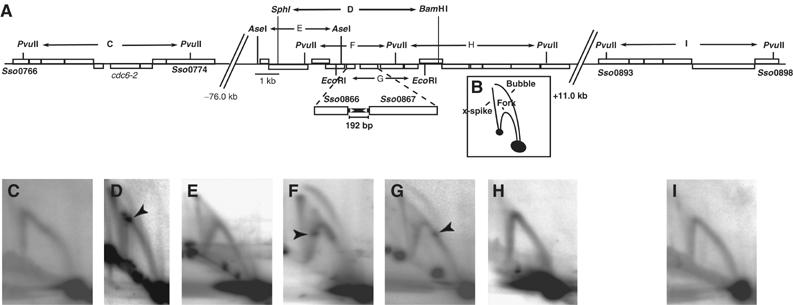
Characterisation of the third origin of replication by 2D gel electrophoresis. (A) Schematic representation of the genomic organisation of the locus encompassing the third replication origin, oriC3, and two additional sites distal to the origin. Boxes depict ORFs; ORFs above the midline are transcribed from left to right and those below the line from right to left. The restriction endonuclease recognition sites producing the seven DNA species (C–I) utilised in this analysis are indicated. The triangles within the 192 bp noncoding region between ORFs Sso0866 and Sso0867 represent a 12 bp short inverted repeat motif located with the origin region. (B) Cartoon illustrating the three species of branched DNA molecule detectable at oriC3. (D–H) 2D gel dissection of the oriC3 locus. Genomic DNA, isolated from asynchronous replicating S. solfataricus cultures, was digested with restriction enzymes to produce the fragments indicated in panel A, and subjected to 2D gel electrophoresis. After transfer to nylon membrane, the DNA was hybridised with fragment-specific radiolabelled probes. Bubble-shaped replication intermediates are detectable in panels E and F, indicative of an active origin of replication. Spots located within the Y-shape intermediates in panels D, E and F demonstrate replication pausing at this locus. The prominent X-spikes evident at this locus represent joint molecules, and are strongest in the PvuII restriction fragment, centred on the origin (F). (C, I) 2D analysis of two additional sites distal to oriC3. X- shaped molecules remain detectable, but are considerably less abundant than at the origin. Prominent replication fork pause sites are detected in panels D, F and G and are indicated by arrowheads.
Interaction of initiator proteins with oriC3
We have previously demonstrated that the presumptive Sulfolobus initiator proteins, Cdc6-1, Cdc6-2 and Cdc6-3 (Orc1/Cdc6 homologues), associate specifically with repeat motifs found at oriC1 and oriC2 (Robinson et al, 2004). In contrast, we discovered that, although all three recombinant Orc1/Cdc6 proteins could also bind the third origin, these interactions were not centred on the new repeats (Figure 2A–F). DNAse I footprinting revealed that Cdc6-2 and Cdc6-3 produced two broad regions of binding at either end of the oriC3 noncoding region. These footprints encompassed part of the adjacent ORF (Sso0866 or Sso0867, respectively) and extended towards the nearest inverted repeat (Figure 2A–D and F). Cdc6-3 binding also induces strong DNAseI hypersensitivities, which is suggestive of bending or kinking of the DNA by this protein. Cdc6-1 was also able to bind the locus, but with lower affinity than at the other two origins. We detected Cdc6-1-specific DNAseI protection on the Sso0867 proximal end of the noncoding region, at a site that intersects the Cdc6-2 and Cdc6-3 footprints (Figure 2E and F). In contrast to the other two Sulfolobus origins, oriC3 does not possess the ORB or mORB elements, previously characterised as high-affinity Cdc6-1 binding sites at oriC1 and oriC2 (Robinson et al, 2004). The two origins characterised in our earlier study are associated with cdc6 genes (cdc6-1 and cdc6-3, respectively), whereas oriC3 is not linked with the final cdc6 gene (cdc6-2). This disparity is perhaps consistent with the different mode of Orc1/Cdc6 binding observed at this site. Although some aspects of the third origin appear different from oriC1 and oriC2, the region between the 12 bp inverted repeats has a relatively high A/T content, indicative of a duplex unwinding element, an architectural feature shared by the other Sulfolobus origins (Robinson et al, 2004).
Figure 2.
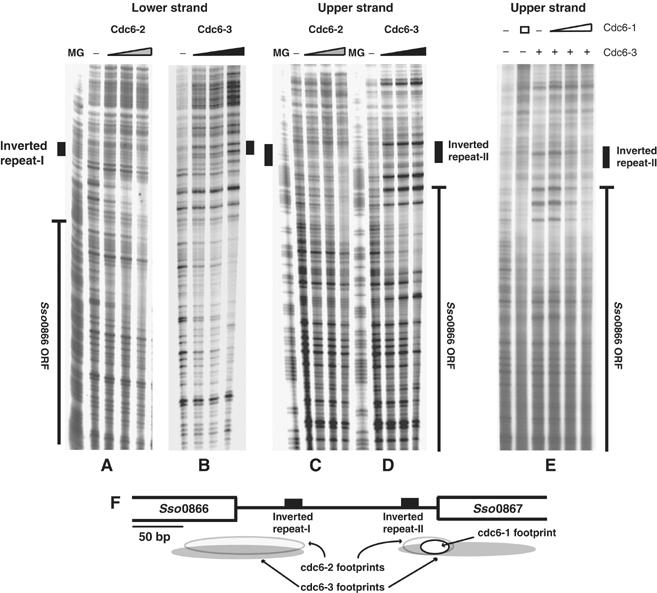
DNAseI footprint analysis of Cdc6-1, Cdc6-2 and Cdc6-3 binding to oriC3. MG denotes a Maxam Gilbert A+G sequencing ladder. The positions of the 12 bp inverted repeats and Sso0866 and Sso0867 ORFs are indicated at the side of the panels. (A) 0, 65, 130 and 260 nM Cdc6-2 on the oriC3 lower strand. (B) 0, 100, 125 and 160 nM Cdc6-3 on the oriC3 lower strand. (C) 0, 53.5, 105 and 210 nM Cdc6-2 on the oriC3 upper strand. (D) 0, 80, 93.5 and 112 nM Cdc6-3 on the oriC3 upper strand. (E) DNAseI footprinting of Cdc6-1 on the oriC3 upper strand. Lanes 1 and 2; 0 and 1100 nM Cdc6-1; lanes 3–6; 0, 550, 1100 and 2200 nM Cdc6-1 plus 112 nM Cdc6-3. The appearance of the Cdc6-1 footprint is coincidental with the loss of the Cdc6-3 protection at higher concentrations of Cdc6-1. (F) Cartoon summarising the footprinting at oriC3. It should be noted that when higher concentrations of Orc1/Cdc6s proteins are employed in footprinting assays, the binding of the Orc1/Cdc6s becomes nonspecific and nucleates cooperative assembly of higher order structures that extend away from the central specific zone of protection.
Presence of X-shaped molecules
In addition to establishing the location of the third origin, the 2D gel analysis also revealed the presence of joint molecules at this locus. The prominent vertical ‘spike' detected in the origin-containing restriction fragments corresponds to X-shaped molecules (Figure 1D, F and G). This species is also present, albeit at significantly reduced levels, in the regions flanking the origin locus (Figure 1E and H) and at sites distal to the initiation site (Figure 1C and I). Similar structures were also observed at the other two origins, oriC1 and oriC2 (see Robinson et al, 2004; Figures 2C and 3B). Intriguingly, a number of studies have described the presence of such X-shaped structures associated with replication origins in eukaryotes (Lucas and Hyrien, 2000; Benard et al, 2001; Segurado et al, 2002; Lopes et al, 2003).
Figure 3.
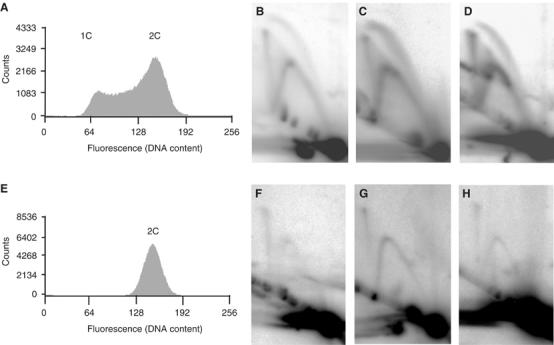
X-shaped molecules are present at all three replication origins and persist into the nonreplicating stationary phase. (A) Fluorescence histogram of an asynchronous replicating S. solfataricus culture (optical density (A600) of 0.3). The fluorescence values in the histogram feature two peaks corresponding to one and two copies (1C and 2C) of the genome, respectively. The histogram region between the two peaks includes those cells in DNA synthesis (S) phase. (B–D) 2D gel analysis of the three origins of replication using DNA isolated from the replicating population analysed in panel A (panel B depicts oriC1 (AccI digest), panel C illustrates oriC2 (BamHI/XcmI digest) and panel D demonstrates oriC3 (PvuII digest)). Bubble-, fork- and X-shaped molecules are present at each origin. (E) Fluorescence histogram of a stationary phase S. solfataricus culture. (F–H) 2D gel analysis of the three origin loci using DNA isolated from the stationary phase population (restriction fragments are identical to panels B–D). Although bubble-shaped molecules are no longer detectable, X- and Y-shaped species persist.
X-shaped molecules are present in postreplicative cells
After identifying the X-shaped intermediates, we wished to ascertain whether these joint molecules were only associated with ongoing replication, or if they might represent postreplicative junctions between sister chromatids. To test this, we exploited the observation that Sulfolobus cells arrest with two copies of the chromosome when they enter stationary phase (Bernander and Poplawski, 1997). It should be noted, however, that this population appears somewhat heterogeneous; whereas some cells contain a single nucleoid, others appear to have separated daughter nucleoids (Bernander and Poplawski, 1997; our data not shown). The flow cytometric profile in Figure 3E demonstrates that the stationary phase population used in this analysis (harvested 48 h after the cessation of culture growth) lack cells in either G1 or S phase. This finding was confirmed by 2D gel analysis of replication intermediates isolated from the stationary phase culture. Figure 3F–H illustrates that the bubble arcs, corresponding to molecules undergoing initiation of replication, were no longer detectable in these postreplicative cells. However, we identify signals corresponding to joint molecules at all three replication origins in these G2 cells (Figure 3F–H). These data therefore suggest the persistence of junctions between sister chromatids subsequent to the completion of replication in this prokaryotic organism.
Some Y-shaped species were also detected in the 2D analysis of the stationary population. Notably, the prominent stall site associated with the replication forks in dividing cells was no longer detectable in these stationary phase Y-shaped structures (Figures 1D, F and G, 3D and H). We believe that it is unlikely that these species arise from origin-dependent initiation events for three reasons. First, the flow cytometry profile shows no evidence of cells with less than a 2C genomic content. Second and more importantly, we see no bubble arcs in the 2D gels, indicating that there is no detectable initiation of replication in these cells. Third, the cells were harvested after 48 h in stationary phase; the levels of the initiator proteins (Cdc6-1 and Cdc6-3) are undetectable at this time point (Robinson et al, 2004). The absence of these Cdc6 proteins in the stationary population makes initiation events at origins unlikely. We therefore speculate that these Y-arcs may represent structures arising from DNA repair processes. To test this, we irradiated S. solfataricus cells with UV radiation and examined the nature of replication intermediates using the 2D gel approach. Cells were irradiated at 200 J m−2, a dose that results in growth inhibition and transcriptional induction of a range of genes (Salerno et al, 2003). As can be seen in Figure 4, the relative levels of both Y- and X-structures at oriC3 are increased following UV treatment; similar results are seen at oriC1 and oriC2 (data not shown). In addition, the levels of both X and Y structures are elevated at a distal non-origin control locus (Figure 4D). We also observe a significant reduction in the level of species corresponding to the stall sites discussed above. This result is consistent with the reduced levels of pausing seen at oriC3 in the stationary phase cell population (Figure 2). Thus, it appears that the levels of Y- and X-shaped molecules can be increased by DNA damage, suggesting that they may be associated with DNA repair processes.
Figure 4.
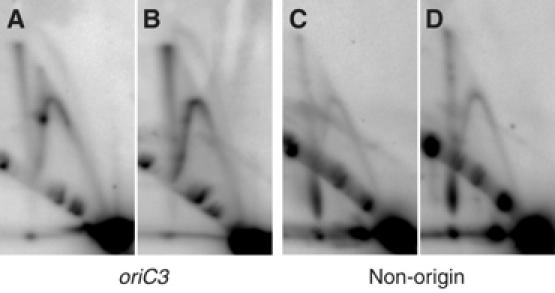
X- and Y-shaped structures are enhanced at both origin and nonorigin loci following UV treatment (200 J m−2 at 254 nm). (A–D) Neutral/neutral 2D agarose gel analysis of UV-treated and control DNA at OriC3 and a nonorigin region (655 454–658 591 bp). Standard neutral/neutral 2D agarose gel electrophoresis was performed as described previously (Robinson et al, 2004). (A) PvuII-digested OriC3 fragment—untreated (control) filter. (B) PvuII-digested OriC3 fragment after 200 J m−2 UV treatment. (C) BamHI/XcmI-digested nonorigin region—untreated (control) filter. (D) BamHI/XcmI-digested non-origin region after 200 J m−2 UV treatment. UV-treated and control DNA was prepared as described in Materials and methods.
It is currently unclear whether the X-shaped structures seen in untreated cells (free from exogenous UV exposure) have arisen from the repair of a basal level of damage, or from another undetermined process.
The X-shaped molecules are hemicatenanes
In the ensuing analyses, we investigated the nature of the X-shaped molecules. We were unable to detect any specific cleavage of these structures with Holliday junction resolving enzymes RuvC, RusA or Hje (data not shown). However, these intermediates could be resolved into linear species by a branch migration assay, both in the presence and absence of magnesium ions (Figure 5, species rX). Although movement of Holliday junctions is inhibited by magnesium ions, which promote the stacking of the structure's arms, it is possible for other species, such as hemicatenanes, to move freely under these conditions (Duckett et al, 1988). As we observed an enhanced migration of the X-shaped molecules in the presence of magnesium ions (Figure 5B and C), we speculate that the most probable structures of these molecules are hemicatenanes. In this light, it is interesting to note that the X-shaped molecules detected at origins of replication in eukaryotic cells also appear to be hemicatenanes (Lucas and Hyrien, 2000; Benard et al, 2001; Segurado et al, 2002; Lopes et al, 2003; Liberi and Foiani, 2004). Further inspection of the data in Figure 5 revealed that the prominent replication pause site detected on the Y-arc (indicated by ‘S' in Figure 5) also resolves under branch migration conditions. This results in the generation of two species, the first being the full length of the initial restriction fragment (Figure 5, species rS1) and the second being significantly shorter (Figure 5, species rS2). These structures also resolved in the presence of magnesium ions, suggestive of the formation of hemicatenanes at the stalled replication fork. Additionally, a distinctive ‘cone spike' structure (Figure 5, species rSX) was also produced by the branch migration. We propose that during the random movements involved in branch migration, in some instances the hemicatenane will resolve in the direction of the stall site and allow the formation of a shortened ‘chicken foot' Holliday junction (as indicated in Figure 5D). This species is most apparent in the presence of magnesium ions, consistent with these structures becoming refractory to migration following magnesium-induced stacking of the junction.
Figure 5.
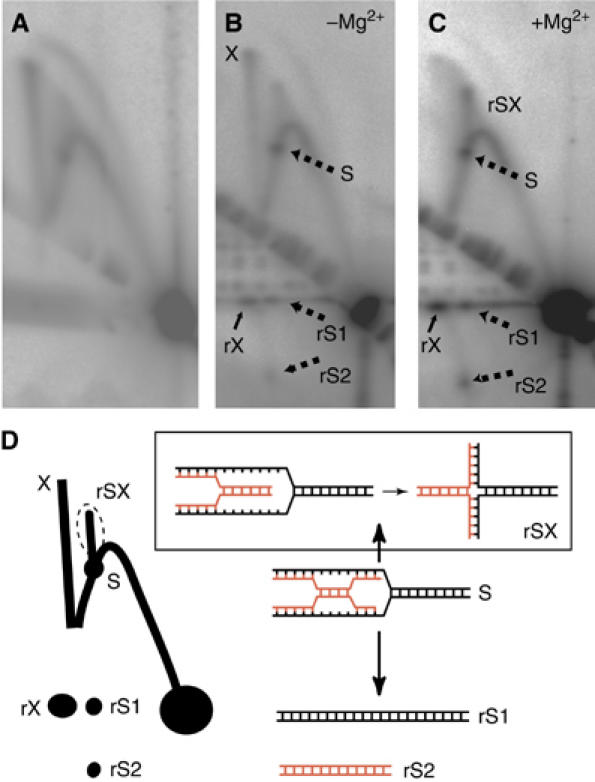
Resolution of the origin-associated X-shaped species into linear molecules by branch migration assay. (A) Untreated (control) filter. DNA isolated from asynchronous replicating S. solfataricus culture was digested with PvuII and subjected to the standard 2D gel electrophoresis. The resulting membrane was hybridised with an oriC3-specific probe. (B, C) Branch migration of the X spikes at oriC3 in the absence or presence of magnesium ions, respectively. After digestion with PvuII, the genomic DNA was subjected to the first dimension electrophoresis. Gel slices excised from the first dimension were then incubated in branch migration buffer (either without (B) or with (C) magnesium ions) at 65°C for 2 h before separation in the second dimension. The X-spike is indicated by the letter ‘X' and its resolved product by ‘rX'. The prominent fork-stall site on the Y-arc is indicated by S and its resolution products by rS1 and rS2. Additionally, migration strengthens a signal due to X-shaped molecules arising from migration of species ‘S'; this spike is labelled rSX. (D) A diagram of the principal species detected in panels B and C. The diagrams indicate potential structures for species rS1, rS2, S and rSX.
Thus, our data reveal that hemicatences are most abundant not only at active origins but are also present at the replication fork. It is currently unclear whether the fork-associated hemicatenanes are migrating with the replication fork or are being generated de novo during fork progression. It is possible that these junctional molecules are generated by a template switching process such as has been recently described by Lovett and co-workers (Goldfless et al, 2006). Regardless of the derivation of these species, our data indicate that hemicatenane junctions are found in a range of genomic loci around the Sulfolobus chromosome.
FISH analysis
We speculated that the presence of joint molecules in S. solfataricus might have implications for the existence of sister chromatid cohesion in this archaeon. Therefore, we wished to examine whether the joint molecules observed in the 2D gel analyses might be indicative of pre-cell division chromosome pairing. Accordingly, FISH was employed to visualise the location of replication origins in individual pre- and postreplicative cells. As there are currently no efficient methods for ensuring synchronisation of S. solfataricus cultures, we established a procedure for physically separating 1C and 2C S. solfataricus cells using flow cytometric cell sorting. Figure 6 illustrates that an asynchronous culture can be efficiently separated into two distinct populations according to the DNA content within the cell (panels A and E). As this fractionation was performed on the basis of chromosome content, the 2C population will contain both G2 and early M-phase cells. These sorted populations were then subjected to FISH with probes specific for the three origin sequences, in conjunction with confocal and phase-contrast microscopy. This analysis revealed that a large proportion of cells with a fully replicated genome (2C) only present a single hybridising focus for each origin (Figures 5I and 6F–H). As this sorted population contains both G2 cells and those in early M phase, it seems probable that the remaining minority of cells, possessing two origin-specific foci, are representative of the mitotic subpopulation. Our data therefore indicate that, in the majority of cells, loci containing the origins of replication on the two sister chromatids are held together for a considerable period during G2 following the completion of DNA replication. This situation contrasts markedly with that found in bacteria where origin-proximal loci are segregated before the completion of the DNA replication phase of the cell cycle.
Figure 6.
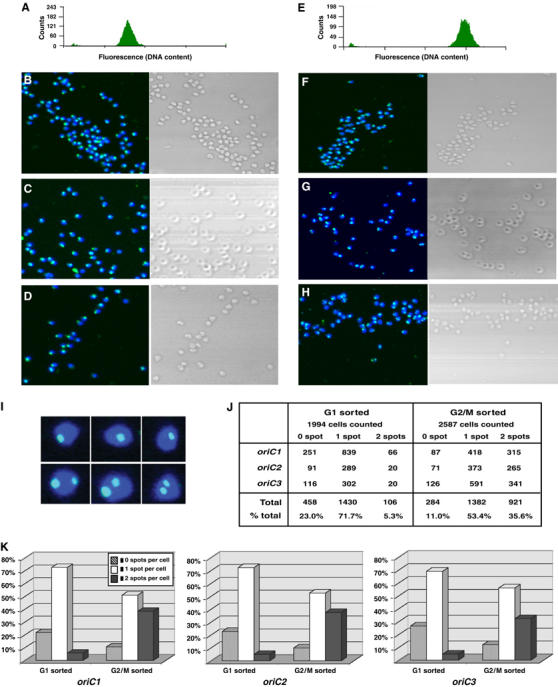
FISH staining of S. solfataricus origins of replication in G1 and G2/M sorted populations, demonstrating chromosome pairing at G2 phase. (A) Fluorescence histogram of the G1 (1C) sorted population. (B–D, F–H) Left-hand boxes exhibit confocal photomicrographs of FITC-labelled origins (oriC1, oriC2 and oriC3, respectively), counterstained with DAPI, in G1 (B–D) or G2/M (2C, panels F–H) sorted cells. Phase-contrast micrographs are displayed on the right-hand side of each panel. (E) FACS profile of the G2/M sorted population. (I) Enlarged images of single and double foci from oriC2-labelled cells. (J) Table summarising numbers of one, two and zero foci cells for each origin in both cell populations. (K) Histograms illustrating the FISH analysis data for each of the three origin-specific probes. In total, 1994 G1 sorted and 2587 G2/M sorted cells were counted, and scored into one of three categories, depending on whether an individual cell contained two, one or zero origin-specific spots. The histograms display the relative proportions of these three categories counted in the G1 or G2/M-sorted cells, for each of the three origins of replication. The individual cell counts are summarised in the table.
Discussion
The evolution of a mechanism to ensure postreplicative pairing of sister chromatids may reflect the harsh physical environment inhabited by Sulfolobus cells. We speculate that hemicatenane-like structures could play a role in facilitating this process. In addition, S. solfataricus possesses five members of the SMC superfamily of proteins that could play a role in protein-mediated cohesion (She et al, 2001). These cells exist in an aerobic environment at high temperature and consequently their DNA content is likely to sustain severe DNA damage. Thus, by ensuring pairing of homologous sequences during the G2 phase of the cell cycle, Sulfolobus cells may facilitate repair of damaged DNA via homologous recombination with the sister chromatid. It is unclear how general this mechanism of pairing of chromosomes may be in the archaeal domain of life; the only other archaeon studied by 2D gel analysis, Pyrococcus abyssi—a euryarchaeote, showed no clear signal corresponding to X-shaped molecules at replication origins (Matsunaga et al, 2001). The apparent discrepancy in the detection of X-shaped molecules between S. solfataricus and P. abyssi could be explained by differences in cellular metabolism and replicon design. Although Pyrococcus species are also hyperthermophiles, they are anaerobic organisms and possess up to 15 copies of their chromosomal DNA, perhaps indicative of an alternate route to ensuring genomic stability. Furthermore, it may be significant that P. abyssi has a bacterial-like replicon architecture with a single origin of DNA replication, whereas Sulfolobus species possess multiple replication origins (Myllykallio et al, 2000; Lundgren et al, 2004; Robinson et al, 2004).
Our observation of postreplicative chromosome pairing in the hyperthermophilic archaeon, Sulfolobus, suggests that mechanisms for ensuring sister chromatid synapsis may have evolved before the divergence of the archaeal and eukaryotic lineages. We note that this is compatible with the ‘Ring of Life' hypothesis (Rivera and Lake, 2004). This model proposes that the eukaryotic lineage evolved via a genome fusion between a crenarchaeote (eocyte), like Sulfolobus, with an ancient bacterium. Indeed, several other endokaryotic models, involving an archaeal endosymbiont within a bacterium, have been proposed as a paradigm for the evolution of the eukaryotic nucleus (Lake and Rivera, 1994; Gupta and Golding, 1996; Horiike et al, 2001; Emelyanov, 2003; Martin, 2005). Therefore, it is possible that a mechanism for ensuring sister chromatid pairing may have evolved in a hyperthermophilic archaeal ancestor to facilitate more efficient DNA repair, necessary for survival in extreme environments.
Materials and methods
Neutral/neutral 2D agarose gel electrophoresis
The preparation of unsheared genomic DNA within agarose plugs and 2D gel analysis was carried out as described previously (Robinson et al, 2004). Branch migration assays were performed by incubating the first dimension gel slices (excised after the first dimension run) in branch migration buffer (50 mM NaCl, 0.1 mM EDTA, 10 mM Tris, pH 8.0, with or without 10 mM MgCl2) for 2 h at 65°C. The second dimension was then run using the standard conditions outlined above.
UV treatment of S. solfataricus cultures
Asynchronous S. solfataricus cultures were grown to an OD600 of 0.3 at 75°C. A 250 ml culture was then transferred to a clear lidless perspex box and exposed to 200 J m−2 UV light (254 nm) from an overhead source (Stratalinker UV crosslinker 2400; Stratagene). This procedure was performed in a darkroom under red safety-light to prevent activation of the photolyase repair pathway. After exposure to UV, the culture was poured back into a conical flask (wrapped in aluminium foil to exclude light) and returned to the 75°C incubator for 1 h. The preparation of unsheared genomic DNA within agarose plugs and subsequent 2D analysis was then carried out as described previously (Robinson et al, 2004). Genomic plugs were also prepared from a 250 ml control culture that was treated in the same manner, but without the UV exposure.
DNAseI footprinting
DNAseI footprinting, and the purification of the Cdc6 proteins, was performed as described previously (Robinson et al, 2004).
Slide preparation
Asynchronous S. solfataricus cultures were grown to mid-log phase (optical density (A600) of 0.4) and harvested by centrifugation at 5000 g for 10 min at 4°C. Cells were resuspended in 1 × phosphate-buffered saline (PBS) and 4% paraformaldehyde at 25°C for 30 min. After centrifugation, the cells were permeabilised by resuspension in 0.2% Triton X-100 and 0.04% SDS at 25°C for 20 min. The fixed, permeabilised cells were then washed and resuspended in 1 × PBS supplemented with 0.05 μg ml−1 4′,6-diamidino-2-phenyl-indole, dihydrochloride (DAPI) and 100 μg ml−1 RNAseA, after which the population was sorted into G1 and G2/M populations by FACS. Approximately one million sorted cells (resuspended in 30 μl 1 × PBS) were used per slide (poly-L-lysine coated poly-prep slide; Sigma-Aldrich). Slides were dried at 25°C and stored at 4°C.
Probe preparation
Large DNA fragments (6.1–6.7 kb) corresponding to genomic sequences located at each origin region were amplified, by PCR from S. solfataricus genomic DNA, using Herculase polymerase (Stratagene) and ligated into pCRScript (Statagene) or TOPO-XL (Invitrogen) vectors. The oriC1 fragment (6.1 kb) was amplified using primers OriC1fish (CTCTTCCGCATCCCTTATTCCTTCTTCAG) and CDC6-1N (GGATCCATATGAGTGATATAATTGATGAGGTCATT). The oriC2 fragment (6.7 kb) was amplified using primers OriC2fish (TTTCTTCTCTTTATCAAGATCAATGCAATAATAG) and CDC6-3C (AATTCCTCGAGATTTTCTCCCACATCATCAAAAT). The oriC3 fragment (6.5 kb) was amplified using primers OriC3fishfor (CCTTCTTCTTCCAATAACTGAGATAGC) and OriC3fishrev (CCCGGGATAATGACTGGAGATCC). FISH probes were generated from these three fragments by performing nick translation reactions on total plasmid DNA. Plasmid DNA (1 μg) was incubated with 10 U of DNA polymerase I (Sigma-Aldrich) and 0.7 ng of DNAseI (Sigma-Aldrich) in a 25 μl reaction of 50 mM Tris chloride (pH 7.9 at 25°C), 0.1 mM dithiothreitol, 10 mM magnesium sulphate, 50 μg ml−1 BSA, supplemented with 38 μM dATP, 38 μM dCTP, 38 μM dGTP, 19 μM dTTP and 28 μM digoxygenin-conjugated dUTP (digoxygenin-11-dUTP; Roche Applied Science) for 2 h at 14°C. The reaction was then terminated by supplementing with 50 mM EDTA and incubating at 65°C for 10 min.
Hybridisation and washes
FISH probes were desalted by ethanol precipitation and resuspended in 40 μl 50% deionised formamide, 0.3 M Na chloride, 0.03 M Na citrate, 36.4 mM phosphate buffer, 0.02% Ficoll, 0.02% PVP and 0.02% BSA. The probes were denatured by incubation at 75°C for 10 min and then snap cooled on ice for 2 min. Slides were denatured in 70% formamide, 0.3 M NaCl and 0.03 M Na citrate, at 75°C for 2 min, then immediately quenched in ice-cold 70% ethanol for 5 min before dehydration in 90% ethanol at 25°C for 5 min, and then in 100% ethanol at 25°C for 5 min. The denatured probes were applied to the treated slides, sealed with coverslips, using rubber gum cement, and incubated overnight at 37°C. Slides were then washed twice in 50% deionised formamide, 0.15 M NaCl and 0.015 M Na citrate for 5 min at 42°C and twice in 0.15 M NaCl and 0.015 M Na citrate for 5 min at 42°C, and then in 0.5% BSA, 0.6 M NaCl and 0.06 M Na citrate for 5 min at 25°C. After washing, the samples were blocked with 3% BSA, 0.6 M NaCl and 0.06 M Na citrate for 30 min at 37°C, before the addition of 1 μg ml−1 fluorescein isothiocyanate (FITC)-conjugated antidigoxygenin antibody (Roche Applied Science) in 1% BSA, 0.6 M NaCl and 0.06 M Na citrate for 30 min at 37°C. Unbound antibody was removed by four washes in 0.5% BSA, 0.6 M NaCl and 0.06 M Na citrate for 5 min at 25°C. A drop of Vectorshield mountant, containing DAPI at 1.5 μg ml−1 (Vector Laboratories), was added to the slides and sealed with varnished coverslips.
Microscopy
Cells were evaluated using a Zeiss LSM510 confocal laser-scanning microscope through a × 63 Plan Apochromat objective. In total, 1994 G1 and 2587 G2/M sorted cells were counted for the analysis.
FACS analysis
S. solfataricus cells were fixed in ice-cold 80% ethanol, washed and resuspended in 10 mM Tris chloride (pH 7.4), 10 mM magnesium chloride, 20 μg ml−1 propidium iodide and 100 μg ml−1 RNAseA. Flow cytometric analysis was carried out on a MoFlo high-speed sorter (Dako, Denmark). Multiline visible light (4.5 W) from an argon laser (Coherent, USA) was focused onto the stream with spherical beam shaping optics. Fluorescence was measured with a 630/40 band pass filter in front of an H957-15 photomultiplier tube (Hamamatsu, Japan). This fluorescence signal was used to trigger acquisition.
G1 and G2/M population sorting
Asynchronous, replicating S. solfataricus cells (optical density (A600) of 0.4) were washed in 1 × PBS, fixed with 4% paraformaldehyde and then permeabilised with 0.2% Triton X-100 and 0.04% SDS. The cells were treated with 0.05 μg ml−1 DAPI and 100 μg ml−1 RNAseA. Flow cytometric analysis and sorting were carried out on a MoFlo high-speed sorter (Dako, Denmark). Multiline UV (1 W) from two coincident argon and krypton lasers (Coherent, USA) was focused onto the stream with spherical beam shaping optics. Fluorescence was measured with a 460/30 band pass filter in front of an H957-15 photomultiplier tube (Hamamatsu, Japan). This fluorescence signal was used to trigger acquisition.
Acknowledgments
NPR and SDB thank Malcolm White and Ed Bolt for the kind gifts of Hje and RusA, respectively. We also thank Christa Schelper for valuable advice on the UV irradiation of Sulfolobus cells and Iain Duggin for useful comments on the manuscript. Work in SDB's laboratory is funded by the Medical Research Council. KAB was supported by Cambridge Commonwealth Trust and Raymond and Beverly Sackler Studentships.
References
- Bell SD, Jackson SP (2001) Mechanism and regulation of transcription in archaea. Curr Opin Microbiol 4: 208–213 [DOI] [PubMed] [Google Scholar]
- Benard M, Maric C, Pierron G (2001) DNA replication-dependent formation of joint DNA molecules in Physarum polycephalum. Mol Cell 7: 971–980 [DOI] [PubMed] [Google Scholar]
- Bernander R (2003) The archaeal cell cycle: current issues. Mol Microbiol 48: 599–604 [DOI] [PubMed] [Google Scholar]
- Bernander R, Poplawski A (1997) Cell cycle characteristics of thermophilic archaea. J Bacteriol 179: 4963–4969 [DOI] [PMC free article] [PubMed] [Google Scholar]
- Duckett DR, Murchie AIH, Diekmann S, Vonkitzing E, Kemper B, Lilley DMJ (1988) The structure of the Holliday Junction, and its resolution. Cell 55: 79–89 [DOI] [PubMed] [Google Scholar]
- Duggin IG, Bell SD (2006) The chromosome replication machinery of the Archaeon Sulfolobus solfataricus. J Biol Chem 281: 15029–15032 [DOI] [PubMed] [Google Scholar]
- Emelyanov VV (2003) Mitochondrial connection to the origin of the eukaryotic cell. Eur J Biochem 270: 1599–1618 [DOI] [PubMed] [Google Scholar]
- Goldfless SJ, Morag AS, Belisle KA, Sutera VA Jr, Lovett ST (2006) DNA repeat rearrangements mediated by DnaK-dependent replication fork repair. Mol Cell 21: 595–604 [DOI] [PubMed] [Google Scholar]
- Gupta RS, Golding GB (1996) The origin of the eukaryotic cell. Trends Biochem Sci 21: 166–171 [PubMed] [Google Scholar]
- Horiike T, Hamada K, Kanaya S, Shinozawa T (2001) Origin of eukaryotic cell nuclei by symbiosis of Archaea in Bacteria is revealed by homology-hit analysis. Nat Cell Biol 3: 210–214 [DOI] [PubMed] [Google Scholar]
- Lake JA, Rivera MC (1994) Was the nucleus the first endosymbiont? Proc Natl Acad Sci USA 91: 2880–2881 [DOI] [PMC free article] [PubMed] [Google Scholar]
- Lemon KP, Grossman AD (2001) The extrusion-capture model for chromosome partitioning in bacteria. Genes Dev 15: 2031–2041 [DOI] [PubMed] [Google Scholar]
- Liberi G, Foiani M (2004) Initiation of DNA replication: a new hint from Archaea. Cell 116: 3–4 [DOI] [PubMed] [Google Scholar]
- Lopes M, Cotta-Ramusino C, Liberi G, Foiani M (2003) Branch migrating sister chromatid junctions form at replication origins through Rad51/Rad52-independent mechanisms. Mol Cell 12: 1499–1510 [DOI] [PubMed] [Google Scholar]
- Lucas I, Hyrien O (2000) Hemicatenanes form upon inhibition of DNA replication. Nucleic Acids Res 28: 2187–2193 [DOI] [PMC free article] [PubMed] [Google Scholar]
- Lundgren M, Andersson A, Chen LM, Nilsson P, Bernander R (2004) Three replication origins in Sulfolobus species: synchronous initiation of chromosome replication and asynchronous termination. Proc Natl Acad Sci USA 101: 7046–7051 [DOI] [PMC free article] [PubMed] [Google Scholar]
- Martin W (2005) Archaebacteria (Archaea) and the origin of the eukaryotic nucleus. Curr Opin Microbiol 8: 630–637 [DOI] [PubMed] [Google Scholar]
- Matsunaga F, Forterre P, Ishino Y, Myllykallio H (2001) In vivo interactions of archaeal Cdc6/Orc1 and minichromosome maintenance proteins with the replication origin. Proc Natl Acad Sci USA 98: 11152–11157 [DOI] [PMC free article] [PubMed] [Google Scholar]
- Myllykallio H, Lopez P, Lopez-Garcia P, Heilig R, Saurin W, Zivanovic Y, Philippe H, Forterre P (2000) Bacterial mode of replication with eukaryotic-like machinery in a hyperthermophilic archaeon. Science 288: 2212–2215 [DOI] [PubMed] [Google Scholar]
- Nielsen HJ, Li Y, Youngren B, Hansen FJ, Austin S (2006) Progressive segregation of the Escherichia coli chromosome. Mol Microbiol 61: 383–393 [DOI] [PubMed] [Google Scholar]
- Rivera MC, Lake JA (2004) The ring of life provides evidence for a genome fusion origin of eukaryotes. Nature 431: 152–155 [DOI] [PubMed] [Google Scholar]
- Robinson NP, Dionne I, Lundgren M, Marsh VL, Bernander R, Bell SD (2004) Identification of two origins of replication in the single chromosome of the archaeon Sulfolobus solfataricus. Cell 116: 25–38 [DOI] [PubMed] [Google Scholar]
- Salerno V, Napoli A, White MF, Rossi M, Ciaramella M (2003) Transcriptional response to DNA damage in the archaeon Sulfolobus solfataricus. Nucleic Acids Res 21: 6127–6138 [DOI] [PMC free article] [PubMed] [Google Scholar]
- Segurado M, Gomez M, Antequera F (2002) Increased recombination intermediates and homologous integration hot spots at DNA replication origins. Mol Cell 10: 907–916 [DOI] [PubMed] [Google Scholar]
- She Q, Singh RK, Confalonieri F, Zivanovic Y, Allard G, Awayez MJ, Chan-Weiher CCY, Clausen IG, Curtis BA, De Moors A, Erauso G, Fletcher C, Gordon PMK, Heikamp-de Jong I, Jeffries AC, Kozera CJ, Medina N, Peng X, Thi-Ngoc HP, Redder P, Schenk ME, Theriault C, Tolstrup N, Charlebois RL, Doolittle WF, Duguet M, Gaasterland T, Garrett RA, Ragan MA, Sensen CW, Van der Oost J (2001) The complete genome of the crenarchaeon Sulfolobus solfataricus P2. Proc Natl Acad Sci USA 98: 7835–7840 [DOI] [PMC free article] [PubMed] [Google Scholar]
- Sherratt DJ (2003) Bacterial chromosome dynamics. Science 301: 780–785 [DOI] [PubMed] [Google Scholar]
- Thanbichler M, Viollier PH, Shapiro L (2005) The structure and function of the bacterial chromosome. Curr Opin Gen Dev 15: 153–162 [DOI] [PubMed] [Google Scholar]
- Valens M, Penaud S, Rossignol M, Cornet F, Boccard F (2004) Macrodomain organization of the Escherichia coli chromosome. EMBO J 23: 4330–4341 [DOI] [PMC free article] [PubMed] [Google Scholar]