

Abstract
The presence of post-translational regulation of MHC class II (MHC II) under physiological conditions has been demonstrated recently in dendritic cells (DCs) that potently function as antigen-presenting cells (APCs). Here, we report that MARCH-I, an E3 ubiquitin ligase, plays a pivotal role in the post-translational regulation of MHC II in B cells. MARCH-I expression was particularly high in B cells, and the forced expression of MARCH-I induced the ubiquitination of MHC II. In B cells from MARCH-I-deficient mice (MARCH-I KO), the half-life of surface MHC II was prolonged and the ubiquitinated form of MHC II completely disappeared. In addition, MARCH-I-deficient B cells highly expressed exogenous antigen-loaded MHC II on their surface and showed high ability to present exogenous antigens. These results suggest that the function of MHC II in B cells is regulated through ubiquitination by MARCH-I.
Keywords: antigen presentation, B cell, MHC class II, traffic, ubiquitination
Introduction
Ubiquitination is an essential post-translational modification of proteins that ‘marks' proteins with ubiquitin molecules, often resulting in degradation (Hershko and Ciechanover, 1998). This modification is achieved through the action of three enzymes: ubiquitin-activating enzyme E1 (E1), ubiquitin-conjugating enzyme E2 (E2), and ubiquitin-protein ligase E3 (E3). E1 activates ubiquitin, and the activated ubiquitin is subsequently transferred to a substrate through the interaction of E2 and E3. Whereas E2 carries the activated ubiquitin, E3 conjugates ubiquitin moieties to the target substrate (Hershko and Ciechanover, 1998).
At present, ubiquitination is thought to play an important role in the degradation of membrane proteins through the induction of endocytosis (Dupre et al, 2004). In yeast, an E3, Rsp5p, has been reported to induce ubiquitination of the cytoplasmic tail of substrate proteins, a step that is necessary for the endocytosis and degradation of the substrate proteins (Dupre et al, 2004). Similarly, we and other groups have recently identified a novel family of E3 enzymes termed MIR family, whose catalytic domain is a variant RING domain (RINGv domain). The MIR family members have been shown to induce rapid endocytosis and degradation through the ubiquitination of the cytoplasmic tail of substrate proteins in mammals (Coscoy et al, 2001; Coscoy and Ganem, 2003; Goto et al, 2003; Bartee et al, 2004; Lehner et al, 2005; Ohmura-Hoshino et al, 2006a). The MIR family proteins share a secondary structure and the RINGv domain located at the amino terminus. They bind to the membrane through their hydrophobic domains located at the center, and possess two intracellular regions.
Most importantly, the forced expression of MIR family members was found to be capable of degrading immune recognition-related molecules, such as MHC class I (MHC I) and MHC II (Coscoy and Ganem, 2000, 2001; Ishido et al, 2000a, 2000b; Fruh et al, 2002; Ohmura-Hoshino et al, 2006b). However, the physiological substrates for these novel ubiquitin ligases remain completely unknown. Among the MIR family members, c-MIR and MARCH-I are of particular interest, because they can efficiently degrade important proteins in the immune system, and the surface expression of MHC II has been shown recently to be regulated by ubiquitination in dendritic cells (DCs) that potently function as antigen-presenting cells (APCs) (Goto et al, 2003; Bartee et al, 2004; Ohmura-Hoshino et al, 2006b; Shin et al, 2006). Within the E3 catalytic domain and transmembrane regions, the amino-acid identity between c-MIR and MARCH-I is >80%, suggesting similar functions. As MARCH-I expression was reported to be restricted to secondary lymphoid tissues such as spleen and lymph node, we have been especially interested in the functional elucidation of MARCH-I (Bartee et al, 2004).
In this report, we demonstrate that in B cells, the surface expression of MHC II is regulated through ubiquitination by MARCH-I, and the ubiquitination does not contribute to the internalization of surface MHC II. In parallel with the stabilization of surface MHC II, we found that MARCH-I-deficient B cells highly expressed exogenous antigen-loaded MHC II on their surface and showed high ability to present exogenous antigens. Thus, our results suggest that the function of MHC II on the surface of B cells is regulated through ubiquitination by MARCH-I.
Results
MARCH-I is highly expressed in B cells
To identify MARCH-I mRNA in vivo, we first performed Northern blot analysis in various tissues. Consistent with a previous report (Bartee et al, 2004), MARCH-I mRNA expression was restricted to secondary lymphoid tissues, such as spleen and lymph node (Figure 1A). Next, we generated MARCH-I-specific antibodies (Abs) to identify MARCH-I protein. Initially, we were unable to detect MARCH-I protein by Western blot analysis in all the examined tissues. As the MARCH-I protein expression level was expected to be low, we performed immunoprecipitation (IP)–Western blot analysis. Also, in order to increase the S/N ratio for detection, matrix conjugated with 13F11D12 anti-MARCH-I monoclonal antibody (mAb) was employed for IP, and a biotin-conjugated 4526 anti-MARCH-I polyclonal Ab was used for Western blot analysis. The epitopes for mAb and polyclonal Ab are different, as described in ‘Materials and methods.' As shown in Supplementary Figure 1C, we found a faint band (marked with *), whose MW is similar to that of a protein transcribed from the expected full-length MARCH-I cDNA. These results suggested that the MARCH-I protein expression levels are extremely low in vivo. To provide some clues to determine the physiological role of MARCH-I, we further examined the expression levels of MARCH-I mRNA in various hematopoietic cells in the spleen by real-time PCR. As shown in Figure 1B, MARCH-I mRNA was highly expressed in B cells, and among splenic B cells, follicular B cells in particular highly expressed MARCH-I mRNA (Figure 1C). DCs and macrophages moderately expressed MARCH-I mRNA, whereas the expression was relatively low in splenic T cells, suggesting that MARCH-I might mainly function in APCs.
Figure 1.
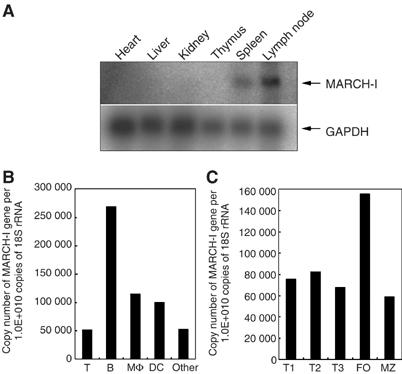
Expression profile of MARCH-I mRNA. (A) Expression profile of MARCH-I mRNA was analyzed by Northern blot in the indicated tissues. Data are representative of two independent experiments. (B) Expression levels of MARCH-I mRNA were compared among the indicated cell fractions in splenocytes. Data are representative of two independent experiments. (C) Expression levels of MARCH-I mRNA were compared among the indicated cell fractions in splenic B cells. Data are representative of two independent experiments. FO, follicular B cells; MZ, marginal zone B cells.
Downregulation and ubiquitination of MHC II by forced expression of MARCH-I
Next, we examined whether MARCH-I is functionally equivalent to c-MIR, using a 293T reconstitution system reported earlier (Ohmura-Hoshino et al, 2006b). As shown in Figure 2A, MARCH-I downregulated the surface expression of MHC II reconstituted with wild-type the I-A β chain. In contrast, the surface expression of MHC II reconstituted with the I-A β chain mutant, whose cytoplasmic lysine (the lysine residue at position 225 in the I-A β chain) was mutated to arginine, was not downregulated by MARCH-I. Also, a MARCH-I mutant, whose RINGv domain was disrupted by point mutation, was not able to downregulate MHC II surface expression. Consistent with these observations, MARCH-I ubiquitinated the cytoplasmic lysine residue within the I-A β chain, and its activity was dependent on the structure of the RINGv domain (Figure 2B). The downregulation of MHC II surface expression was also observed in two different murine B cell lines, A20 and M12 C3 cells (Griffith et al, 1988; Harding et al, 1995) (Figure 2C and D). Taken together, the forced expression of MARCH-I pointed to its broad functional homology with c-MIR.
Figure 2.
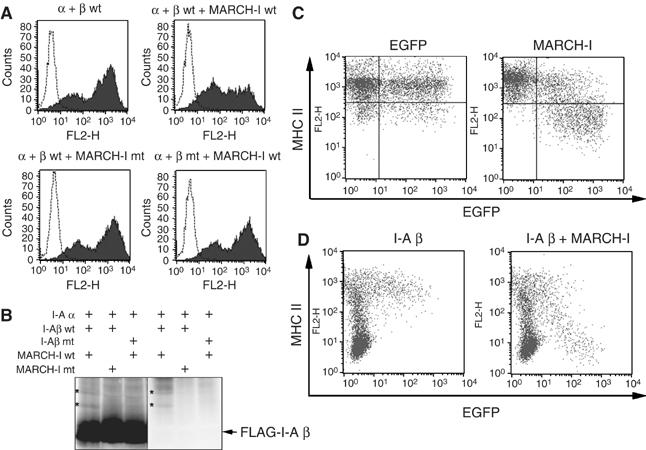
Downregulation and ubiquitination of MHC II by MARCH-I. (A) 293T cells were transfected with the expression plasmid indicated above each panel, with Fugene 6 reagent (Roche). Twenty-four hours after transfection, MHC II surface expression was analyzed by FACS. Data are representative of two independent experiments. (B) As indicated above each panel, 293T cells were cotransfected with several expression plasmids, and Flag-tagged I-A β chain was precipitated with anti-Flag Ab. Precipitated samples were probed with anti-Flag Ab (left) or anti-ubiquitin Ab (right). The band corresponding to the ubiquitinated I-A β chain is marked (*) as shown. Data are representative of two independent experiments. (C) A20 cells were transfected with plasmid expressing EGFP and MARCH-I from different promoters (right). In the left panel, only EGFP protein was expressed as control. MHC II surface expression level was examined by FACS. Data are representative of two independent experiments. (D) In M12 C3 cells that express the I-A α, but not I-A β, chain, I-A β chain alone (left) or MARCH-I plus I-A β chain (right) was expressed by electroporation with EGFP-coexpressing plasmid used in (C). MHC II surface expression was examined by FACS. Data are representative of two independent experiments.
MHC II expression is regulated through ubiquitination of the I-A β chain by MARCH-I
To examine whether MHC II is a physiological substrate for MARCH-I, we generated MARCH-I KO by gene targeting. As shown in Supplementary Figure 1A, exon 6 encoding the RINGv domain was flanked by two loxP sequences. After confirmation of insertion of three loxP sequences and a Neo cassette by Southern blot analysis, these mice were crossed with CAG-cre mice (Sakai and Miyazaki, 1997) to delete both exon 6 and the Neo cassette by cre-mediated recombination. Finally, two KO lines were established from two independent ES cells derived from 129 mice, as evaluated by Southern blot analysis (Supplementary Figure 1B). No MARCH-I protein was detected in these mice, demonstrating that these gene-targeted mice are indeed MARCH-I-null mice (Supplementary Figure 1C). FACS analysis did not show any significant abnormalities in the cellularity and development of T cells and B cells in the spleen (data not shown). Importantly, MHC II surface expression level was strikingly increased in the blood-circulating B cells from MARCH-I KO (Figure 3A). The extent of MHC II upregulation seems to parallel the extent of MARCH-I down-regulation. In contrast, the expression level of B7-1 was not altered (Figure 3A). Identical results were obtained from experiments with splenic B cells and splenic DCs in MARCH-I KO (data not shown). The same data were obtained from two different lines of MARCH-I KO.
Figure 3.
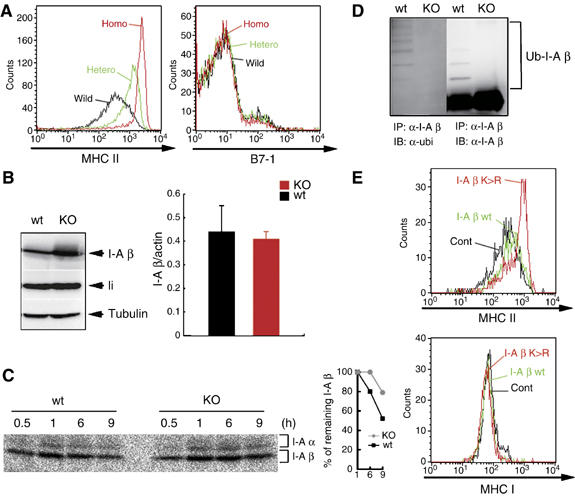
MHC II as a physiological substrate of MARCH-I. (A) MHC II (left) or B7-1 (right) surface expression was examined in blood-circulating B cells. Data from control littermates (wild), heterozygous MARCH-I KO (Hetero), and homozygous MARCH-I KO (Homo) are shown. Data are representative of two independent experiments. (B) In the left panel, I-A β chain protein or invariant chain (li) protein expression was examined in splenic B cells from respective mice. To show that the two samples have the same amount of loaded proteins, each sample was probed with anti-tubulin Ab. Data are representative of two independent experiments. Wt, control littermates; KO, homozygous MARCH-I KO. In the right panel, I-A β chain mRNA expression levels were compared between MARCH-I-deficient B cells (KO) and control B cells (Wt) by real-time PCR. Data are expressed as the mean±s.d. of triplicate samples, and values are representative of two independent experiments. (C) Splenic B cells from each mouse were pulse-labeled with [35S]methionine and [35S]cysteine for 30 min and chased for 0.5–9 h. Labeled protein samples were extracted and precipitated with Y-3P anti-I-A β chain Ab and analyzed by SDS–PAGE. At each point, the percentage of remaining I-A β chain was calculated relative to the amount of labeled I-A β chain at 1 h of chase (right panel). Data are representative of three independent experiments. (D) MHC II molecules were purified with Y-3P anti-I-A β chain Ab, and subjected to Western blot analysis with FK2 anti-ubiquitin Ab (left) or KL295 anti-I-A β chain Ab (right). Data are representative of two independent experiments. (E) Sca-1+ BM cells were infected with retrovirus that expresses the I-A β chain wild type (I-A β wt), I-A β chain mutant type (I-A β K>R), or human CD8 alone (Cont). Chimeric mice were generated with these modified BM cells. Eight weeks after reconstitution, blood-circulating B cells expressing the same level of human CD8 were analyzed in terms of MHC II expression level by FACS.
To examine whether the amount of MHC II protein is increased in splenic B cells from MARCH-I KO, we analyzed the total amount of I-A β chain protein with 0.1% SDS-containing lysis buffer. As shown in Figure 3B, the amount of I-A β chain protein was significantly increased in splenic B cells from MARCH-I KO compared with control littermates. In contrast, as we expected, the expression level of I-A β chain mRNA was not significantly altered as judged by real-time PCR, suggesting that the upregulation of MHC II occurs at the post-transcriptional level. To confirm this, pulse–chase analysis was performed. B cells from MARCH-I KO or control littermates were pulse-labeled with [35S]methionine and [35S]cysteine and chased for indicated periods. At the end of the chase periods, pulse-labeled proteins were immunoprecipitated with Y-3P anti-I-Ab β chain mAb that preferentially recognizes mature αβ dimers (Brachet et al, 1997), and the precipitated samples were boiled before SDS–PAGE. At 1 h of chase, bands corresponding to the I-A β chain in both groups showed maximal and identical intensities, suggesting that both types of B cells synthesize the same amount of mature MHC II (αβ dimers). In contrast, at 6 and 9 h of chase, the amount of remaining MHC II was significantly increased in MARCH-I KO, compared with control littermates (Figure 3C). Thus, the I-A β chain of MHC II protein was stabilized in splenic B cells from MARCH-I KO.
The data from experiments with forced expression of MARCH-I and experiments with MARCH-I KO strongly suggested that MHC II is a physiological substrate for MARCH-I. To test this hypothesis, we examined the status of ubiquitination of the I-A β chain in splenocytes. In the splenocytes from control littermates, the polyubiquitinated I-A β chains were clearly detected, but the ubiquitinated I-A β chains completely disappeared in the splenocytes from MARCH-I KO, demonstrating that the I-A β chain of MHC II is indeed a physiological substrate for MARCH-I (Figure 3D).
Furthermore, to confirm that MHC II surface expression is regulated by ubiquitination of the I-A β chain, we expressed the I-A β chain wild type (I-A β wt) or the I-A β chain mutant type, whose K225 was mutated to arginine (I-A β K>R), in bone marrow (BM) cells by using retrovirus that coexpress human CD8 as a marker, and generated chimeric mice with these modified BM cells. We also generated control chimeric mice with BM cells infected with control retrovirus expressing human CD8 alone. Eight weeks after reconstitution, blood-circulating B cells expressing the same level of human CD8 were analyzed among the three groups. As K225 in the I-A β chain is responsible for the downregulation and ubiquitination of MHC II by forcibly expressed MARCH-I (Figure 2A and B), B cells generated from the I-A β K>R-expressing virus-infected BM cells are expected to highly express MHC II, compared with B cells generated from the I-A β wt-expressing virus-infected BM cells. As shown in Figure 3B and E, cells generated from the I-A β wt-expressing virus-infected BM cells (I-A β wt) highly expressed MHC II compared with B cells generated from control BM cells (Cont), and B cells generated from the I-A β K>R-expressing virus-infected BM cells (I-A β K>R) showed even higher expression of MHC II than B cells generated from the I-A β wt-expressing virus-infected BM cells. In contrast, MHC I expression levels were indistinguishable among these groups. These results strongly suggest that in B cells, MHC II surface expression is regulated by ubiquitination of the I-A β chain.
Surface MHC II molecules are stabilized in MARCH-I-deficient B cells
As shown in Figure 3A, MHC II surface expression was remarkably increased in B cells from MARCH-I KO. The next question was how the MHC II surface expression was enhanced in MARCH-I KO. MHC II surface expression level is regulated by several steps: the assembly between α and β chains, peptide loading onto αβ dimers, trafficking to the cell surface, and internalizing from the surface. As Figure 3C shows that the assembly of MHC II was not impaired in MARCH-I KO, we examined whether the formation of peptide-loaded αβ dimers was altered in MARCH-I KO. B cells from MARCH-I KO or control littermates were pulse-labeled as in Figure 3C. At the end of the chase periods, pulse-labeled proteins were immunoprecipitated with Y-3P anti-I-Ab β chain mAb, and the precipitated samples were analyzed by SDS–PAGE without boiling the samples before electrophoresis. As shown in Figure 4A, in both groups, bands corresponding to SDS-stable compact dimers, which reflect peptide-loaded αβ dimers (c(α/β)), were equally detected at 6 h of chase, suggesting that the step for peptide loading was not impaired. Further, we examined whether the transport of MHC II to the surface was modified in MARCH-I KO. B cells from MARCH-I KO or control littermates were pulse-labeled as in Figure 4A, and at the end of the chase periods, the labeled cells were biotinylated with a membrane-impermeable reagent. The pulse-labeled and biotinylated MHC II molecules were immunoprecipitated with Y-3P mAb, followed by purification with streptavidin–agarose. As shown in Figure 4B, the transport efficiency of αβ dimers to the cell surface was slightly low in MARCH-I KO. Together, these findings did not explain how MHC II surface expression was increased in MARCH-I KO; rather, they suggest that the molecular events at the cell surface might be altered in MARCH-I KO. As the half-life of MHC II was prolonged (Figure 3C), we examined the half-life of surface MHC II in both types of mice. Surface MHC II molecules on splenic B cells were biotinylated and the stability of the biotinylated I-A β chains of MHC II was examined by IP–Western blot analysis. As MHC II surface expression was significantly upregulated in MARCH-I KO (Figure 5B), we used one-fifth of the total volume of each sample from MARCH-I KO at each chase point; otherwise, signals from the biotinylated I-A β chains from MARCH-I KO would have been too strong to enable precise comparison with those from control littermates. As shown in Figure 4C, the half-life of MHC II was significantly prolonged in B cells from MARCH-I KO. Collectively, these results indicate that MARCH-I modulates MHC II surface expression presumably through ubiquitination at the B cell surface. To investigate this hypothesis, we examined the status of ubiquitination of surface MHC II in B cells from control littermates. Surface MHC II molecules in B cells from control littermates were biotinylated, purified with streptavidin–agarose, and analyzed with KL295 MHC II mAb. The same samples were incubated with Y-3P MHC II mAb and precipitated MHC II proteins were analyzed with FK2 ubiquitin mAb or KL295 MHC II mAb. As shown in Figure 4D, in the sample purified with streptavidin–agarose, above the band corresponding to the unmodified I-A β chain, we detected additional bands showing similar MWs to those corresponding to the ubiquitinated I-A β chain. Thus, surface MHC II molecules in B cells were ubiquitinated.
Figure 4.
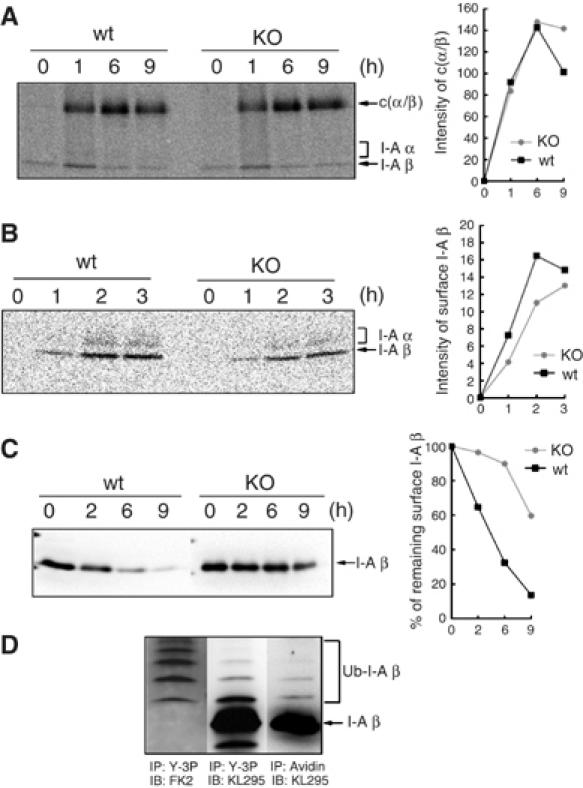
Stabilization of surface MHC II in MARCH-I-deficient B cells. (A) Splenic B cells from each mouse were pulse-labeled as shown in Figure 3C. Labeled protein samples were extracted and precipitated with Y-3P anti-I-A β chain Ab and analyzed by SDS–PAGE, without boiling the samples before electrophoresis. At each point, the intensity of SDS-stable compact dimer was measured with an image analyzer and presented far right from the panel. c(α/β) represents the SDS-stable compact dimer. Data are representative of two independent experiments. (B) Splenic B cells were pulse-labeled and chased as in (A). At the end of the chase periods indicated above the panel, each cell type was biotinylated with NHS-SS-biotin in PBS. The samples were precipitated with Y-3P anti-I-A β Ab, followed by precipitation with streptavidin–agarose. At each point, the intensity of the I-A β chain was measured with an image analyzer and presented far right from the panel. Data are representative of four independent experiments. (C) Surface MHC II molecules of splenic B cells were biotinylated and chased for 0–9 h. At each point, the amount of biotinylated MHC II was determined by Western blot analysis with KL295 anti-I-A β chain Ab, and the percentage of remaining surface I-A β was calculated relative to the value at 0 h (right panel). Data are representative of two independent experiments. (D) Surface MHC II molecules of splenic B cells from control littermates were biotinylated, purified with streptavidin–agarose, and analyzed with KL295 MHC II mAb (right panel). The same samples were incubated with Y-3P MHC II mAb and precipitated MHC II proteins were eluted with SDS buffer and analyzed with FK2 ubiquitin mAb (left panel) or KL295 MHC II mAb (middle panel). Data are representative of two independent experiments.
Figure 5.

Internalization and recycling of MHC II in MARCH-I-deficient B cells. (A) Purified B cells were pretreated with 10 μM bafilomycin A1 (Bafilo) or DMSO at 37°C for 30 min. Surface MHC II molecules of pretreated cells were biotinylated and chased for 0–120 min. At each point, the amount of biotinylated MHC II was determined by Western blot analysis with KL295 anti-I-A β chain Ab, and the percentage of remaining surface I-A β chain was presented far right from the panel. Data are representative of two independent experiments. (B) Surface molecules of the same number of splenic B cells from MARCH-I KO or control littermates were biotinylated and incubated at 37°C for 10 or 30 min. At each point, the remaining cell-surface biotin was cleaved by reducing its disulfide linkage. Upper panel shows the total amount of biotinylated surface I-A β chains and lower panel shows the amount of internalized I-A β chains at each incubation time. At each point, the percentage of internalized MHC II was calculated relative to the total amount of biotinylated surface I-A β chains, and presented far right from the panel. Data are representative of four independent experiments. (C) Purified B cells were stained with FITC-conjugated AF6-120.1 anti-I-A β chain mAb at 4°C and washed with 2% calf serum-containing PBS. Labeled B cells were cultured in RPMI with 10% fetal calf serum in the presence of 50 nM LysoTracer Red DND-99 or 5 μg/ml Alexa 594-conjugated transferrin (Invitrogen) for 60 min at 37°C. Cells were washed in an acidic solution to remove uninternalized Abs, fixed, and subjected to examination with a LEICA DMIRE2 confocal laser scanning microscope.
MHC II molecules are internalized and recycled in MARCH-I-deficient B cells
We previously found that B7-2 was rapidly degraded in lysosome by c-MIR, suggesting that MHC II might be degraded in the same manner by MARCH-I (Goto et al, 2003). To investigate this possibility, the rate of degradation of surface MHC II was examined in the presence of bafilomycin A1, which raises endolysosomal pH through the inhibition of vacuolar H+-ATPase. As shown in Figure 5A, the degradation of the surface I-A β chain was completely blocked in the presence of bafilomycin A1. Next, we examined whether the internalization of MHC II is inhibited in MARCH-I-deficient B cells, as we also found that surface MHC II molecules were rapidly internalized by c-MIR (Ohmura-Hoshino et al, 2006b). Surface MHC II molecules of MARCH-I-deficient B cells were biotinylated with a membrane-impermeable derivative of biotin. After incubation for 30 min, the remaining cell-surface biotin was cleaved with glutathione, and internalized proteins were collected using streptavidin-conjugated beads. The internalization rate of MHC II was analyzed with KL295 MHC II mAb. Unexpectedly, in MARCH-I KO, MHC II molecules were clearly internalized, as observed in control littermates (Figure 5B). These results demonstrate that ubiquitination is not essential for the internalization of MHC II in B cells.
These results suggest that ubiquitination mainly contributes to the sorting of MHC II into acidic organelles such as lysosome, for degradation, and in the absence of MARCH-I, internalized MHC II might be efficiently recycled to the surface, as MARCH-I-deficient B cells highly expressed MHC II on their surface (Figure 3A). To confirm these, we examined where the internalized MHC II molecules are localized in B cells from MARCH-I KO or control littermates. Surface MHC II molecules were labeled with FITC-conjugated AF6-120.1 anti-MHC II mAb at 4°C and chased for 60 min at 37°C. LysoTracker and transferrin were used to viably label the lysosomal compartment and the recycling compartment, respectively. To clearly visualize the internalized MHC II, labeled MHC II molecules remaining on the surface were removed with acidic solution. As shown in Figure 5C, MHC II molecules were internalized in both types of cells, and the amount of labeled MHC II detected inside MARCH-I-deficient B cells was larger than that detected inside B cells from control littermates. As expected, in B cells from control littermates, most internalized MHC II molecules were sorted into the lysosomal compartment (left panel in Figure 5C). In contrast, most internalized MHC II molecules were sorted into the recycling compartment in MARCH-I-deficient B cells (right panel in Figure 5C). Collectively, these results suggest that in B cells, MARCH-I-mediated ubiquitination of the I-A β chain leads to the sorting of MHC II into acidic organelles such as lysosome to regulate MHC II surface expression.
MARCH-I-deficient B cells highly present exogenous antigens through MHC II
As shown in Figure 3A, in MARCH-I-deficient B cells, the amount of surface MHC II was remarkably increased. The same result was obtained using Y-3P MHC II mAb that preferentially recognizes mature αβ dimers of MHC II, suggesting that surface MHC II expressed in MARCH-I-deficient B cells would be functional. To investigate this possibility, we examined whether MARCH-I-deficient B cells can express exogenous peptide-loaded MHC II on their surface. B cells from MARCH-I KO or control littermates were incubated with I-Eα peptide 52–68 for 20 h, and the surface expression of I-Eα peptide-loaded MHC II was monitored with Y-Ae mAb that specifically recognizes the complexes of I-Ab MHC II presenting the I-Eα peptide 52–68 (Rudensky et al, 1991). As shown in Figure 6A, MARCH-I-deficient B cells highly expressed I-Eα-peptide-loaded MHC II relative to B cells from control littermates. To confirm the enhanced presentation of the I-Eα peptide 52–68 in MARCH-I-deficient B cells, peptide-loaded B cells from MARCH-I KO or control littermates were fixed with 0.5% paraformaldehyde, and incubated with 20.6 T-T hybridoma that recognizes the MHC II–peptide complex detected with Y-Ae mAb (Ignatowicz et al, 1996). As shown in Figure 6B, IL-2 production from 20.6 T-T hybridoma was significantly enhanced in MARCH-I-deficient B cells. These results demonstrate that the expression of functional MHC II is increased in MARCH-I-deficient B cells.
Figure 6.
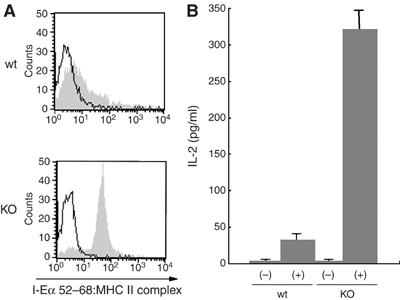
Enhanced antigen presentation by MARCH-I-deficient B cells. (A) Splenic B cells from each mouse type were incubated with 10 μM I-Eα peptide 52–68 for 20 h, and surface expression of I-Eα peptide-loaded MHC II was analyzed using Y-Ae mAb. Data are representative of two independent experiments. Open and shaded histograms show the values for non-incubation and incubation with peptide, respectively. (B) Splenic B cells incubated as in (A) were fixed with 0.5% paraformaldehyde and incubated with 20.6 T-T hybridoma overnight. IL-2 production from 20.6 T-T hybridoma was determined by enzyme-linked immunosorbent assay. Data are expressed as the mean±s.e.m. of triplicate samples, and values are representative of two independent experiments. (−) and (+) indicate non-incubation and incubation with peptide, respectively.
Discussion
In this report, we demonstrated two important novel findings in B cells: the presence of post-translational regulation of functional MHC II by ubiquitination, and the indispensable role of MARCH-I in MHC II ubiquitination. These important findings were based on the fact that the forced expression of MARCH-I downregulated MHC II surface expression through ubiquitination of the lysine residue at position 225 in the I-A β chain, and that surface functional MHC II molecules were stabilized owing to complete loss of ubiquitination of the I-A β chain of MHC II in MARCH-I-deficient B cells. Given that MHC II molecules are indispensable for T-cell-mediated immunity (Cosgrove et al, 1991), these novel findings serve as clues to understand the molecular basis of immune regulation.
MARCH-I was also expressed moderately in DCs and macrophages (Figure 1B), suggesting that MHC II is also regulated by ubiquitination in other APCs. Indeed, we found that MHC II expression was also augmented on the surface of bone-marrow-derived DCs (BMDCs) and splenic DCs in MARCH-I KO (Supplementary Figure 2A). In addition, the amount of ubiquitinated MHC II was decreased in BMDCs from MARCH-I KO, compared with those from control littermates (Supplementary Figure 2B). Interestingly, we found that in MARCH-I-deficient BMDCs, ubiquitinated MHC II did not completely disappear, indicating that other E3s might play a role in the ubiquitination of MHC II in BMDCs (Supplementary Figure 2B). In relation to this, we previously showed that c-MIR was expressed in DCs. c-MIR is a homologue of MARCH-I and acts to effectively downregulate and ubiquitinate MHC II (Ohmura-Hoshino et al, 2006b). Therefore, in DCs, c-MIR and MARCH-I might work together in ubiquitinating MHC II. On the other hand, in B cells, the expression level of c-MIR was extremely low (Ohmura-Hoshino et al, 2006b); thus, MARCH-I is thought to be a unique E3 for MHC II in B cells.
What is the role of MHC II ubiquitination in B cells? We showed that ubiquitination is crucial for the turnover of functional MHC II at the surface of B cells. In the absence of MARCH-I, an E3 for MHC II, the turnover of mature surface MHC II was decreased. As the results of experiments with Y-Ae mAb and I-Eα-specific T cell hybridoma indicated that stabilized MHC II molecules are capable of presenting exogenous antigens, MHC II ubiquitination might prevent excessive antigen presentation. In this connection, an important observation has been reported recently (Kitamura et al, 2006), strongly suggesting that MHC II surface expression is regulated by zinc-requiring enzymes. The catalytic domain of MARCH-I is a variant type of RING domain that requires zinc to maintain its structure and function as E3. DCs treated with TPEN, a zinc-chelating reagent, highly expressed MHC II on the surface and highly presented peptide antigens. Thus, in TPEN-treated DCs, MARCH-I might be inactivated owing to zinc deficiency, leading to an increase in MHC II surface expression. It would be interesting to investigate the status of MHC II ubiquitination in TPEN-treated DCs.
In order to answer the question of the role of MHC II ubiquitination in B cells, the results from MARCH-I KO have to be carefully interpreted, because other molecules might be targeted by MARCH-I in vivo. For example, the interpretation of the results showing increased ability of antigen presentation by MARCH-I-deficient B cells should be done with caution. Indeed, the forced expression of MARCH-I has been reported to downregulate transferrin receptor, B7-2, and Fas (Bartee et al, 2004). Therefore, to answer the question raised above, we are going to generate MHC II knock-in mice in which mutant I-A β, whose lysine residue at position 225 was mutated to arginine, is expressed in APCs. As shown in Figure 2B, mutant MHC II was not ubiquitinated by MARCH-I, so that in this knock-in mouse, the ubiquitination-mediated regulation of MHC II is expected to be disrupted.
In our experiments, we found that MHC II ubiquitination was not necessary for the internalization of MHC II in B cells. Previously, we demonstrated that the forced expression of c-MIR induced the rapid internalization of MHC II using A20 cells (Ohmura-Hoshino et al, 2006b). As c-MIR and MARCH-I are thought to share the molecular machineries for the downregulation of MHC II, we expected that MARCH-I contributes to the initiation of MHC II internalization from the plasma membrane. Unlike primary B cells used in this study, A20 cells might have different features of MHC II traffic. Indeed, we could not observe the spontaneous internalization of MHC II in A20 cells (Ohmura-Hoshino et al, 2006b). Thus, ubiquitination might play an important role in MHC II internalization in the situation where spontaneous internalization does not take place, such as in A20 cells. However, in the situation where spontaneous internalization takes place, ubiquitination might be no longer necessary for internalization. Recently, the contribution of the AP2 clathrin adaptor complex to the rapid internalization of MHC II was reported (Dugast et al, 2005; McCormick et al, 2005). It would be interesting to examine whether the AP2 complex is involved in the spontaneous internalization of MHC II in primary B cells.
MARCH-I is highly expressed in B cells. Why do B cells need MARCH-I? What happens when MHC II molecules are highly expressed in B cells? As long as the development of B cells was examined on the basis of the expression level of surface markers by FACS analysis, striking abnormalities could not be observed and a more fine-grained analysis is in order. In primary B cells, the molecular machinery for MHC II trafficking remains largely unknown. Our findings suggest that in native B cells, surface MHC II molecules are replaced with newly synthesized molecules through the degradation of pre-existing molecules, as is the case in immature DCs (Villadangos et al, 2005). Is this ‘MHC II metabolism by MARCH-I' necessary for B cell homeostasis? We are going to answer numerous open questions that are yet to be addressed.
Materials and methods
Molecular cloning
Murine MARCH-I cDNA was generated from total RNA of the spleen by RT–PCR. The gene-targeting vector was generated using murine BAC clones. Substitutions were generated into the cytoplasmic tail of the I-A β chain by PCR-based mutagenesis (Promega). To construct retroviral vectors, I-A β chain cDNA was subcloned into pMX–IRES–hCD8 (Yamasaki et al, 2006).
Mice
The XhoI-linearized gene-targeting vector was electroporated into R1 embryonic stem (ES) cells, and targeted ES cells were selected with G418. ES cell colonies were screened by Southern blot analysis. Four independent clones were injected into blast cysts and two independent clones gave rise to chimeric mice that transmitted the desired mutation to the germ line. Two independent gene-targeted mice were mated with CAG-Cre mice to generate MARCH-I KO. All mice were maintained under specific pathogen-free conditions according to RIKEN's guidelines for animal facilities and used for analysis at 8–12 weeks of age.
Northern blot analysis and quantification by real-time RT–PCR
For Northern blot analysis, 2 μg of poly (A) +RNA was extracted from various tissues, transferred to Hybond-N+ membrane (GE Healthcare Bio-Sciences), and probed with 32P-labeled cDNA probes. For MARCH-I mRNA quantification, the TaqMan Gene Expression Assay (Applied Biosystems) was employed, as described previously (Ohmura-Hoshino et al, 2006b). Quantitative analysis of I-A β chain expression was performed as described previously (Goto et al, 2003).
Pulse–chase analysis
Cells were labeled in medium containing 50 μCi of [35S]methionine and [35S]cysteine (Perkin Elmer) for 30 min and chased for the indicated time. Labeled proteins were extracted with 1% NP 40 buffer (1% NP 40, 300 mM NaCl, and 50 mM Tris buffer (pH 7.4)) containing protease inhibitors, and incubated with Y-3P anti-I-Ab Ab. Precipitated labeled MHC II molecules were subjected to quantitative analysis using Fuji BAS 2500 (FUJIFILM Corporation).
Detection of the ubiquitinated I-A β chain
In order to detect ubiquitination of the exogenous I-A β chain, we employed a previous method (Ohmura-Hoshino et al, 2006b). For detection of endogenous MHC II ubiquitinated in vivo, cell lysate was obtained by extraction with 1% NP 40 buffer containing 5 mM ethylmaleimide, and MHC II molecules were precipitated with Y-3P anti-I-Ab Ab coupled with CNBr-activated Sepharose 4B (GE Healthcare Bio-Sciences). The precipitated MHC II molecules were eluted with 0.1 M glycine–HCl (pH 2.7). The eluted samples were subjected to Western blot analysis with KL295 anti-I-A β Ab (ATCC) or FK2 anti-ubiquitin Ab (AFFINITI).
Detection of MARCH-I protein
Two Abs to MARCH-I were generated. The 4526 polyclonal Ab was generated with a synthetic peptide, GCETKLKPLRKWEKLQMTTS, corresponding to amino acids 123–140 of MARCH-I. 13F11D12 mAb was generated with a synthetic peptide, GCLNMWKKSKISTMYYLNQD, corresponding to amino acids 18–35 of MARCH-I. Protein sample was extracted with 0.1% SDS–Tris buffer from the spleen, and MARCH-I protein was precipitated with 13F11D12 anti-MARCH-I Ab coupled with protein G Sepharose (GE Healthcare Bio-Sciences). The precipitated MARCH-I protein was eluted with 2% SDS-containing PBS, and the eluted samples were analyzed with biotinylated 4526 anti-MARCH-I Ab.
Immunofluorescence microscopy
Purified B cells were stained with FITC-conjugated AF6-120.1 anti-I-A β chain mAb (BD Immunocytometry System) at 4°C and washed with 2% calf serum-containing PBS. Labeled B cells were cultured in RPMI with 10% fetal calf serum (FCS) in the presence of LysoTracer Red DND-99 or Alexa 594-conjugated transferrin (Invitrogen) at 37°C. Cells were washed in an acidic solution to remove uninternalized Abs, fixed, and examined with a LEICA DMIRE2 confocal laser scanning microscope.
Analysis of stability of surface MHC II
Splenic B cells were incubated with Sulfo-NHS-biotin (2 mg/ml) (Pierce) in PBS for 2 min on ice and chased for the indicated times. At the end of the chase periods, the protein samples were extracted with 0.1% SDS-containing PBS, and biotinylated proteins were precipitated with streptavidin–agarose (Pierce). Precipitated biotinylated samples were analyzed with KL295 anti-I-A β chain Ab.
Bone marrow transfer
Sca-1+ BM cells from C57BL/6 mice were purified with the MACS system (Miltenyi Biotec) and cultured at a density of 1 × 10⁶ cells/ml in RPMI with 10% FCS, 10 ng/ml IL-7, and 100 ng/ml stem cell factor (PeproTech). At days 1 and 2, cells were infected with the I-A β-chain expressing retrovirus. Four days after infection, hCD8+ cells were purified with the MACS system (Miltenyi Biotec) and transferred intravenously into irradiated (8.5 Gy) C57BL/6 mice. Eight weeks after transfer, examinations were performed.
Antigen presentation assay
Splenic B cells were incubated with 10 μM I-Eα peptide 52–68 for 20 h, and incubated B cells were stained with Y-Ae mAb that specifically recognizes the complexes of I-Ab MHC II presenting I-Eα peptide 52–68. Splenic B cells incubated with I-Eα peptides (3 × 10⁵) were fixed with 0.5% paraformaldehyde for 10 min at room temperature, mixed with 20.6 T-T hybridoma (5 × 10⁴) in 200 μl of a 96-well plate, and cultured overnight. IL-2 production from 20.6 T-T hybridoma was determined by enzyme-linked immunosorbent assay (BD).
Internalization assay
Internalization of MHC II was analyzed by cell-surface biotinylation assay. Splenic B cells were subjected to biotinylation on ice with the reversible membrane-impermeable derivative of biotin, sulfo-NHS-S-S-biotin (1.5 mg/ml) (Pierce), in PBS. Biotinylated B cells were incubated at 37°C for 30 min, and the remaining cell-surface biotin was cleaved by reducing its disulfide linkage with glutathione cleavage buffer. The internalized I-A β chain molecules were precipitated with streptavidin–agarose (Pierce) and analyzed with KL295 anti-I-A β chain Ab.
Cell preparation and reagents
Splenic B cells, T cells, macrophages, and DCs were purified from the spleens of C57BL/6 mice using the MACS system (Miltenyi Biotec). The fraction shown as ‘other' indicates the cell fraction that contained no B cells, T cells, Mφ or DCs. Among the splenic B cells, the T1, T2, T3, FO, and MZ fractions were collected based on the expression levels of B220, AA4.1. CD23 and were detected IgM using a FACS Vantage SE high-speed sorter (BD Immunocytometry System). HL3 CD11c Ab for DCs, 145-2C11 CD3 Ab for T cells, RA3-6B2 B220 Ab for B cells, and CI:A3-1 F4/80 for Mφ were used for the MACS system. RA8-6B2 B220, AA4.1 C1qRp, R6-60.2 IgM, and B3B4 CD23 Abs were used for FACS Vantage. Immature DCs were prepared by culturing BM cells obtained from each mouse with GM-CSF (20 ng/ml) (Pepro Tech) for 7 days. Seven days after cultivation, immature DCs were purified using CD11c beads (Miltenyi Biotec).
Statistics
Data from enzyme-linked immunosorbent assay and real-time RT–PCR were analyzed with the Student's t test. Values with P<0.05 were considered significant.
Supplementary Material
Supplementary Data 1
Supplementary Data 2
Legend to Supplementary Data 1
Legend to Supplementary Data 2
Acknowledgments
We thank T Hirano and T Kurosaki for encouragement and helpful discussion, K Inaba for providing Y-Ae mAb and 20.6 T-T hybridoma, M Kasai for providing Y-3P mAb, S Yamasaki for providing pMX–IRES–hCD8 and technical advice, A Furuno for technical advise, R Triendl for critical reading of the paper, and K Nakamura for paper preparation. This work was supported in part by a Grant-in-Aid for Scientific Research from the Ministry of Education, Science, Sports, and Culture (MEXT) of Japan and by the Japan Society for the Promotion of Science (JSPS).
References
- Bartee E, Mansouri M, Hovey Nerenberg BT, Gouveia K, Fruh K (2004) Downregulation of major histocompatibility complex class I by human ubiquitin ligases related to viral immune evasion proteins. J Virol 78: 1109–1120 [DOI] [PMC free article] [PubMed] [Google Scholar]
- Brachet V, Raposo G, Amigorena S, Mellman I (1997) Ii chain controls the transport of major histocompatibility complex class II molecules to and from lysosomes. J Cell Biol 137: 51–65 [DOI] [PMC free article] [PubMed] [Google Scholar]
- Coscoy L, Ganem D (2000) Kaposi's sarcoma-associated herpesvirus encodes two proteins that block cell surface display of MHC class I chains by enhancing their endocytosis. Proc Natl Acad Sci USA 97: 8051–8056 [DOI] [PMC free article] [PubMed] [Google Scholar]
- Coscoy L, Ganem D (2001) A viral protein that selectively downregulates ICAM-1 and B7-2 and modulates T cell costimulation. J Clin Invest 107: 1599–1606 [DOI] [PMC free article] [PubMed] [Google Scholar]
- Coscoy L, Ganem D (2003) PHD domains and E3 ubiquitin ligases: viruses make the connection. Trends Cell Biol 13: 7–12 [DOI] [PubMed] [Google Scholar]
- Coscoy L, Sanchez DJ, Ganem D (2001) A novel class of herpesvirus-encoded membrane-bound E3 ubiquitin ligases regulates endocytosis of proteins involved in immune recognition. J Cell Biol 155: 1265–1273 [DOI] [PMC free article] [PubMed] [Google Scholar]
- Cosgrove D, Gray D, Dierich A, Kaufman J, Lemeur M, Benoist C, Mathis D (1991) Mice lacking MHC class II molecules. Cell 66: 1051–1066 [DOI] [PubMed] [Google Scholar]
- Dugast M, Toussaint H, Dousset C, Benaroch P (2005) AP2 clathrin adaptor complex, but not AP1, controls the access of the major histocompatibility complex (MHC) class II to endosomes. J Biol Chem 280: 19656–19664 [DOI] [PubMed] [Google Scholar]
- Dupre S, Urban-Grimal D, Haguenauer-Tsapis R (2004) Ubiquitin and endocytic internalization in yeast and animal cells. Biochim Biophys Acta 1695: 89–111 [DOI] [PubMed] [Google Scholar]
- Fruh K, Bartee E, Gouveia K, Mansouri M (2002) Immune evasion by a novel family of viral PHD/LAP-finger proteins of gamma-2 herpesviruses and poxviruses. Virus Res 88: 55–69 [DOI] [PubMed] [Google Scholar]
- Goto E, Ishido S, Sato Y, Ohgimoto S, Ohgimoto K, Nagano-Fujii M, Hotta H (2003) c-MIR, a human E3 ubiquitin ligase, is a functional homolog of herpesvirus proteins MIR1 and MIR2 and has similar activity. J Biol Chem 278: 14657–14668 [DOI] [PubMed] [Google Scholar]
- Griffith IJ, Nabavi N, Ghogawala Z, Chase CG, Rodriguez M, McKean DJ, Glimcher LH (1988) Structural mutation affecting intracellular transport and cell surface expression of murine class II molecules. J Exp Med 167: 541–555 [DOI] [PMC free article] [PubMed] [Google Scholar]
- Harding CV, France J, Song R, Farah JM, Chatterjee S, Iqbal M, Siman R (1995) Novel dipeptide aldehydes are proteasome inhibitors and block the MHC-I antigen-processing pathway. J Immunol 155: 1767–1775 [PubMed] [Google Scholar]
- Hershko A, Ciechanover A (1998) The ubiquitin system. Annu Rev Biochem 67: 425–479 [DOI] [PubMed] [Google Scholar]
- Ignatowicz L, Kappler J, Marrack P (1996) The repertoire of T cells shaped by a single MHC/peptide ligand. Cell 84: 521–529 [DOI] [PubMed] [Google Scholar]
- Ishido S, Choi JK, Lee BS, Wang C, DeMaria M, Johnson RP, Cohen GB, Jung JU (2000a) Inhibition of natural killer cell-mediated cytotoxicity by Kaposi's sarcoma-associated herpesvirus K5 protein. Immunity 13: 365–374 [DOI] [PubMed] [Google Scholar]
- Ishido S, Wang C, Lee BS, Cohen GB, Jung JU (2000b) Downregulation of major histocompatibility complex class I molecules by Kaposi's sarcoma-associated herpesvirus K3 and K5 proteins. J Virol 74: 5300–5309 [DOI] [PMC free article] [PubMed] [Google Scholar]
- Kitamura H, Morikawa H, Kamon H, Iguchi M, Hojyo S, Fukada T, Yamashita S, Kaisho T, Akira S, Murakami M, Hirano T (2006) Toll-like receptor-mediated regulation of zinc homeostasis influences dendritic cell function. Nat Immunol 7: 971–977 [DOI] [PubMed] [Google Scholar]
- Lehner PJ, Hoer S, Dodd R, Duncan LM (2005) Downregulation of cell surface receptors by the K3 family of viral and cellular ubiquitin E3 ligases. Immunol Rev 207: 112–125 [DOI] [PubMed] [Google Scholar]
- McCormick PJ, Martina JA, Bonifacino JS (2005) Involvement of clathrin and AP-2 in the trafficking of MHC class II molecules to antigen-processing compartments. Proc Natl Acad Sci USA 102: 7910–7915 [DOI] [PMC free article] [PubMed] [Google Scholar]
- Ohmura-Hoshino M, Goto E, Matsuki Y, Aoki M, Mito M, Uematsu M, Hotta H, Ishido S (2006a) A novel family of membrane-bound e3 ubiquitin ligases. J Biochem (Tokyo) 140: 147–154 [DOI] [PubMed] [Google Scholar]
- Ohmura-Hoshino M, Matsuki Y, Aoki M, Goto E, Mito M, Uematsu M, Kakiuchi T, Hotta H, Ishido S (2006b) Inhibition of MHC class II expression and immune responses by c-MIR. J Immunol 177: 341–354 [DOI] [PubMed] [Google Scholar]
- Rudensky A, Rath S, Preston-Hurlburt P, Murphy DB, Janeway CA Jr (1991) On the complexity of self. Nature 353: 660–662 [DOI] [PubMed] [Google Scholar]
- Sakai K, Miyazaki J (1997) A transgenic mouse line that retains Cre recombinase activity in mature oocytes irrespective of the cre transgene transmission. Biochem Biophys Res Commun 237: 318–324 [DOI] [PubMed] [Google Scholar]
- Shin JS, Ebersold M, Pypaert M, Delamarre L, Hartley A, Mellman I (2006) Surface expression of MHC class II in dendritic cells is controlled by regulated ubiquitination. Nature 444: 115–118 [DOI] [PubMed] [Google Scholar]
- Villadangos JA, Schnorrer P, Wilson NS (2005) Control of MHC class II antigen presentation in dendritic cells: a balance between creative and destructive forces. Immunol Rev 207: 191–205 [DOI] [PubMed] [Google Scholar]
- Yamasaki S, Ishikawa E, Sakuma M, Ogata K, Sakata-Sogawa K, Hiroshima M, Wiest DL, Tokunaga M, Saito T (2006) Mechanistic basis of pre-T cell receptor-mediated autonomous signaling critical for thymocyte development. Nat Immunol 7: 67–75 [DOI] [PubMed] [Google Scholar]
Associated Data
This section collects any data citations, data availability statements, or supplementary materials included in this article.
Supplementary Materials
Supplementary Data 1
Supplementary Data 2
Legend to Supplementary Data 1
Legend to Supplementary Data 2