

Abstract
Objectives
The goal of this study was to examine the cross-sectional associations of cardiovascular risk factors with left ventricular (LV) geometry and systolic function measured by cardiac magnetic resonance imaging (MRI) in the Multi-Ethnic Study of Atherosclerosis (MESA).
Background
Cardiovascular risk factors including hypertension, smoking, and obesity are known to be associated with increased LV mass, but less is known about the association of risk factors with LV systolic function, particularly in populations without clinical cardiovascular disease.
Methods
Participants were from four racial/ethnic groups and were free of clinical cardiovascular disease. Blood pressure, health habits, body mass index, lipid levels, and glucose abnormalities were assessed and MRI exams performed at baseline (N= 4869). Multivariable linear regression was used to model the association of risk factors with LV mass, end-diastolic volume, stroke volume, ejection fraction, and cardiac output.
Results
The mean age was 62 years, and 52 percent of participants were women. After adjustment for sociodemographic variables and height, higher systolic blood pressure and body mass index were associated with larger LV mass and volumes. Current smoking and diabetes were associated with greater LV mass (+7.7g, 95% confidence interval (CI) +5.5, +9.9; +3.5g, CI +1.2, +5.8), and with lower stroke volume (−1.9 ml, CI −3.3, −0.5; −4.5 ml, CI −6.0, −3.0) and lower ejection fraction (−1.6%, CI −2.1, −1.0; −0.8%, CI −1.5, −0.2).
Conclusions
In this cohort free of clinical cardiovascular disease, modifiable risk factors were associated with subclinical alterations in LV size and systolic function as detected by cardiac MRI.
CONDENSED ABSTRACT
We examined the cross-sectional associations of cardiovascular risk factors with LV geometry and systolic function measured by MRI. We studied 4869 participants without clinical cardiovascular disease in the Multi-Ethnic Study of Atherosclerosis. After adjustment for sociodemographic variables and height, higher systolic blood pressure and body mass index were associated with larger LV mass and volumes, and current smoking and diabetes were associated with greater LV mass and lower stroke volume, although on average, the differences were small. Additional study is needed of these modifiable risk factors and their treatment in relation to the new development or progression of LV dysfunction.
Keywords: cardiac output, cardiac volume, epidemiology, magnetic resonance imaging, hypertension, hypertrophy
Abbreviations: LV = left ventricular, MRI = magnetic resonance imaging, MESA = Multi-Ethnic Study of Atherosclerosis, CARDIA = Coronary Artery Risk Development in Young Adults Study, ICC = intraclass correlation coefficient
Large epidemiologic studies of left ventricular (LV) geometry and systolic function have generally relied upon echocardiography(1–3). High systolic blood pressure, smoking, and obesity have been consistently associated with elevated LV mass, but less information is available about the association of traditional cardiovascular risk factors with LV systolic function, particularly in asymptomatic populations. Magnetic resonance imaging (MRI) of the heart provides accurate and reproducible measurement of LV mass, volumes, and systolic function(4), is not limited by acoustic windows as is echocardiography, does not rely upon geometric assumptions about the shape of the ventricle, and does not require exposure to ionizing radiation. Thus MRI is an appropriate non-invasive technology for investigating subclinical alterations in LV size and systolic function.
The Multi-Ethnic Study of Atherosclerosis (MESA) is the first large-scale application of cardiac MRI in a multi-center study and in a multi-ethnic population. Most previous studies of cardiac MRI have been limited by the inclusion of small numbers of participants, a focus on patients with pre-existing cardiovascular disease, or incomplete information on risk factors. We used data from the baseline examination in MESA to examine the cross-sectional relationships of traditional cardiovascular risk factors with five MRI measurements: LV mass, end-diastolic volume, stroke volume, ejection fraction, and cardiac output, in people without clinical cardiovascular disease.
Methods
Setting
MESA was designed to investigate the pathogenesis of atherosclerosis in four racial/ethnic groups by providing accurate measurement of early cardiovascular disease and its progression. Between July 2000 and September 2002, 6814 men and women age 45–84 years were enrolled from six US communities (5,6). Potential participants were contacted by random digit dialing or by informational brochures mailed to households identified by sampling frames such as census data or by geographical criteria. Institutional review boards at all study centers approved the study protocol, and informed consent was obtained from participants. Participants were recruited from four ethnic groups: White, African-American, Hispanic, and Asian (of Chinese descent); race and ethnicity were self-reported. All participants were free of clinically recognized cardiovascular disease at enrollment.
Baseline examination
Participants underwent an extensive baseline evaluation including measurement of height, weight, and waist circumference, and assessment by questionnaire of smoking, alcohol intake, educational attainment, exercise (including team sports, dance, moderate individual activities or conditioning, vigorous dual sports or conditioning, and walking for exercise), current medications, and physician diagnoses of hypertension and diabetes(5). Blood pressure was measured three times in the seated position with a Dinamap device(7); the mean of the second and third measurements was used in the analysis. Heart rate was monitored and recorded at the time of the MRI exam. Glucose, triglyceride, total and HDL cholesterol levels were measured after a 12-hour fast and LDL cholesterol level was calculated with the Friedewald equation(8).
Magnetic resonance imaging
Consenting participants underwent a cardiac MRI scan a median of 16 days after the baseline evaluation; 95 percent were completed by 11 weeks after the baseline examination. Participation in the MRI exam was voluntary. MRI exams were performed using scanners with 1.5-T magnets as previously described(9). All imaging was performed with a four-element, phased-array surface coil positioned anteriorly and posteriorly, electrocardiographic gating, and brachial artery blood pressure monitoring. Imaging consisted of fast gradient echo cine images of the left ventricle with time resolution less than 50 msec. Functional parameters and mass were determined by volumetric imaging. Imaging data were read using MASS software (version 4.2, Medis, The Netherlands) at a single reading center by readers trained in the MESA protocol and without knowledge of risk factor information. Papillary muscles were included in the LV volumes and excluded from LV mass. Cardiac output was calculated as stroke volume (end-diastolic volume minus end-systolic volume) x heart rate. Ejection fraction was calculated as stroke volume divided by end-diastolic volume. The reliability of the MRI readings was determined by calculating for a set of 155 duplicate readings the intraclass correlation (ICC), the ratio of the variance of the variable if precisely meaured (without measurement error) over the observed variance of the variable (with measurement error). An ICC reliability estimate of 0.95 means that 5% of the total variability is attributed to reader measurement error. For LV mass, ICC was 0.97 (95% confidence interval [CI] 0.96, 0.98), for end diastolic volume, 0.98 (CI 0.97, 0.99), and for end systolic volume, 0.95 (CI 0.93, 0.96).
Statistical Analysis
We identified key variables that assess traditional cardiovascular risk factors; the variables selected were systolic blood pressure, diastolic blood pressure, tobacco use, alcohol use, exercise (expressed as total MET-hours/week, where MET is defined as the ratio of work metabolic rate to a standard resting metabolic rate(10)), body mass index, LDL and HDL cholesterol, and glucose abnormalities. Participants were classified into three mutually exclusive categories regarding glucose metabolism; those with a fasting glucose >= 126 mg/dL or who used insulin or hypoglycemic agents were classified as having diabetes, non-diabetics with fasting glucose >= 100 and < 126 mg/dL were classified as having impaired fasting glucose, and non-diabetics with fasting glucose <100 mg/dL were classified as normoglycemic(11). Risk factor data were missing for less than 0.5 percent of participants for all variables except alcohol use and LDL cholesterol, which were missing for less than 1.5 percent of participants.
We examined plots of the mean value of each MRI measurement with levels of each risk factor after adjustment for the sociodemographic characteristics of age, gender, race, and clinic location, and adjustment for height as a measure of body size. Linear relationships with all MRI measurements were apparent for age, alcoholic drinks per week, body mass index, LDL and HDL cholesterol, and MET-hours per week of exercise. For systolic and diastolic blood pressure, we explored the possibility of non-linear associations by including squared terms in the regression models. Among the tobacco use categories, only current cigarette smoking was associated with the MRI measurements, and thus current smoking was modeled as a dichotomous variable.
We used multivariable linear regression to identify traditional cardiovascular risk factors independently associated with the cardiac MRI measurements; significance was declared at p<0.05. All of the risk factors were retained in the models in addition to the sociodemographic variables and height. In a series of models, we introduced interaction terms between each significant cardiovascular risk factor and the sociodemographic variables of age (<65 or >=65 years), gender, and race; significance for interactions was declared at p<0.002 after Bonferroni correction for an average of 21 subgroup comparisons per MRI measurement. In sensitivity analyses, height squared(12) and height to the 2.7 power(13) were examined as alternatives to height as methods of adjustment for body size. Body surface area was not used to adjust for body size since obesity was of interest as a traditional cardiovascular risk factor, and adjustment for body surface area attenuates associations between obesity and LV mass. Waist circumference at the baseline exam and self-reported body mass index at ages 20 and 40 years were examined as alternatives to baseline body mass index as measures of obesity. The association of systolic and diastolic blood pressures with ejection fraction were examined across pre-specified categories of blood pressure(14). All analyses were conducted using Stata Statistical Software: Release 8.0 (College Station, TX: Stata Corporation). These analyses were based on the updated MESA database, which incorporated minor corrections through November 2005.
Results
Of the 6814 MESA participants, 5004 (73%) completed the cardiac MRI and had technically adequate data. Reasons for not completing the cardiac MRI included ineligible (7% of 6814), usually because of metallic fragment, implant, or device, unable (14%), usually because of claustrophobia, refusal (3%), mechanical problem with the scanner (0.4%), or unknown (1%). Data on one or more cardiovascular risk factors were missing for 135 participants (3 percent), and they were excluded. Compared to those not included in the analysis (n=1945), the 4869 participants included were on average slightly younger (62 vs. 64 years), had lower average systolic blood pressure (125 vs. 130 mmHg) and body mass index (27.7 vs. 29.8 kg/m2); a smaller proportion were African American (26% vs. 33%) and a larger proportion Asian (13 vs. 9%), and a smaller proportion had treated hypertension (31% vs. 38%) or diabetes (13% vs. 18%, all differences significant at p<0.05). Among those included in the analysis, the mean age was 62 years (standard deviation 10), 52 percent were women, 39 percent White, 26 percent African-American, 22 percent Hispanic, and 13 percent Asian (Table 1). Considering men and women together, 31 percent had treated hypertension, 27 percent had impaired fasting glucose, and 13 percent had diabetes. Only 13 percent were current smokers and the mean number of alcoholic drinks per week was 1.9 in women and 6.3 in men.
Table 1.
Characteristics of 4869 MESA participants with cardiac MRI included in the analysis
| Women (n=2546) | Men (n=2323) | |
|---|---|---|
| Mean (SD) or % | Mean (SD) or % | |
| Age, yrs | 61 (10) | 62 (10) |
| Race, % | ||
| White | 39.2 | 38.9 |
| African American | 26.8 | 24.6 |
| Hispanic | 21.1 | 23.2 |
| Asian | 12.9 | 13.3 |
| High school graduate or less, % | 37.8 | 30.3 |
| Systolic BP, mm Hg | 126 (23) | 125 (19) |
| Diastolic BP, mm Hg | 69 (10) | 75 (9) |
| Hypertension *, % | 43.3 | 40.6 |
| Treated hypertension †, % | 32.8 | 28.8 |
| Current cigarette smoker, % | 11.0 | 14.5 |
| Alcohol use, drinks/week | 1.9 (5.1) | 6.3 (10.8) |
| Exercise, MET-hrs/week | 23.4 (33.8) | 30.2 (44.3) |
| Body mass index, kg/m2 | 28.0 (5.6) | 27.4 (4.1) |
| LDL cholesterol, mmol/L [mg/dL] | 3.0 (0.8) [117 (32)] | 3.0 (0.8) [117 (31)] |
| HDL cholesterol, mmol/L [mg/dL] | 1.5 (0.4) [57 (15)] | 1.2 (0.3) [45 (12)] |
| Use of lipid-lowering medication, % | 16.4 | 14.6 |
| Impaired fasting glucose, % | 22.2 | 31.6 |
| Diabetes, % | 11.4 | 14.0 |
Hypertension was defined as blood pressure ≥140 mmHg systolic or ≥90 mmHg diastolic, or with treated hypertension.
Treated hypertension was defined as a history of a physician diagnosis of hypertension and taking antihypertensive medication.
BP = blood pressure, LDL = low density lipoprotein, HDL = high density lipoprotein
Data were available for all 4869 participants for all five MRI measurements of interest except cardiac output, which was available for 4850 participants. The sex-specific means and standard deviations of the MRI measurements are shown in Table 2. For LV mass, the mean (SD) expressed in units of grams divided by height in meters was 77 (16) g/m in women and 97 (21) g/m in men.
Table 2.
Sex-specific mean and standard deviation of LV mass, end-diastolic volume, stroke volume, ejection fraction, and cardiac output by cardiac MRI in MESA participants
| Women (n=2546)* | Men (n=2323) † | |||
|---|---|---|---|---|
| Mean | Standard deviation | Mean | Standard deviation | |
| LV Mass (g) | 124 | 27 | 169 | 37 |
| LV End-diastolic Volume (ml) | 114 | 24 | 140 | 33 |
| LV Stroke Volume (ml) | 81 | 17 | 93 | 21 |
| LV Ejection Fraction (%) | 71 | 7 | 67 | 7 |
| Cardiac Output ‡ (L/min) | 5.4 | 1.4 | 6.0 | 1.5 |
n=2536 for cardiac output only
n=2314 for cardiac output only
The results from the five separate multivariable statistical models for the cardiac MRI measurements are shown in the five columns of Table 3. The first row of the table indicates the proportion of the variability in each MRI measurement explained by the full model (including all the cardiovascular risk factors, the sociodemographic variables, and height), that is, the adjusted R2. The second row indicates the proportion of the variability remaining after adjustment for sociodemographic variables and height that was explained by the cardiovascular risk factors. Below, the coefficients and 95% confidence intervals (CI) listed for each risk factor express the mean difference in each MRI measurement associated with that risk factor after adjustment for all of the other cardiovascular risk factors in the model, the sociodemographic variables, and height. For continuous variables such as blood pressure, the associations with MRI measurements are expressed in standard deviation units. For example, for each standard deviation (21 mm Hg) increase in systolic blood pressure, the mean LV mass was 9.6 g greater (95% CI: 8.5, 10.8). A term for the square of systolic blood pressure was included only in the models for ejection fraction and cardiac output; diastolic blood pressure squared was included only in the model for ejection fraction.
Table 3.
Multivariable analysis of traditional cardiovascular risk factors in relation to LV mass, volumes, and systolic function
| LV Mass (g) | LV End-diastolic Volume (ml) | LV Stroke Volume (ml) | LV Ejection Fraction (%) | Cardiac Output ‡ (L/min) | |
|---|---|---|---|---|---|
| Proportion of variability explained by full model* | 59.6% | 43.8% | 34.9% | 17.8% | 22.3% |
| Proportion of variability explained by the CV risk factors† | 26.1% | 12.2% | 14.5% | 2.4% | 11.2% |
| Risk Factor | Coefficient ‡ (95% Confidence Interval) | ||||
| Systolic blood pressure, per 21 mmHg | 9.6 (8.5, 10.8) ¶ | 6.4 (5.3, 7.5) ¶ | 5.5 (4.8, 6.2) ¶ | 1.2 (0.9, 1.5) ¶ | 0.26 (0.20, 0.33) ¶ |
| Systolic blood pressure squared, per 21 mmHg2 | −0.1 (−0.3, 0.0) | −0.04 (−0.07, −0.02) ¶ | |||
| Diastolic blood pressure, per 10 mmHg | −1.1 (−2.2, 0.0) | −4.3 (−5.3, −3.3) ¶ | −4.3 (−5.0, −3.6) ¶ | −1.1 (−1.4, −0.8) ¶ | −0.05 (−0.11, 0.01) |
| Diastolic blood pressure squared, per 10 mmHg2 | −0.3 (−0.4, −0.1) ¶ | ||||
| Current smoking | 7.7 (5.5, 9.9) ¶ | 0.9 (−1.2, 2.9) | −1.9 (−3.3, −0.5) ¶ | −1.6 (−2.1, −1.0) ¶ | −0.14 (−0.25, −0.03 [] |
| Alcohol intake, per 9 drinks/week | 0.4 (−0.3 1.2) | −0.4 (−1.1, 0.3) | −0.2 (−0.7, 0.2) | 0.0 (−0.2, 0.2) | −0.03 (−0.07, 0.01) |
| Exercise, per 27 MET−hours per week | 0.9 (0.4, 1.4) ¶ | 0.7 (0.2, 1.1) ¶ | 0.5 (0.2, 0.8) ¶ | 0.0 (−0.1, 0.2) | 0.00 (−0.03, 0.03) |
| Body mass index, per 5 kg/m2 | 11.7 (10.9, 12.6) ¶ | 8.4 (7.6, 9.2) ¶ | 5.9 (5.3, 6.4) ¶ | 0.0 (−0.2, 0.2) | 0.41 (0.37, 0.45) ¶ |
| LDL cholesterol, per 31 mg/dL | −1.1 (−1.8, −0.4) ¶ | −0.9 (−1.6, −0.2) [] | −0.6 (−1.1, −0.2) ¶ | 0.0 (−0.2, 0.2) | −0.04 (−0.08, 0.00) [] |
| HDL cholesterol, per 15 mg/dL | 0.1 (−0.7, 1.0) | 1.8 (1.0, 2.6) ¶ | 1.1 (0.6, 1.7) ¶ | 0.0 (−0.3, 0.2) | 0.07 (0.03, 0.11) ¶ |
| Impaired fasting glucose (vs. Normoglycemic) | −1.2 (−2.9, 0.5) | −3.8 (−5.5, −2.2) ¶ | −2.5 (−3.6, −1.4) ¶ | 0.2 (−0.3, 0.6) | 0.02 (−0.07, 0.11) |
| Diabetes (vs. Normoglycemic) | 3.5 (1.2, 5.8) ¶ | −4.6 (−6.8, −2.4) ¶ | −4.5 (−6.0, −3.0) ¶ | −0.8 (−1.5, −0.2) ¶ | 0.12 (0.00, 0.24) |
Proportion of the total variability (adjusted R2) explained by the sociodemographic variables, height, and the cardiovascular risk factors
Proportion of the variability remaining after adjustment for sociodemographic variables and height that was explained by the cardiovascular risk factors
Adjusted for sociodemographic variables (age, gender, race/ethnicity, clinic site) and height, and the risk factors listed in the leftmost column; systolic blood pressure squared was included only in the models for ejection fraction and cardiac output; diastolic blood pressure squared was included only in the model for ejection fraction
Data were available on cardiac output for 4850 participants; for all other MRI measurements, data were available for 4869 participants.
Test for significance of coefficient, p<0.05
Test for significance of coefficient, p<0.01
LV = left ventricular, LDL= low density lipoprotein, HDL = high density lipoprotein
LV mass
LV mass was directly related to systolic blood pressure, current smoking, exercise, body mass index, and diabetes after adjustment for the other variables in the model, and was weakly inversely related to LDL cholesterol (Table 3). After adjustment for the sociodemographic variables and height, the proportion of the remaining variability in LV mass explained by the cardiovascular risk factors was 26.1 percent.
While risk factor relationships with LV mass were generally similar across subgroups defined by age, gender, and race, the associations with elevated systolic blood pressure were more prominent in men than in women (+13.5g versus +6.9g per standard deviation of systolic blood pressure; interaction p<0.0005) and in participants under 65 than in those 65 or older (+12.9g versus +7.2g per standard deviation of systolic blood pressure; interaction p<0.0005), and the association with body mass index was stronger in men than in women (+15.0g versus +10.5g per standard deviation of body mass index; interaction p<0.0005).
LV end-diastolic volume
LV end-diastolic volume was directly related to systolic blood pressure, exercise, body mass index, and HDL cholesterol level, and inversely related to diastolic blood pressure, LDL cholesterol level, impaired fasting glucose, and diabetes, after adjustment for the other variables in the model. The proportion of the remaining variability in LV end-diastolic volume after adjustment for the sociodemographic variables and height that was explained by the cardiovascular risk factors was 12.2 percent. Relationships were similar across subgroups defined by age, gender, and race.
LV stroke volume
The associations of risk factors with LV stroke volume were similar to those for end-diastolic volume. Like end-diastolic volume, after adjustment for the other variables in the model, stroke volume was directly related to systolic blood pressure, exercise, body mass index, and HDL cholesterol, and inversely related to diastolic blood pressure, LDL cholesterol, impaired fasting glucose, and diabetes. In addition, stroke volume was inversely related to current smoking. After adjustment for the sociodemographic variables and height, the proportion of variability in LV stroke volume explained by the cardiovascular risk factors was 14.5 percent.
Associations were similar in subgroups defined by gender and race, but the inverse association with diastolic blood pressure was more prominent in participants 65 or older than in those under 65 years of age (−5.1ml versus −3.7ml per standard deviation of diastolic blood pressure; interaction p=0.001).
LV ejection fraction
Ejection fraction was directly related to systolic blood pressure and inversely related to diastolic blood pressure, current smoking, and diabetes, after adjustment for the other variables in the model. The coefficients for the square of systolic and the square of diastolic blood pressure were negative. These findings suggest that ejection fraction was directly related to systolic blood pressure except at the highest levels of systolic blood pressure, where an inverse relationship was seen, and that ejection fraction was inversely related to diastolic blood pressure throughout the range of values, especially at the highest levels of diastolic blood pressure. The results from these models were consistent with plots of mean ejection fraction by categories of systolic (Figure 1A) and diastolic blood pressure (Figure 1B), adjusted for all of the other variables in the multivariable model. Only 2.4% of the remaining variability in ejection fraction was explained by the cardiovascular risk factors considered, after adjustment for the sociodemographic variables and height (Table 3).
Figures 1A and 1B.
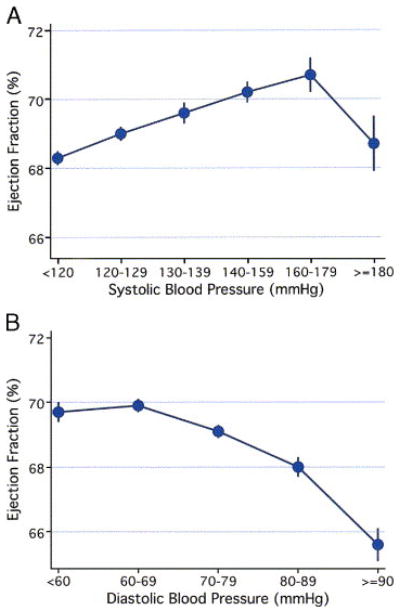
Adjusted mean ejection fraction (standard error) for various levels of systolic (Figure 1A) and diastolic blood pressure (Figure 1B).
Risk factor relationships with ejection fraction were similar in age, gender, and race subgroups. The relationships of ejection fraction with systolic and diastolic blood pressure levels were similar in users and nonusers of antihypertensive medications, but mean ejection fraction was higher at any given level of systolic or diastolic blood pressure in those with medically-treated hypertension than in those with untreated hypertension.
Cardiac output
Cardiac output was directly related to systolic blood pressure, body mass index, and HDL cholesterol, and inversely related to the square of systolic blood pressure, current smoking and LDL cholesterol after adjustment for the other variables in the model. For systolic blood pressure, these results suggest a positive relationship at most levels of systolic blood pressure, but lower mean cardiac output at the highest levels. After adjustment for the sociodemographic variables and height, the proportion of the remaining variability in cardiac output explained by the cardiovascular risk factors was 11.2 percent. Relationships were similar across gender and race subgroups; the positive linear association with systolic blood pressure was stronger in participants under 65 than in those 65 years or older (+0.29 L/min versus +0.21 L/min per standard deviation of systolic blood pressure, interaction p=0.001).
The inclusion of serum creatinine or educational status in the models did not materially change the coefficients for the risk factors listed in Table 3. In models where adjustment for height was replaced with adjustment for height squared or height to the 2.7 power, the coefficients associated with the cardiovascular risk factors were virtually identical to those presented in Table 3. In models where systolic and diastolic blood pressure were replaced with pulse pressure, pulse pressure was strongly and positively associated with all of the MRI measurements. For all MRI measurements, relationships with current body mass index were similar to relationships with body mass index at age 40 and slightly stronger than relationships with body mass index at age 20 years. The relationship of waist measurement with the MRI measurements was similar to that of BMI. The associations of LDL cholesterol levels with the MRI measurements studied were slightly but not significantly weaker in users than in non-users of lipid-lowering agents. Among diabetics, the duration of use of diabetes medication was positively related to LV mass, but not to the other measurements. Among ever smokers, pack-years of cigarette smoking was inversely related to end-diastolic volume and stroke volume, after adjustment for current smoking. Among participants with hypertension, the associations of cardiovascular risk factors with each of the MRI measurements were similar in those taking and not taking antihypertensive medications.
Discussion
In this cohort free of clinical cardiovascular disease, modifiable cardiovascular risk factors were associated with subclinical alterations in LV mass, volumes, and systolic function as determined by cardiac MRI. After adjustment for sociodemographic variables and height, higher systolic blood pressure and body mass index were associated as expected with higher LV mass and larger volumes. In the normotensive range and up through systolic blood pressures of 179, ejection fraction was directly related to systolic blood pressure, but at systolic blood pressures >=180 mmHg, an inverse relationship was observed. By contrast, the higher the diastolic blood pressure, the lower the ejection fraction, with a particularly low average ejection fraction at the highest levels of diastolic blood pressure. Current smoking and diabetes were associated with higher LV mass but lower stroke volume and ejection fraction, while high HDL cholesterol was associated with higher stroke volume and cardiac output. Some associations with cardiovascular risk factors were more prominent in men than in women and differed in older compared to younger participants, but associations of risk factors with MRI measurements did not differ significantly across racial/ethnic groups.
The accuracy and reproducibility of cardiac MRI permitted us to identify relationships of cardiovascular risk factors with subclinical alterations in LV size and systolic function that have been difficult to detect using previously available noninvasive methods. The reproducibility of the MRI measurements compared favorably with other large population studies that used echocardiography. For example, in the CARDIA Study, the technical error of measurement for reading LV mass ranged from 8–14% (1), while in MESA, as calculated from the same 155 duplicate readings described in the Methods section, it was 6.17% (95% confidence interval 5.29, 7.04). The large sample size in this study allowed the detection of very small differences in mass, volumes, and systolic function in relation to risk factors. These small differences may be of little clinical significance to the individual. However, if these differences persist and accumulate over time, they could lead to clinically important alterations in LV size or systolic function, and on a population level, such changes may assume public health importance. In addition, the accuracy of this method makes it suitable to follow the effects of treatments such as blood pressure lowering medications in individuals over time.
Strengths of this study include the representation of several ethnic groups and both genders, a wide age range, a broad range of levels of most cardiovascular risk factors, and recruitment from six geographically distinct areas of the US. Extensive information on cardiovascular risk factors was available, and the reliability of the MRI readings was excellent. Nonetheless, there was a limited range of levels of certain cardiovascular risk factors including alcohol intake and exercise, limiting our ability to assess their relationships with cardiac size and function. MRI exams were not done on 27% of participants, and those with an MRI exam had on average fewer cardiovascular risk factors than those without an exam. The MESA cohort includes only people without clinically manifest cardiovascular disease; the associations described here may differ from those in populations with clinically evident disease. Finally, since we had only a single cardiac MRI examination, we were not able to examine the longitudinal association of risk factors with change in LV geometry and systolic function.
The strong positive association of body mass index with LV mass and volumes was expected and may reflect both the larger ventricular size required for greater lean body mass and a component related to adiposity. We were not able to measure lean body mass and fat mass accurately with the measurements of body size available in this study, and thus were unable to determine the extent to which the higher LV mass, volumes, and cardiac output seen with higher body mass index are due to greater lean body mass versus excess adiposity. Indexation of each of the MRI measurements by height and weight in healthy non-obese individuals may allow better insight into the relationship of adiposity with LV geometry and function.
Our findings for risk factor associations with LV mass are in general agreement with the echocardiographic findings from the Coronary Artery Risk Development in Young Adults (CARDIA) Study(1), and the Cardiovascular Health Study(2). In one or both of these studies, LV mass was directly associated with weight, systolic blood pressure, current smoking and history of hypertension, and was inversely associated with diastolic blood pressure. Similar findings by echocardiography were reported from two European studies of men: a study of 475 men from the general population of Uppsala County, Sweden(15) and a French study of 843 healthy men 47–61 years of age(16). In the French study, body mass index at age 20 years was a stronger determinant of LV mass than current body mass index, while in the present study, current body mass index was more strongly associated with LV mass. In the Uppsala study, elevated LDL/HDL cholesterol ratio at baseline was associated with the development of LV hypertrophy 20 years later(15), while in MESA, high LDL was associated cross-sectionally with slightly lower LV mass. Unlike the present analysis, the Uppsala study did not consider the joint contributions of a variety of cardiovascular risk factors in a multivariable model; this difference in analytic methods may explain in part the apparently discrepant findings. A direct association of fasting insulin and triglyceride levels with LV hypertrophy was found in men only in an unadjusted analysis of data from normotensive participants in the Tecumseh study(17), but in a multivariable analysis including other cardiovascular risk factors, neither of these associations persisted. By contrast, in multivariable analyses in MESA, diabetes was associated with greater LV mass in both men and women, and in addition, diabetes and/or glucose intolerance were associated with reduced end-diastolic volume, stroke volume, and ejection fraction.
Associations of potentially modifiable risk factors with LV mass are important because LV mass is a strong predictor of sudden cardiac death(18), cardiovascular disease(19), and all-cause mortality in both middle-aged(20) and elderly individuals(21). A graded relationship with cardiovascular morbidity and all-cause mortality throughout the range of observed values for LV mass has been demonstrated in people with hypertension(22,23), and lower LV mass during antihypertensive treatment has been associated with lower risk of cardiovascular endpoints, independent of the extent of blood pressure lowering(24). Further, clinical trials suggest that in people with hypertension, long-term antihypertensive therapy may reduce LV mass as measured by echocardiography(25,26) and that weight loss results in reduction in LV mass(27). Whether treatment of other risk factors, such as smoking and diabetes, would result in reduction of LV mass is not clear, but may become amenable to study through the use of cardiac MRI.
In contrast to LV mass, there is considerably less information on the associations of cardiovascular risk factors with LV volumes or systolic function in populations without recognized cardiovascular disease. Despite the known acute effects of nicotine to increase heart rate and contractility, on average, stroke volume, ejection fraction, and cardiac output were slightly lower in the present study in current smokers than in non-smokers. The mechanisms underlying these observations, and the observed associations of high HDL and low LDL with higher volumes and cardiac output require further study.
In summary, in this cohort free of clinical cardiovascular disease, modifiable risk factors were associated with subclinical alterations in LV size and systolic function. The proportion of variability within all the cardiac MRI measurements explainable by traditional cardiac risk factors was small, however, and this was particularly true for ejection fraction. The high degree of reproducibility of cardiac MRI should allow the detection of subtle deterioration or improvement in LV size and function. Additional study is needed of risk factors and their treatment in relation to the new development or progression of LV dysfunction, and of the relationship of subclinical alterations of cardiac size and function with outcomes such as myocardial infarction and sudden cardiac death. Longitudinal study of the MESA cohort and other cohorts may provide important information in this regard.
Acknowledgments
The authors thank the other investigators, the staff, and the participants of the MESA study for their valuable contributions. A full list of participating MESA investigators and institutions can be found at http://www.mesa-nhlbi.org.
Footnotes
Conflict of Interest Disclosures and Financial Disclosures: None.
Supported by contracts N01-HC-95159 through N01-HC-95166 and N01-HC-95168 from the National Heart, Lung, and Blood Institute, Bethesda, MD.
References
- 1.Gardin JM, Wagenknecht LE, Anton-Culver H, et al. Relationship of cardiovascular risk factors to echocardiographic left ventricular mass in healthy young black and white adult men and women. The CARDIA study. Coronary Artery Risk Development in Young Adults. Circulation. 1995;92:380–7. doi: 10.1161/01.cir.92.3.380. [DOI] [PubMed] [Google Scholar]
- 2.Gardin JM, Arnold A, Gottdiener JS, et al. Left ventricular mass in the elderly. The Cardiovascular Health Study. Hypertension. 1997;29:1095–103. doi: 10.1161/01.hyp.29.5.1095. [DOI] [PubMed] [Google Scholar]
- 3.Savage DD, Levy D, Dannenberg AL, Garrison RJ, Castelli WP. Association of echocardiographic left ventricular mass with body size, blood pressure and physical activity (the Framingham Study) Am J Cardiol. 1990;65:371–6. doi: 10.1016/0002-9149(90)90304-j. [DOI] [PubMed] [Google Scholar]
- 4.Pohost GM, Hung L, Doyle M. Clinical use of cardiovascular magnetic resonance. Circulation. 2003;108:647–53. doi: 10.1161/01.CIR.0000083233.86078.3E. [DOI] [PubMed] [Google Scholar]
- 5.Bild DE, Bluemke DA, Burke GL, et al. Multi-ethnic study of atherosclerosis: objectives and design. Am J Epidemiol. 2002;156:871–81. doi: 10.1093/aje/kwf113. [DOI] [PubMed] [Google Scholar]
- 6.Bild DE, Detrano R, Peterson D, et al. Ethnic differences in coronary calcification: the Multi-Ethnic Study of Atherosclerosis (MESA) Circulation. 2005;111:1313–20. doi: 10.1161/01.CIR.0000157730.94423.4B. [DOI] [PubMed] [Google Scholar]
- 7.Chang JJ, Rabinowitz D, Shea S. Sources of variability in blood pressure measurement using the Dinamap PRO 100 automated oscillometric device. Am J Epidemiol. 2003;158:1218–26. doi: 10.1093/aje/kwg274. [DOI] [PubMed] [Google Scholar]
- 8.Friedewald WT, Levy RI, Fredrickson DS. Estimation of the concentration of low-density lipoprotein cholesterol in plasma, without use of the preparative ultracentrifuge. Clin Chem. 1972;18:499–502. [PubMed] [Google Scholar]
- 9.Natori S, Lai S, Finn PJ, et al. Cardiac MR imaging in MESA: Protocol and normal values by age, gender and ethnicity. Am J Roentgenology. (in press) [Google Scholar]
- 10.Ainsworth BE, Haskell WL, Whitt MC, et al. Compendium of physical activities: an update of activity codes and MET intensities. Med Sci Sports Exerc. 2000;32:S498–504. doi: 10.1097/00005768-200009001-00009. [DOI] [PubMed] [Google Scholar]
- 11.Genuth S, Alberti KG, Bennett P, et al. Follow-up report on the diagnosis of diabetes mellitus. Diabetes Care. 2003;26:3160–7. doi: 10.2337/diacare.26.11.3160. [DOI] [PubMed] [Google Scholar]
- 12.Lauer MS, Anderson KM, Larson MG, Levy D. A new method for indexing left ventricular mass for differences in body size. Am J Cardiol. 1994;74:487–91. doi: 10.1016/0002-9149(94)90909-1. [DOI] [PubMed] [Google Scholar]
- 13.de Simone G, Daniels SR, Devereux RB, et al. Left ventricular mass and body size in normotensive children and adults: assessment of allometric relations and impact of overweight. J Am Coll Cardiol. 1992;20:1251–60. doi: 10.1016/0735-1097(92)90385-z. [DOI] [PubMed] [Google Scholar]
- 14.1997 Joint National Committee. The sixth report of the Joint National Committee on Prevention, Detection, Evaluation and Treatment of High Blood Pressure. Arch Intern Med. 1997;157:2413–2446. doi: 10.1001/archinte.157.21.2413. [DOI] [PubMed] [Google Scholar]
- 15.Sundstrom J, Lind L, Vessby B, Andren B, Aro A, Lithell H. Dyslipidemia and an unfavorable fatty acid profile predict left ventricular hypertrophy 20 years later. Circulation. 2001;103:836–41. doi: 10.1161/01.cir.103.6.836. [DOI] [PubMed] [Google Scholar]
- 16.Thomas F, Benetos A, Ducimetiere P, Bean K, Guize L. Determinants of left ventricular mass in a French male population. Blood Press. 1999;8:79–84. doi: 10.1080/080370599438248. [DOI] [PubMed] [Google Scholar]
- 17.Marcus R, Krause L, Weder AB, Dominguez-Meja A, Schork NJ, Julius S. Sex-specific determinants of increased left ventricular mass in the Tecumseh Blood Pressure Study. Circulation. 1994;90:928–36. doi: 10.1161/01.cir.90.2.928. [DOI] [PubMed] [Google Scholar]
- 18.Haider AW, Larson MG, Benjamin EJ, Levy D. Increased left ventricular mass and hypertrophy are associated with increased risk for sudden death. J Am Coll Cardiol. 1998;32:1454–9. doi: 10.1016/s0735-1097(98)00407-0. [DOI] [PubMed] [Google Scholar]
- 19.Casale PN, Devereux RB, Milner M, et al. Value of echocardiographic measurement of left ventricular mass in predicting cardiovascular morbid events in hypertensive men. Ann Intern Med. 1986;105:173–8. doi: 10.7326/0003-4819-105-2-173. [DOI] [PubMed] [Google Scholar]
- 20.Levy D, Garrison RJ, Savage DD, Kannel WB, Castelli WP. Prognostic implications of echocardiographically determined left ventricular mass in the Framingham Heart Study. N Engl J Med. 1990;322:1561–6. doi: 10.1056/NEJM199005313222203. [DOI] [PubMed] [Google Scholar]
- 21.Gardin JM, McClelland R, Kitzman D, et al. M-mode echocardiographic predictors of six- to seven-year incidence of coronary heart disease, stroke, congestive heart failure, and mortality in an elderly cohort (the Cardiovascular Health Study) Am J Cardiol. 2001;87:1051–7. doi: 10.1016/s0002-9149(01)01460-6. [DOI] [PubMed] [Google Scholar]
- 22.Verdecchia P, Carini G, Circo A, et al. Left ventricular mass and cardiovascular morbidity in essential hypertension: the MAVI study. J Am Coll Cardiol. 2001;38:1829–35. doi: 10.1016/s0735-1097(01)01663-1. [DOI] [PubMed] [Google Scholar]
- 23.Schillaci G, Verdecchia P, Porcellati C, Cuccurullo O, Cosco C, Perticone F. Continuous relation between left ventricular mass and cardiovascular risk in essential hypertension. Hypertension. 2000;35:580–6. doi: 10.1161/01.hyp.35.2.580. [DOI] [PubMed] [Google Scholar]
- 24.Devereux RB, Wachtell K, Gerdts E, et al. Prognostic significance of left ventricular mass change during treatment of hypertension. JAMA. 2004;292:2350–6. doi: 10.1001/jama.292.19.2350. [DOI] [PubMed] [Google Scholar]
- 25.Gottdiener JS, Reda DJ, Massie BM, Materson BJ, Williams DW, Anderson RJ. Effect of single-drug therapy on reduction of left ventricular mass in mild to moderate hypertension: comparison of six antihypertensive agents. The Department of Veterans Affairs Cooperative Study Group on Antihypertensive Agents. Circulation. 1997;95:2007–14. doi: 10.1161/01.cir.95.8.2007. [DOI] [PubMed] [Google Scholar]
- 26.Devereux RB, Palmieri V, Sharpe N, et al. Effects of once-daily angiotensin-converting enzyme inhibition and calcium channel blockade-based antihypertensive treatment regimens on left ventricular hypertrophy and diastolic filling in hypertension: the Prospective Randomized Enalapril Study Evaluating Regression of Ventricular Enlargement (PRESERVE) trial. Circulation. 2001;104:1248–54. doi: 10.1161/hc3601.095927. [DOI] [PubMed] [Google Scholar]
- 27.MacMahon SW, Wilcken DE, Macdonald GJ. The effect of weight reduction on left ventricular mass. A randomized controlled trial in young, overweight hypertensive patients. N Engl J Med. 1986;314:334–9. doi: 10.1056/NEJM198602063140602. [DOI] [PubMed] [Google Scholar]