

Abstract
Pure and composite hydrogel matrices of collagen type I and fibrin were produced by simultaneous polymerization of each biopolymer in the presence of vascular smooth muscle cells. The ratio of collagen to fibrin in composite matrices was varied from 1:1 to 1:4, with corresponding absolute protein concentrations of 1.0–5.0 mg/mL. Constructs cultured for 7 days were subjected to uniaxial tensile testing, analysis of cell content, as well as scanning electron and confocal microscopic imaging. Gel compaction over time in culture decreased with increasing protein content but was augmented by the presence of fibrin. Material properties (modulus, ultimate tensile stress, and toughness) were highly correlated with gel compaction, protein density, and cell concentration. Maximum force at failure was dependent on absolute protein concentration. This study examined the interrelationships between protein type, ratio, and density in composite biopolymer matrices and contributes to the understanding of structure–function relationships in such materials.
Introduction
An interpenetrating polymer network (IPN) is a combination of polymers in network form, where at least one polymer is synthesized and/or cross-linked in the presence of the other, either simultaneously or sequentially.1 The chains of the individual polymers are completely entangled, and there may or may not be chemical bonds between the combined networks. This structure results in characteristics from each individual polymer being evident in the overall IPN behavior. For example, interactions between the constituent polymers, such as phase continuities and molecular mixing at the phase boundaries, contribute to the mechanical behavior of the material. IPNs have previously been synthesized for biomedical applications using combinations of synthetic,2 natural,3 or biodegradable polymers.4–6 In addition, IPNs have been created from proteins and polysaccharides, manufactured to take advantage of various properties including biocompatibility and degradability.7–9
Naturally derived protein scaffolds are of interest in the field of tissue engineering because of their biological and physiological relevance. In particular, collagen type I and fibrin have been used individually as protein scaffolds in biomaterial applications because of their demonstrated ability to interact with embedded cells. The ability of cells to recognize and bind to these scaffolds is important in promoting appropriate cell function and tissue remodeling. Collagen is attractive as a biomaterial because of its function as a structural matrix in many tissue types, and this protein has been used in a broad range of cell delivery and tissue engineering applications.10,11 Fibrin, a blood clotting protein, has been used as a surgical adhesive12 and as a scaffold material for cardiovascular tissue engineering.13–15 Our laboratory is interested in the use of these naturally derived proteins as scaffolds for cardiovascular tissue engineering. However, the mechanical properties demonstrated by these reconstituted polymers in vitro are generally inadequate to withstand the physiological forces present in the cardiovascular system.
In creating collagen–fibrin IPNs seeded with cells, our goal is to produce protein polymer composite materials that yield functional and mechanical properties that are improved over the individual components alone. We previously have shown that collagen and fibrin can be polymerized simultaneously in the presence of living vascular smooth muscle cells to produce mixed composite materials.16 Such mixed composites can be used to tailor the material properties of the construct, and selected protein combinations show improved tensile strength over collagen or fibrin alone. In the present study, we characterized the behavior of collagen–fibrin composite matrices as interpenetrating polymer networks and examined their behavior as a function of protein composition. Specifically, we varied the protein ratios of collagen to fibrin and observed the changes in mechanical properties and scaffold microarchitecture. Further, we characterized cell–matrix interactions associated with these composite scaffolds by measuring gel compaction, cell number, and cell morphology. These studies allowed us to examine the relationships between the protein and cell content of constructs, as well as their effects on construct architecture and function. We believe that such protein IPNs have important potential as scaffolds in tissue engineering because they incorporate biologically relevant proteins in structures that can be tailored to specific applications.
Methods and Materials
Materials
Bovine collagen, bovine fibrinogen, bovine thrombin, and ε-amino-caproic acid (ACA) were purchased from Sigma (St Louis, MO). DMEM-F12, trypsin, penicillin, streptomycin, L-glutamine, and fetal bovine serum (FBS) were purchased from Mediatech (Herndon, VA). Alexafluor 488-phallodin, ethidium homodimer, and Hoechst 33258 dye were purchased from Molecular Probes (Eugene, OR). Proteinase K was obtained from Promega (Madison, WI).
Cell Isolation and Culture
Rat aortic smooth muscle cells (RASMC) were isolated from healthy Sprague–Dawley rats using collagenase digestion. Cells were cultured in DMEM-F12 supplemented with FBS (10% v/v) and penicillin/streptomycin/L-glutamine (1% v/v), otherwise referred to as complete medium. Cells were cultured until confluence in a 37 °C incubator at 5% CO2, then collected using 0.05% trypsin. Passages 4–10 were used in experiments.
Construct Preparation
Collagen/fibrin mixed constructs were prepared in the following ratios of collagen to fibrin (expressed as mg: mg): 0.5:0.5, 1:0.5, 1:1, 1:2, and 1:4. The corresponding total protein concentrations were 1, 1.5, 2, 3, and 5 mg/mL, respectively. Pure collagen and pure fibrin constructs were constructed with 2 mg/mL of total protein and were denoted as 2:0 and 0:2, respectively.
Collagen protein solution was prepared by dissolving lyophilized bovine collagen in cold 0.02 N acetic acid, to create a 2.0 or 4.0 mg/ mL solution. Fibrinogen solution (2.0, 4.0, 8.0, or 16.0 mg/mL) was prepared by dissolving lyophilized bovine fibrinogen in cold media, supplemented with ACA, used to prevent degradation of the fibrin constructs by the enzyme plasmin. Dissolution of both solutions occurred between 2 and 8 °C. Cells were harvested and suspended at a concentration of 1 × 10⁶ cells/mL in the appropriate amounts of FBS (10% v/v) and 5× DMEM (10% v/v). A mixture of bovine thrombin solution in DMEM was added (25% v/v) so that the final thrombin concentration would be 0.01 units of thrombin per mg fibrinogen (UT/ mg F). NaOH (0.1 M, 5% v/v) was added to initiate a change to physiological pH (approximately 7.4). This was quickly followed by the addition of the bovine fibrinogen (25% v/v) and the bovine collagen solutions (25% v/v).
Pure collagen (expressed as 2:0) and pure fibrin (expressed as 0:2) constructs were prepared in a similar fashion, both at final protein concentrations of 2 mg/mL. Cold collagen solution (50% v/v) was combined with the RASMC (1 × 10⁶ cells/mL), 5× DMEM (20% v/v), FBS (10% v/v), 0.1 N NaOH (10% v/v), and complete media (10% v/v) to create the collagen gels. Fibrin gels were created by mixing fibrinogen solution (50% v/v) with RASMC (1 × 10⁶ cells/mL), FBS (10% v/v), and thrombin solution (40% v/v).
The cell–protein solution was thoroughly mixed and divided into test tubes, which served as the outer sheath of the mold system. An annular mold was inserted, consisting of an inner tubular glass rod surrounded by rubber stoppers at a set distance, allowing a final construct volume of 3.7 mL. Constructs were allowed to gel for 2–3 h at 37 °C. The inner mandrel with the attached constructs was then removed and statically cultured in ACA media. On day 1, constructs were freed from the ends of the rubber stoppers to allow compaction in the axial direction. The culture period continued for 7 days.
Gel Compaction
Constructs were imaged with a digital camera (Nikon, Tokyo, Japan) and dimensions were determined with ImageTool software to obtain gel volume at days 1, 3, and 7. Volume was calculated as that of a hollow cylinder from the dimensional measurements. Two measurements along the length and five diameter measurements were averaged to determine the volume. Gel compaction was determined as a percentage of the original volume on day 0.
Mechanical Testing and Analysis
Uniaxial mechanical testing was performed on day 7. The tubular constructs were segmented into rings, then imaged to determine dimensions. Mechanical testing was performed on a mechanical testing system (EnduraTec Inc., Minnetonka MN) equipped with a ring test apparatus and 250 g load cell. Rings were kept hydrated in PBS until testing was performed. After placement on the testing apparatus, ring segments were preconditioned with 20% strain and then subsequently strained to failure at 0.3 mm/s. A stress–strain curve was produced, using the force-displacement data and the equations for engineering stress and strain. The initial cross sectional area was used in these calculations, based on the wall thickness and width of the ring segment. Material modulus, ultimate tensile stress (UTS), and toughness were determined from the stress–strain curve. Material modulus was calculated as the slope of the linear region of the stress–strain curve. The UTS was maximum stress obtained prior to construct failure. The toughness data was approximated by summing rectangles of equal width, to find the area under the stress–strain plot. Maximum force attained prior to failure was also determined as a sample property.
Cell Number Quantitation
Cell number was assessed at day 7. Constructs were rinsed in PBS and then stored at −70 °C until analysis could be completed. Hoechst 33258 dye was used to determine sample DNA content. Constructs were dehydrated and then digested in Proteinase K at 55 °C for 16–20 h. Next, samples were diluted and loaded into a 96-well plate, which also contained standards and a series of blanks. DNA-binding dye was added to each well, and the plate was protected from light for 20 min. Fluorescence was quantified using a microplate reader (Bio-Tek Inc., Winooski VT) at an excitation wavelength of 360 nm and an emission wavelength of 460 nm. The DNA content of each construct was converted to a cell number based on cell and DNA standards.
Confocal and Scanning Electron Microscopy
Visualization of cell morphology was accomplished by staining of the actin cytoskeleton in conjunction with confocal imaging. Constructs were rinsed in PBS for 30 min and then fixed in a 3.7% formaldehyde solution for 10 min. Following a rinse in PBS, the construct was permeabilized with a 0.1% Triton solution for 5 min. Staining was then accomplished via incubation with Alexafluor 488-conjugated phalloidin in 1% BSA solution, to block nonspecific binding, for 20 min. Samples were rinsed again with PBS, then incubated with ethidium homodimer, used for the visualization of the cell nuclei. Constructs were imaged using confocal laser scanning microscope (Zeiss Inc., Thornwood NY), using argon (488 nm) and helium/neon (543 nm) lasers.
Visualization of scaffold microarchitecture was completed using scanning electron microscopy (SEM, Zeiss Inc., Thornwood NY). Samples were rinsed in PBS for 30 min and then fixed in a 4% glutaraldehyde solution for 1 h. Following a rinse in PBS, samples were sequentially dehydrated in ethanol solutions ranging from 30 to 100% for 45 min each. Samples were then critically point dried and sputter coated with gold before imaging
Statistical Analysis
Data were collected from a set of four independent experiments, each using a separate cell batch. At least three constructs for each type were used for mechanical testing, and 3–4 ring samples were obtained from each construct. Comparison of data was performed using ANOVA with Tukey’s post-hoc analysis, with p < 0.05 considered significant. Symbols were used to represent significant differences between pure (collagen = *, fibrin = #) and composite scaffolds. Error bars on all graphs represent the standard error of the mean.
Results
Gel Compaction
All constructs prepared had the same initial cell concentration, but the ratio and absolute amount of protein varied as described above. All constructs showed robust gel compaction during the first few days in culture and the volume of the constructs continued to decrease progressively over 7 days in culture. The degree of compaction at day 1, 3, and 7 is shown in Figure 1, expressed as a percentage of the original volume (i.e., a smaller percentage is indicative of a smaller final volume). Pure collagen constructs exhibited the least reduction in volume, compacting to about 15% of their original volume by the end of the culture period. Pure fibrin constructs compacted very strongly to about 3% of their original volume, and all fibrin-containing constructs exhibited similarly increased compaction. Construct compaction did not correlate directly with initial protein concentration, however, there was a trend for compaction to be decreased in mixed constructs as total protein content increased.
Figure 1.
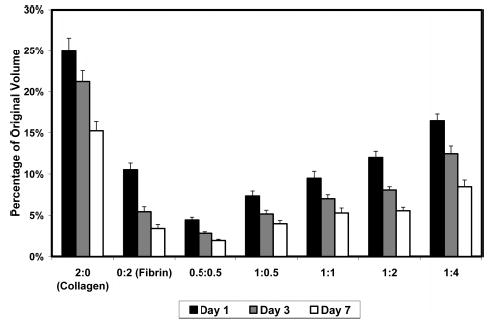
Gel compaction as a percentage of original volume. All constructs compacted rapidly in the first day of culture, and progressively over the 7 days in culture. Fibrin and fibrin containing constructs compacted more than pure collagen scaffolds.
Although each construct began with the same initial volume, the initial protein concentration varied, producing different protein densities across the time in culture. For this reason, we estimated protein densities at various time points. The compaction data and initial protein concentrations were used to calculate total protein densities, as shown in Figure 2, assuming that the amount of protein secreted or degraded by the cellular component was negligible. For all construct types, protein density increased over time as gel volume decreased. At day 7, protein density ranged from ~14 mg/cm3 for the pure collagen constructs to ~70 mg/cm3 for the 1:4 mixed constructs. Final gel volume showed a modest negative correlation with final protein density (R = −0.67), however there was only a weak correlation between initial and final protein density (R = 0.42). Constructs with the same initial protein density (e.g., collagen, fibrin and 1:1 mixtures, all with 2.0 mg/mL initial protein concentration) remodeled over 7 days but ended with different final protein densities, showing the influence of protein type on gel compaction.
Figure 2.
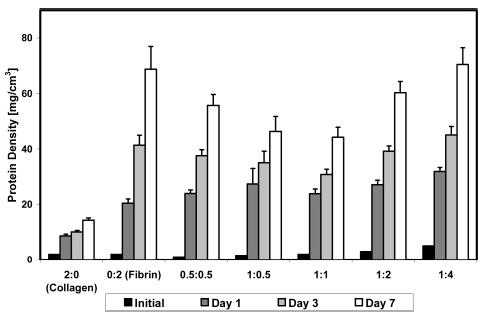
Protein densities at various time points. Pure fibrin and fibrin containing scaffolds demonstrated higher protein densities, relative to pure collagen.
Analysis of the DNA content in constructs was used to determine the cell number in each of the various construct types at day 7. The initial number of cells in each construct was 3.7 × 10⁶, at a concentration of 1.0 × 10⁶ cells/mL. Figure 3A shows that cell numbers decreased over 7 days in culture in all matrix types. Cell number in pure collagen constructs dropped to about 3.2 × 10⁶ cells/construct by day 7 but was more markedly decreased (2.1 × 10⁶ cells/construct) in pure fibrin constructs. Composite constructs were similar in cell content to pure collagen, with cell numbers ranging from 2.9 to 3.4 × 10 6 cells/construct.
Figure 3.
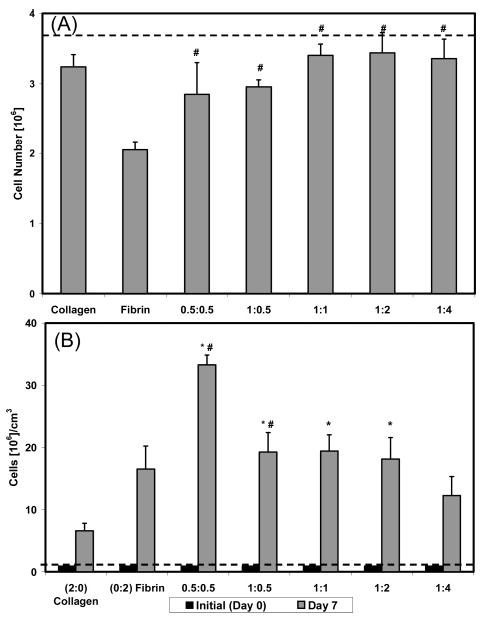
Dotted lines indicate initial cell number or cell concentration. An asterisk (*) is used to indicate a statistical difference with collagen, whereas a pound sign (#) is used for fibrin. (A) Number of cells in each construct type at day 7. Collagen containing constructs showed increased amounts of cells than the pure fibrin scaffold. (B) Cell concentration at day 7. Cell concentration was highest in the 0.5:0.5 construct due to the number of cells and degree of compaction.
Figure 3B shows cell concentration data at day 1 and day 7, which was compiled by combining the absolute cell numbers with the gel compaction data. By day 7 there were clear differences in cell concentration between construct types. Pure collagen matrices had the lowest cell concentration (6.6 × 10⁶ cells/cm3) at day 7, whereas pure fibrin constructs had a higher cell concentration (16.5 × 10⁶ cells/cm3) despite the lower absolute cell number in these constructs. Collagen–fibrin mixtures had significantly higher cell concentrations than either pure polymer alone. The 0.5:0.5 constructs showed a marked peak in cell concentration at 33.3 × 10⁶ cells/cm3, whereas the other mixed matrices had cell concentrations between 12 × 106 and 20 × 106 cells/cm3. In general, the final cell concentration correlated more closely with the final gel volume (R = −0.83) than with absolute cell number (R = −0.21).
Mechanical Testing
Results of tensile testing of constructs at day 7 are shown in Figure 4. Values of the material modulus (Figure 4A) were significantly increased in all composite constructs, when compared to pure collagen (11.2 kPa) and pure fibrin (21.9 kPa). This property showed a modest negative correlation (R = −0.76) with construct volume at day 7. However, the values for material modulus declined as the protein concentration increased in the composite matrices. The modulus peaked in the 0.5:0.5 construct at a value of 52.2 kPa. The remaining values trended downward to 33.0 kPa for the 1:4 mixed constructs.
Figure 4.
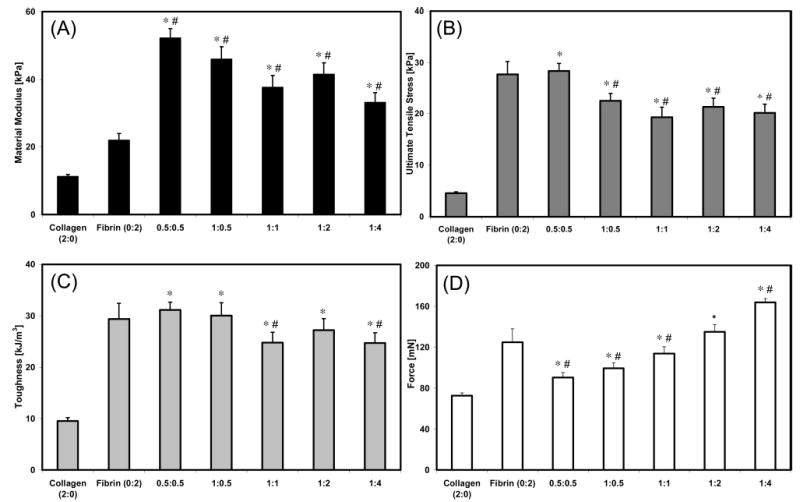
Material and sample properties of pure and composite constructs at day 7. An asterisk (*) is used to indicate a statistical difference with collagen, whereas a pound sign (#) is used for fibrin. (A) Material modulus. (B) UTS. (C) Toughness. (D) Maximum force.
The UTS (Figure 4B) of all IPN composite constructs significantly exceeded that of pure collagen (4.6 kPa). However the UTS value for the pure fibrin construct (27.7 kPa) was approximately equal to the strongest composite matrix: the 0.5: 0.5 mixture (28.4 kPa). Composite matrices with higher total protein contents but differing collagen:fibrin ratios exhibited similar UTS values, all around 20 kPa. The strength of these constructs was significantly decreased compared to the pure fibrin and the 0.5:0.5 construct. UTS at day 7 was highly correlated with the final construct volume (R = −0.96), protein density (R = 0.82), and cell concentration (R = 0.81). The construct toughness data (Figure 4C) mirrored the UTS results.
Tensile testing results were also expressed in terms of the maximum force before failure (Figure 4D), which is a representation of the overall strength of the sample. Maximum force before failure was lowest in the pure collagen constructs (73 mN). Pure fibrin constructs (124 mN) were stronger than IPN constructs with lower initial protein concentrations but weaker than constructs with higher initial protein concentrations. The composite constructs demonstrated an increasing trend with increasing protein concentration and the maximum load was greatest in the highest protein construct (1:4, 164 mN). There was a positive correlation between the values for the maximum force before failure and the initial (R = 0.84) and final protein density (R = 0.81), but a weak relationship between max force and final construct volume (R = −0.22).
Microscopy
Images of smooth muscle cells inside the various 3D matrix types obtained using confocal microscopy are shown in Figure 5. The actin cytoskeleton was visualized in these images. It can be seen that cells in pure collagen and pure fibrin matrices exhibited an elongated morphology with few extended projections. In contrast, cells in composite matrices had more stellate morphologies, with many extended processes. The extent of cell spreading increased with increasing amounts of fibrin in the composite constructs. Cells in constructs also exhibited alignment in the longitudinal direction, along the long axis of the tubular construct.
Figure 5.
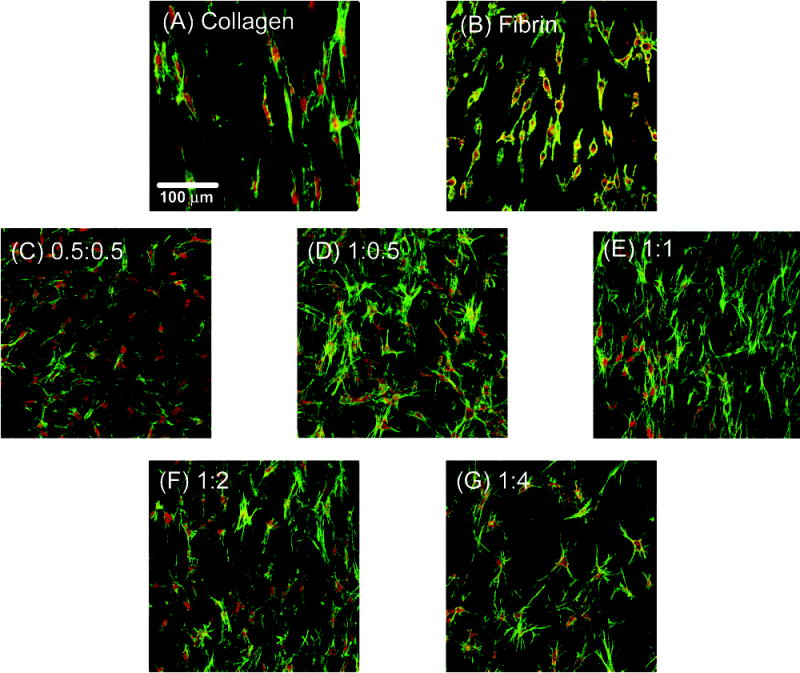
Confocal laser scanning micrographs of RASMC in various matrices. Actin cytoskeleton (green) and cell nuclei (red) stained. (A) Collagen. (B) Fibrin. (C) 0.5:0.5. (D) 1:0.5. (E) 1:1. (F) 1:2. (G) 1:4.
Scanning electron microscopy revealed distinct matrix architectures with complex topographies at the submicrometer scale for each matrix type, as shown in Figure 6. Pure collagen matrices (panel A) consisted of entangled fibrils approximately 30–50 nm in diameter, which exhibited the typical collagen D-periodic banding pattern (inset). Bundling of collagen fibrils also was evident. Pure fibrin matrices (panel B) consisted of fibril bundles ranging from approximately 30–60 nm in diameter, also in a tangled arrangement. However, fibrin matrix structure appeared more densely packed than collagen. Collagen-fibrin mixed matrices exhibited fibers of each matrix type, and the biopolymers maintained distinct domains in each composite. Increasing amounts of fibrin were evident as the ratio of collagen to fibrin decreased (panels C–G). The 0.5:0.5 and 1:1 matrices, which have equal ratios of collagen and fibrin, did not display similar architectures. In the 0.5:0.5 matrix, collagen fibrils were encased in a dense mesh of fibrin, whereas collagen appeared more dominant in the 1:1 matrix. A weblike fibrin structure was evident in the 1:0.5 constructs, whereas the 1:2 matrix showed an entanglement of collagen fibrils with connecting fibrin fibers, and the 1:4 constructs showed increasing amounts of fibrin encasing the collagen fibrils. At the scales examined, none of the matrices examined showed evidence of preferential fiber alignment.
Figure 6.
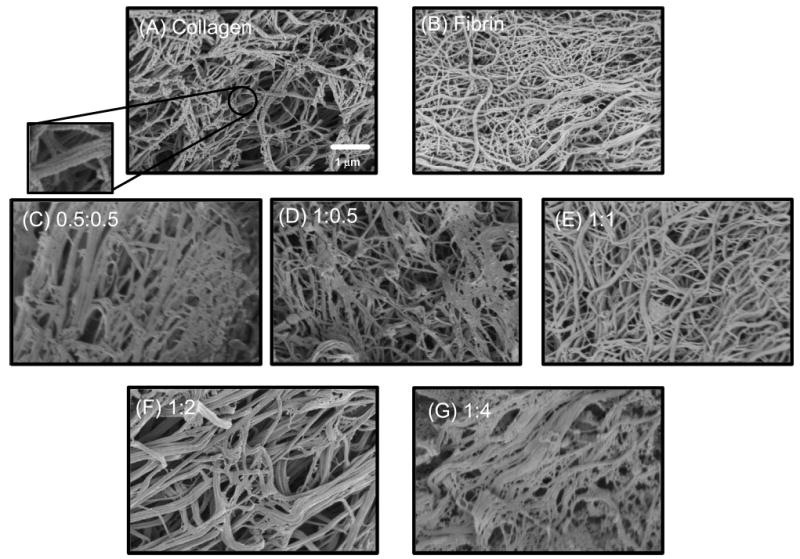
Scanning electron micrographs of pure and composite matrices. (A) Collagen. (B) Fibrin. (C) 0.5:0.5. (D) 1:0.5. (E) 1:1. (F) 1:2. (G) 1:4.
Discussion
This study examined the interrelationships between protein content, cell number and gel compaction, as well as their effects on the mechanical and morphological characteristics of collagen-fibrin IPN matrices. Collagen and fibrin are both structural proteins, though their physiological function is quite different. Collagen is a main component of many tissues, including blood vessels, and it plays a major role in providing permanent structural integrity and resisting forces in these tissues. Fibrin is a main structural component of blood clots, but a key aspect of fibrin’s function is its stimulation of tissue remodeling and the wound healing process as it degrades. It has been shown previously that the interaction between collagen and fibrin in the formation of composite matrices leads to material properties that are enhanced over pure collagen or fibrin matrices.16 The present study sought to examine more closely the relationships between these two proteins when combined in composite matrices, and how each contributed to the overall IPN and construct behavior.
Characteristics of the cellular environment (e.g., matrix composition, soluble factors, and mechanical forces) play important roles in modulating cell behavior. Compaction of collagen gels is a cell-mediated process; however, the mechanisms behind this phenomenon are unclear. It has been suggested that gel compaction is related to cell contraction in the scaffold.17 Others have postulated that gel compaction is related to cell locomotion through the scaffold,18 in particular the cell–scaffold and cell–cell contacts and forces generated as a result of this migration.19 There is also evidence that compaction may be a combination of these two mechanisms, as well as mechanical characteristics of the model system, that contributes to gel remodeling.20 Our results show that initial characteristics of the scaffold environment (i.e., protein density and type) affect the degree of compaction of the gel, which regulates final protein density and cell concentration.
The initial protein density in the construct formulations examined varied from 1.0 to 5.0 mg/mL. In general, constructs with lower initial protein densities demonstrated increased gel compaction, which resulted in higher material properties. The decreased compaction observed in higher density matrices may have been due to inhibition of cell migration and movement due to a tighter protein network, as supported by our SEM imaging studies. Constructs with the same initial protein concentration (pure collagen, pure fibrin, and 1:1 matrices, all with 2.0 mg/mL protein) showed different degrees of gel compaction and resulting mechanical properties. This result underscores the importance of the type of protein in determining how constructs remodel. Pure fibrin gels compacted to a greater degree than pure collagen gels, and compaction in each of the composite constructs was greater than the compaction of the pure collagen scaffold, suggesting that the presence of fibrin contributed to increased compaction.
The 0.5:0.5 and 1:1 matrix formulations had equal ratios of collagen and fibrin content and, therefore, had the same protein composition, but the overall initial protein density was different. The result was decreased gel compaction in the higher density constructs, which resulted in decreased material properties. In fact, the increased degree of compaction in the constructs with a lower initial protein density (0.5:0.5) resulted in these constructs having a higher final protein density. These results illustrate the importance of cell-mediated gel compaction in determining the material properties of cell-seeded protein matrices, and suggest that control over the degree to which cells remodel the gel can be used to tailor material properties.
Although material properties (i.e., properties normalized by the cross sectional area of the sample being tested) were highly correlated with gel compaction, the maximum force at failure (a sample property not normalized by cross-sectional area) was affected mainly by the absolute amount of protein in constructs. The 1:4 composite constructs had the highest initial and final protein density, as well as the highest absolute amount of protein, and also was able to withstand the most absolute force. The pure fibrin constructs, which because of robust gel compaction had a comparable final protein density to the 1:4 matrices by day 7, were able to sustain a similarly high load. Although the 0.5:0.5 constructs had higher material properties and a higher final protein density than the 1:1 constructs, the latter matrices exhibited a higher force to failure, presumably because of the higher absolute amount of protein in these constructs. Therefore, both increased gel compaction and increased total protein amount was shown to contribute to producing more mechanically robust matrices.
Cell concentration in three-dimensional constructs is determined by two parameters, the number of cells and the gel volume, both of which can change depending on the construct formulation. The number of cells in pure collagen was higher relative to pure fibrin, and cell numbers in all IPN matrices appeared to benefit from the presence of collagen. Because of the effect of gel compaction, however, collagen constructs had the lowest cell concentration at day 7, whereas fibrin-containing constructs had higher cell concentrations due to increased gel compaction. In particular, the 0.5:0.5 matrices exhibited both robust gel compaction and cell numbers similar to pure collagen matrices, resulting in constructs with the highest cell concentrations and high mechanical properties, relative to the other formulations investigated.
The phenotypic behavior of vascular smooth muscle cells in three dimensional matrices is an important component of scaffold function. Smooth muscle cells in culture have been known to dedifferentiate into myofibroblasts, especially in the presence of serum.21 Myofibroblasts are characterized by a spindle shaped morphology and increased proliferation when cultured on collagen I gels.22 Although evidence for a bipolar morphology was exhibited by the cells in our pure collagen and fibrin composites, proliferation was downregulated in these 3D matrices. We did not extensively characterize smooth muscle cell phenotype in the present study, but others have shown that matrix composition and geometry can affect cell function and phenotype.23,24
Microstructural properties of collagen scaffolds have been shown to be interconnected with mechanical properties.25 In our study, the interpenetrating but separate nature of the collagen and fibrin proteins was evident from the SEM images. The material modulus of all composite constructs exceeded that of pure collagen and fibrin constructs, exhibiting a synergistic effect due to the interaction of the collagen and fibrin proteins. At the same time, pure fibrin constructs had the highest ultimate tensile strength in these studies. In our earlier work,16 we used a higher concentration of thrombin when preparing gels, such that the fibers were shorter and finer. A decreased thrombin concentration, as used in the present study, created a fibrin microstructure more similar to collagen, with larger fibril diameters and increased fiber bundling.26 This change in microstructure led to increased mechanical properties, and the composite materials in this study benefited from the presence of the more robust fibrin matrix.
In summary, our results suggest that the tensile mechanical properties of interpenetrating biopolymer networks made from naturally derived proteins can be improved by varying the quantity and ratio of the component proteins. A better understanding of how protein fibers interact with each other and with the cellular component in such composite matrices will lead to clearer structure–function relationships that can be used to design scaffolds for tissue engineering applications.
Acknowledgments
This work was funded by NIH Grant Number 1R21-EB003978 from the National Institute of Biomedical Imaging and Bioengineering (NIBIB).
References
- 1.Sperling LH. Interpenetrating polymer networks and related materials. Plenum Press; New York: 1981. [Google Scholar]
- 2.Liu L, Won YJ, Cooke PH, Coffin DR, Fishman ML, Hicks KB, Ma PX. Biomaterials. 2004;25:3201–3210. doi: 10.1016/j.biomaterials.2003.10.036. [DOI] [PubMed] [Google Scholar]
- 3.Santin M, Huang SJ, Iannace S, Ambrosio L, Nicolais L, Peluso G. Biomaterials. 1996;17:1459–1467. doi: 10.1016/0142-9612(96)89769-9. [DOI] [PubMed] [Google Scholar]
- 4.Gursel I, Balcik C, Arica Y, Akkus O, Akkas N, Hasirci V. Biomaterials. 1998;19:1137–1143. doi: 10.1016/s0142-9612(98)00009-x. [DOI] [PubMed] [Google Scholar]
- 5.Elisseeff J, McIntosh W, Anseth K, Riley S, Ragan P, Langer R. J Biomed Mater Res. 2000;51:164–71. doi: 10.1002/(sici)1097-4636(200008)51:2<164::aid-jbm4>3.0.co;2-w. [DOI] [PubMed] [Google Scholar]
- 6.Riley SL, Dutt S, De La Torre R, Chen AC, Sah RL, Ratcliffe A. J Mater Sci Mater Med. 2001;12:983–90. doi: 10.1023/a:1012817317296. [DOI] [PubMed] [Google Scholar]
- 7.Kosmala JD, Henthorn DB, Brannon-Peppas L. Biomaterials. 2000;21:2019–2023. doi: 10.1016/s0142-9612(00)00057-0. [DOI] [PubMed] [Google Scholar]
- 8.Shanmugasundaram N, Ravichandran P, Reddy PN, Ramamurty N, Pal S, Rao KP. Biomaterials. 2001;22:1943–51. doi: 10.1016/s0142-9612(00)00220-9. [DOI] [PubMed] [Google Scholar]
- 9.Xin X, Borzacchiello A, Netti PA, Ambrosio L, Nicolais L. J Biomater Sci Polym Ed. 2004;15:1223–36. doi: 10.1163/1568562041753025. [DOI] [PubMed] [Google Scholar]
- 10.Lee CH, Singla A, Lee Y. Int J Pharm. 2001;221:1–22. doi: 10.1016/s0378-5173(01)00691-3. [DOI] [PubMed] [Google Scholar]
- 11.Sano A, Maeda M, Nagahara S, Ochiya T, Honma K, Itoh H, Miyata T, Fujioka K. Adv Drug Delivery Rev. 2003;55:1651–77. doi: 10.1016/j.addr.2003.08.005. [DOI] [PubMed] [Google Scholar]
- 12.Spotnitz WD, Prabhu R. J Long Term Eff Med Implants. 2005;15:245–270. doi: 10.1615/jlongtermeffmedimplants.v15.i3.20. [DOI] [PubMed] [Google Scholar]
- 13.Jockenhoevel S, Chalabi K, Sachweh JS, Groesdonk HV, Demircan L, Grossmann M, Zund G, Messmer BJ. Thorac Cardiovasc Surg. 2001;5:287–90. doi: 10.1055/s-2001-17807. [DOI] [PubMed] [Google Scholar]
- 14.Grassl ED, Oegema TR, Tranquillo RT. J Biomed Mater Res A. 2003;66:550–561. doi: 10.1002/jbm.a.10589. [DOI] [PubMed] [Google Scholar]
- 15.Yao L, Swartz DD, Gugino SF, Russel JA, Andreadis ST. Tissue Eng. 2005;11:991–1003. doi: 10.1089/ten.2005.11.991. [DOI] [PubMed] [Google Scholar]
- 16.Cummings CL, Gawlitta D, Nerem RM, Stegemann JP. Biomaterials. 2004;25:3699–3706. doi: 10.1016/j.biomaterials.2003.10.073. [DOI] [PubMed] [Google Scholar]
- 17.Roy P, Petroll WM, Chuong CJ, Cavanagh HD, Jester JV. Ann Biomed Eng. 1999;27:721–730. doi: 10.1114/1.227. [DOI] [PubMed] [Google Scholar]
- 18.Ehrlich HP, Rajaratnam JBM. Tissue Cell. 1990;22:407–417. doi: 10.1016/0040-8166(90)90070-p. [DOI] [PubMed] [Google Scholar]
- 19.Andujar MB, Melin M, Guerret S, Grimaud JA. J Submicrosc Cytol Pathol. 1992;24:145–154. [PubMed] [Google Scholar]
- 20.Schreiber DI, Enever PAJ, Tranquillo RT. Exp Cell Res. 2001;266:155–166. doi: 10.1006/excr.2001.5208. [DOI] [PubMed] [Google Scholar]
- 21.Chamley-Campbell JH, Campbell GR, Ross R. J Cell Biol. 1981;89:379–383. doi: 10.1083/jcb.89.2.379. [DOI] [PMC free article] [PubMed] [Google Scholar]
- 22.Hirose M, Kosugi H, Nakazato K, Hayashi T. J Biochem. 1999;125:991–1000. doi: 10.1093/oxfordjournals.jbchem.a022407. [DOI] [PubMed] [Google Scholar]
- 23.Song J, Rolfe BE, Hayward IP, Campbell GR, Campbell JH. In Vitro Cell Dev Biol Anim. 2000;36:600–610. doi: 10.1007/BF02577528. [DOI] [PubMed] [Google Scholar]
- 24.Stegemann JP, Nerem RM. Exp Cell Res. 2003;283:146–155. doi: 10.1016/s0014-4827(02)00041-1. [DOI] [PubMed] [Google Scholar]
- 25.Roeder BA, Kokini K, Sturgis JE, Robinson JP, Voytik-Harbin SL. J Biomech Eng. 2002;124:214–22. doi: 10.1115/1.1449904. [DOI] [PubMed] [Google Scholar]
- 26.Rowe SL, Lee SY, Stegemann JP. Acta Biomaterialia. in press. [DOI] [PMC free article] [PubMed] [Google Scholar]