

Abstract
Background
Calcium overload and reactive oxygen species can injure mitochondria during ischemia and reperfusion. We hypothesized that mitochondrial injury occurs during cardiac resuscitation causing cytochrome c release to the cytosol and bloodstream while activating apoptotic pathways.
Methods and Results
Plasma cytochrome c was measured using reverse-phase high performance liquid chromatography and western immunoblotting in rats undergoing 4 or 8 minutes of untreated ventricular fibrillation and 8 minutes of closed-chest resuscitation followed by 240 minutes post-resuscitation hemodynamic observation. A sham group served as control. Plasma cytochrome c rose progressively attaining levels 10-fold higher than in sham rats at 240 minutes post-resuscitation (p < 0.01) despite reversal of whole-body ischemia (decreases in arterial lactate). Cytochrome c levels inversely correlated with left ventricular stroke work (r = −0.40, p = 0.02). Western immunoblotting of left ventricular tissue demonstrated increased levels of 17-kDa cleaved caspase-3 fragments in the cytosol. Plasma cytochrome c was then serially measured in 12 resuscitated rats until the rat had died or cytochrome c had returned to baseline. In 3 survivors, cytochrome c rose slightly without exceeding 2 μg/ml and returned to baseline within 96 hours. In 9 non-survivors, cytochrome c rose progressively attaining significantly higher maximal levels (4.6 ± 2.0 vs 1.6 ± 0.3 μg/ml; p = 0.029) and at faster rates (0.7 ± 0.5 vs 0.1 ± 0.1 μg/ml/hr; p = 0.046) than in survivors.
Conclusion
Plasma cytochrome c may represent a novel in vivo marker of mitochondrial injury after resuscitation from cardiac arrest that relates inversely with survival outcome.
Keywords: Apoptosis, biological markers, cardiopulmonary resuscitation, cytochromes c, myocardial ischemia, ventricular fibrillation
INTRODUCTION
Cytochrome c is a 14-kDa hemoprotein that normally resides in the outer surface of the inner mitochondrial membrane bound to cardiolipin (34) and plays a key physiological role in oxidative phosphorylation as electron carrier between cytochrome c reductase (complex III) and cytochrome c oxidase (complex IV). However, cytochrome c, can also translocate out of the mitochondria to the cytosol under various pathological conditions such as ultraviolet irradiation (21), serum and glucose deprivation (9), exposure to H2O2 or superoxide anion (O2−) (44), Ca2+ overload (35), and hypoxia (16). In the cytosol, cytochrome c forms an oligomeric complex with dATP and the apoptotic protease activating factor-1 (Apaf-1) (30). This complex recruits procaspase-9 forming what is known as the apoptosome leading to cleavage and release of active caspase-9, which in turn cleaves and activates executioner caspases 3, 6, and 7 (10, 39, 48). The subsequent fate of cytochrome c is less well known. Recent studies in Jurkat leukemic T cells and mouse fibroblasts suggest that cytochrome c leaves the cell and is detected in the extracellular milieu through mechanisms apparently unrelated to cell necrosis (37, 46). In patients, elevated levels of circulating cytochrome c have been reported associated with conditions that can injure mitochondria such as chemotherapy (6, 37) acute myocardial infarction (2), fulminant hepatitis (38), the systemic inflammatory response syndrome (1), and influenza-associated encephalopathy (24, 25).
Our work has focused on cardiac arrest and resuscitation in which ischemia and reperfusion are at the core of the pathogenic process. Ischemia and reperfusion cause intracellular Ca2+ overload (42) and generation of reactive oxygen species (ROS) (3); conditions which – as indicated above – predispose to mitochondrial injury and cytochrome c release. We therefore hypothesized that mitochondria are injured during cardiac arrest and resuscitation prompting the release of cytochrome c with activation of apoptotic pathways and appearance in the bloodstream. Given the fundamental role of cytochrome c as electron carrier and its detrimental downstream effects when released to the cytosol we further hypothesized that levels of plasma cytochrome c may indicate development of organ dysfunction and relate inversely with survival outcome. We tested these hypotheses in a well standardized rat model of electrically-induced ventricular fibrillation (VF) and closed-chest resuscitation (18, 22, 29).
MATERIALS AND METHODS
The studies were approved by our Institutional Animal Care and Use Committee and conducted in accordance with institutional guidelines.
Animal Preparation
Adult male Sprague-Dawley rats (480 to 550 g) were anesthetized using sodium pentobarbital (45 mg/kg intraperitoneal for induction and 10 mg/kg intravenous every 30 minutes for maintenance). A 5-F cannula was orally advanced into the trachea and used for positive pressure ventilation during cardiac resuscitation and the post-resuscitation interval. Proper placement was verified using an infrared CO2 analyzer (CO2SMO model 7100, Novametrix Medical Systems, Inc.). A conventional lead II ECG was recorded through subcutaneous needles. PE50 catheters were advanced through the right femoral vein into the right atrium, from the right carotid into the left ventricle, and from the left femoral artery into the abdominal aorta for pressure measurement and blood sampling. A thermocouple microprobe (IT-18, Physitemp) was advanced through the right femoral artery into the thoracic aorta for thermodilution cardiac output measurement. A PE50 catheter was advanced through the left external jugular vein into the right atrium and used exclusively for injection of thermal tracer. A 3-F catheter (C-PUM-301J, Cook, Inc.) was advanced through the right external jugular vein into the right atrium, and through its lumen a pre-curved guide wire fed into the right ventricle and used for electrical induction of VF. Core temperature was maintained between 36.5°C and 37.5°C using an infrared heating lamp.
Ventricular Fibrillation and Resuscitation Protocol
VF was induced by delivering a 60-Hz alternating current to the right ventricular endocardium (0.1 to 0.6 mA) for an uninterrupted interval of three minutes after which the current was turned off and VF allowed to continue until completion of a predetermined interval (see below). Chest compression was then begun using an electronically controlled and pneumatically driven (50 PSI) chest compressor (CJ-80623, CJ Enterprises) set to deliver 200 compressions/min with a 50% duty cycle. The depth of compression was adjusted to attain an aortic diastolic pressure between 26 and 28 mm Hg ensuring a coronary perfusion pressure above the resuscitability threshold of 20 mm Hg in rats (18, 45). Positive pressure ventilation was provided using an electronically controlled solenoid valve (R-481, Clippard Instrument Laboratory Inc.) set to deliver 0.39 mL/100g body weight of 100% oxygen every two compressions. Defibrillation was attempted after 8 minutes of chest compression by delivering a maximum of two 2-J monophasic transthoracic shocks (Lifepak 9P, Physio-Control). If VF persisted or an organized rhythm with a mean aortic pressure of ≤ 25 mm Hg ensued, chest compression was resumed for 30 seconds. The defibrillation-compression cycle was repeated up to three additional times, increasing the energy of individual shocks if VF persisted to 4-J and then to 8-J for the last two cycles. Successful resuscitation was defined as the return of an organized cardiac rhythm with a mean aortic pressure ≥ 60 mmHg for ≥ 5 minutes. Resuscitated rats were ventilated initially with 100% O2 for 15 minutes and then continued with 50% O2 for the remaining post-resuscitation interval.
Experiments
Two series of experiments were conducted. In series-1, changes in plasma cytochrome c were measured for up to 240 minutes post-resuscitation in fully instrumented rats as described above. In series-2, changes in plasma cytochrome c were measured for up to 96 hours post-resuscitation in rats that were minimally instrumented to facilitate survival as described below.
Series-1
Three groups of 4 rats each were investigated. Two groups were subjected to either 4 or 8 minutes of untreated VF followed by 8 minutes of closed-chest resuscitation before attempting defibrillation and observed for a maximum of 240 minutes post-resuscitation. One group served as sham and received identical treatment except for VF and closed-chest resuscitation. Rats were randomized to the experimental assignment immediately after completion of surgical preparation.
Series-2
The animal preparation differed from series-1 in that hemodynamic measurements were limited to the right atrial and aortic pressures. Thus, PE50 tubing was advanced from the left jugular vein into the right atrium and from left carotid artery into the descending thoracic aorta avoiding additional surgical manipulation except for the 3-F catheter (C-PUM-301J, Cook, Inc.) and guide wire required for induction of VF. Core temperature was measured through a rectal thermistor. During closed-chest resuscitation, rats were ventilated using a volume controlled ventilator (Model 683, Harvard Apparatus) set to deliver 6 ml/kg at 25 breaths/min unsynchronized to chest compression. For defibrillation, a biphasic waveform defibrillator (Heartstream XL, Philips Medical Systems) was used delivering 3-, 5-, and 7-J as needed according to series-1 protocol. These changes reflected implementation of new developments in cardiac resuscitation. After 240 minutes post-resuscitation rats were allowed to recover from anesthesia. The left carotid PE50 tubing was then replaced by soft PE50 tubing primed with heparinized glycerol. The proximal end was sealed with a metal plug that could be removed for blood sampling and tunneled underneath the skin to the interscapular region where a skin incision held closed by a removable metal clip enabled intermittent access. For blood sampling, rats were anesthetized using isoflurane (0.5 to 1.0%) and 100% oxygen collecting 200 μl of arterial blood into a heparinized syringe. A total of 12 rats were successfully resuscitated after 8 minutes of untreated VF and 8 minutes of closed-chest resuscitation. Cytochrome c was serially measured until the rat had died or cytochrome c had returned to baseline levels.
Additional experiments were performed after documenting prominent increases in post-resuscitation plasma cytochrome c levels to determine (i) whether cytochrome c could induce apoptosis in circulating leukocytes and (ii) whether plasma cytochrome c could reflect increased apoptotic activity of leukocytes notwithstanding evidence suggesting that in other acute settings such as acute respiratory distress syndrome (31), sepsis (33), and burn injury (12) apoptosis is suppressed in neutrophils. Apoptosis was investigated using flow cytometry to detect exteriorization of phosphatidylserine in total leukocytes, neutrophils, and lymphocytes (43).
For in vitro studies, 5 ml of blood were collected through PE50 tubing advanced from the left carotid artery into the descending thoracic aorta in adult male Sprague-Dawley rats. Blood was heparinized (30 U/ml) and 300 μl aliquots were incubated with rat heart cytochrome c at concentrations of 0, 2 and 10 μg/ml at 37°C for 4 hours using an incubator shaker (Model I2400, New Brunswick Scientific). For in vivo studies, rats were subjected to 8 minutes of untreated VF followed by closed-chest resuscitation as described for series-2 and monitored until they had died. Arterial blood was collected when the mean aortic pressure had decreased below 40 mmHg. Blood samples were processed for flow cytometry as described below.
Materials
Acetonitrile, ethylene diamine tetraacetic acid (EDTA), (N-[2-hydroxyethyl] piperazine-N’-[2-ethanesulfonic acid]) (HEPES), mannitol, propidium iodide (PI), rat heart cytochrome c, sucrose, trifluoro-acetic acid, and mouse-monoclonal anti-β-actin antibody were purchased from Sigma; 1-mm thick 12% and 14% Novex® tris-glycine polyacrylamide gels from Invitrogen Corporation; polyvinylidene difluoride (PVDF) membrane from Roche Applied Science; rabbit polyclonal anti-cytochrome c, and rabbit polyclonal anti-caspase-3 antibodies from Cell Signaling Technology; mouse monoclonal anti-prohibitin antibody from Calbiochem; annexin V conjugated with fluorescein isothiocyanate (FITC) and mouse-monoclonal anti-cytochrome c antibody (clone 7H8.2C12) were from BD Biosciences PharMingen; Immunolyse (red blood cell lysis agent) from Coulter; and goat polyclonal anti-rabbit IgG along with goat polyclonal anti-mouse IgG horseradish peroxidase (HRP) conjugated antibodies, bicinchoninic acid (BCA) protein concentration assay kit, and West femto maximum sensitivity chemiluminescent detection kit from Pierce Biotechnology Inc.
Measurements
Hemodynamic variables
Continuous physiological measurements were transduced, conditioned (BIOPAC Systems), and digitized at 250 scans per second using a 16-bit data acquisition board (AT-MIO-16XE-50; National Instruments). Systemic and left ventricular pressures were obtained through fluid-filled systems attached to disposable pressure-transducers (Maxxim Medical) zeroed to midchest level. Cardiac output was measured by thermodilution after right atrial bolus injection of 200 μl of 0.9% NaCl at room temperature and curve-analysis using custom-developed LabVIEW-based software. Cardiac index (CI) was calculated by normalizing cardiac output in ml/min to body weight in kilograms. The stroke volume index (SVI) was calculated by dividing cardiac index by heart rate. Left ventricular stroke work index (LVSWI) was calculated by multiplying the SVI by the difference between left ventricular systolic and diastolic pressures.
Plasma cytochrome c
Arterial blood samples (200 μl) were collected into heparinized syringes and centrifuged at 5,000 rpm (2,320g) for 10 minutes at 4°C (Sorvall Biofuge Stratos, Heraeus). The supernatant (plasma) was frozen at −80°C for differed analysis using reverse-phase high performance liquid chromatography (HPLC) and western immunoblotting in series-1 but used immediately for analysis by HPLC in series-2.
HPLC
A reverse-phase HPLC technique previously used to measure cytochrome c in mitochondrial suspension and cytosol (15, 36) was adapted for measuring cytochrome c in plasma. Samples were first treated with 50% acetonitrile solution containing 0.1% trifluoro-acetic acid (ACN-TFA) (1:1, V/V) and then centrifuged at 5,000 rpm (2,320g) for 10 minutes to precipitate plasma proteins of high molecular weight. Cytochrome c was measured in the supernatant using a Beckman HPLC System equipped with a Jupiter C4 reverse-phase analytical column (150 × 4.6 mm, 5 μm, Phenomenex) preceded by a guard column (SecurityGuard, 4.0 × 3.0 mm, widepore C4 [Butyl], Phenomenex), an ultraviolet-visible light spectroscopic detector, and a Beckman System Gold software. The mobile phase was programmed to provide a constant-flow (1.0 ml/min) linear gradient starting at 20% ACN-TFA and increasing to 60% ACN-TFA over a 15-minute interval followed by a 5-minute 60% ACN-TFA wash and a 5-minute 20% ACN-TFA equilibration between samples. Each sample (20 μl) was loaded in an injection loop and automatically delivered into the mobile phase at the start of the linear gradient. Absorbance was measured at 393 nm. For quantification of plasma cytochrome c levels, standard curves (0.2 to 20 μg/ml) were prepared using rat heart cytochrome c dissolved in plasma obtained from pentobarbital-anesthetized rats not subject to surgical manipulation (Figure 1, panel A). Capability for detection of in vivo increases in cytochrome c was confirmed by serial plasma measurements after injection of 5 mg/kg of rat heart cytochrome c during spontaneous circulation (Figure 1, panel B).
Figure 1.

Plasma cytochrome c measured by HPLC. A: Standard curve using rat heart cytochrome c dissolved in plasma obtained from pentobarbital-anesthetized rats not subject to surgical manipulation. Absorbance was measured at 393 nm (ambient temperature) and the peak area determined by integrating the beginning to the end of the chromatographic peak center at ≈ 9.5 minutes retention time (arrow in panels B and C). Solid line represents linear fit of the data (r2 = 0.9996). B: Chromatographs of plasma obtained before and after right atrial injection of cytochrome c (5 mg/kg) during spontaneous circulation in a 500 g rat demonstrating capability for detecting plasma cytochrome c. C: Representative chromatographs of plasma obtained in a 506 g rat resuscitated after 8 minutes of untreated VF. The rat died at 8.5 hours post-resuscitation (PR) preceded by progressive rise in plasma cytochrome c.
Western immunoblotting
The technique previously described by Ausubel et al. and Harlow and Lane was used (5, 23). Plasma samples were thawed on ice and 8 μl resolved in 1-mm thick 12% Novex® tris-glycine polyacrylamide gel. Following electrophoresis, fractionated proteins were transferred to PVDF membrane using a wet electroblotting apparatus (Hoefer TE22, Amersham Pharmacia Biosciences). After transfer, the blots were blocked and incubated at 4°C overnight with rabbit polyclonal anti-cytochrome c antibody (1:2000 dilution) followed by goat polyclonal anti-rabbit IgG HRP conjugated antibody (1:1000 dilution) for 1 hour at room temperature. Chemiluminescence was documented in X-ray film. Protein molecular weight markers were run simultaneously in each gel. The specificity of the cytochrome c band was based on molecular weight along with positive and negative controls.
Western immunoblotting of left ventricular tissue
Hearts from series-1 experiments were harvested at 240 minutes post-resuscitation or earlier if hemodynamic deterioration occurred with a decrease in the mean aortic pressure below 40 mmHg (two instances). The right ventricle and atria were removed and the left ventricle frozen in liquid N2 and stored at −80°C until analysis. For assessing cytochrome c release, subcellular fractions were separated by the technique of Ott et al. with minor modifications (34) and subjected to western immunoblotting. Briefly, ≈ 100 mg of left ventricular tissue was homogenized in 2 ml MSH buffer (210 mM mannitol, 70 mM sucrose, 5 mM HEPES, pH 7.4, and 1 mM EDTA, pH 8) using a Dounce homogenizer and centrifuged at 1000g for 10 minutes to pellet nuclei and debris. The resulting supernatant was then centrifuged at 10,000g for 30 minutes. The pellet containing mitochondria was washed and resuspended in MSH buffer. The supernatant was further centrifuged at 33,000g for 3.3 hours and the resulting supernatant collected representing the cytosolic fraction. Both fractions were stored at −80°C until analysis. The protein concentration in each fraction was determined by the BCA kit. Mitochondrial and cytosolic fractions (20 μg each) were resolved in 1-mm thick 12% Novex® tris-glycine polyacrylamide gel and immunoblotted as described above for plasma cytochrome c. Cytochrome c was probed using a mouse monoclonal anti-cytochrome c antibody (1:4000 dilution). Prohibitin, a 30 kDa inner mitochondrial membrane protein, and β-actin were selected as loading controls for mitochondrial and cytosolic fractions respectively. Prohibitin was probed using a mouse monoclonal anti-prohibitin antibody (1:1000 dilution). β-actin was probed using a mouse monoclonal anti-β-actin antibody (1:2500 dilution). The blots were incubated with the primary antibodies for 3 hours at room temperature followed by incubation with goat polyclonal anti-mouse IgG HRP conjugate (1: 1000 dilution) for 1 hour at room temperature and documented by chemiluminescence.
For assessing caspase-3 activation, 100 mg of left ventricular tissue was homogenized in 0.4 ml of MSH buffer with a mixer mill homogenizer (Mixer mill, MM200, Retsch GmbH & Co). The cytosolic fraction (100 μg) was separated by subcellular fractionation as described above and subjected to 14% gel electrophoresis and western immunoblotting using rabbit polyclonal anti-caspase 3 antibody (1:1000 dilution). The antibody recognizes 35 kDa procaspase-3 and its 19 and 17 kDa cleaved fragments (32). For loading controls, β-actin was used as described above.
Detection of leukocyte apoptosis by flow cytometry
During apoptosis, phosphatidylserine which normally resides in the cytoplasmic side of cell membranes translocates to the extracellular side (20). This step is characteristic of early apoptosis (preceding DNA fragmentation) and is used to detect apoptosis based on annexin V binding to phosphatidylserine (43). Annexin V is a 36 kDa Ca2+-dependent phospholipid binding protein with high affinity for phospholipid bilayers containing phosphatidylserine (4) and is used in various apoptosis assays, commonly in conjunction with the vital dye PI to concomitantly assess for disruption of plasma membrane. In the present studies, blood was incubated with annexin V-FITC and PI and then subjected to flow cytometry to detect cells that bind annexin V (AV+) and those that bind PI (PI+) (43).
Blood labeling
Labeling with annexin V-FITC and PI was performed according to Oostveldt et al. (41) with modifications. Briefly, blood samples (100 μl) were washed first with phosphate buffered saline (PBS) and then with annexin V binding buffer (10 mM HEPES, 140 mM NaCl, 2.5 mM CaCl2, pH 7.4). The buffers were removed after wash by centrifugation at 370g for 5 minutes each and the pellets were suspended in 100 μl of annexin V binding buffer. Annexin V-FITC (5 μl) was added and incubated for 15 minutes at room temperature protected from light. The samples were then washed with PBS containing 2.5 mM CaCl2 to remove unbound annexin V-FITC. Red cells were lysed using 1 ml of Immunolyse diluted in PBS (1:24 dilution). The samples were then centrifuged at 370g for 5 minutes and the pellets resuspended in 400 μl of PBS containing 2.5 mM CaCl2. PI was then added to a final concentration of 2.5 ng/μl and the sample incubated on ice for 5–10 minutes before immediate analysis. All other samples were analyzed within an hour. Unstained samples, single stained samples (annexin V-FITC or PI), and double stained samples (annexin V-FITC and PI) were used to adjust compensation and to set horizontal and vertical cursors on the 2-parameter dot-plot.
Flow cytometry
A FACSCalibur cytometer (Becton Dickinson) equipped with a 488 nm argon-ion laser was used. The total leukocyte population was gated based on cell size (forward scatter) and granularity (side scatter) identifying two separate gates corresponding to neutrophils and lymphocytes. The FITC and PI fluorescence signals were detected using 530 nm and 585 nm band pass filters, respectively. Two dimensional fluorescence dot-plot profiles were generated representing ≈ 10,000 gated events for total leukocytes and proportionally fewer events for the subpopulations of neutrophils and lymphocytes. The data were analyzed using the CellQuest Pro software (Becton Dickinson).
Statistical Analysis
Differences among groups for continuous variables were analyzed using one-way ANOVA and Holm-Sidak’s for multiple comparisons. Alternative non-parametric tests were used if the data failed tests for normality or equal variance. The strength of association between variables was analyzed using Pearson’s product moment correlation test. The data were presented as mean ± SD unless otherwise stated. A two-tail value of p < 0.05 was considered significant.
RESULTS
Series-1
Baseline hemodynamic measurements were comparable among groups. Post-resuscitation, rats subject to VF developed characteristic post-resuscitation myocardial dysfunction evidenced by a persistently low mean aortic pressure and progressive reductions in LVSWI and CI without measurable differences related to the duration of untreated VF (Figure 2). Myocardial dysfunction accounted for early termination of one rat subjected to 4 minutes of untreated VF (at 150 minutes) and one rat subjected to 8 minutes of untreated VF (at 155 minutes). As previously reported, cardiac arrest and resuscitation was associated with anaerobic metabolism evidenced by prominent increases in arterial lactate and reductions in arterial bicarbonate. Arterial lactate was maximal upon return of spontaneous circulation and gradually decreased towards baseline during the post-resuscitation interval (Figure 3).
Figure 2.
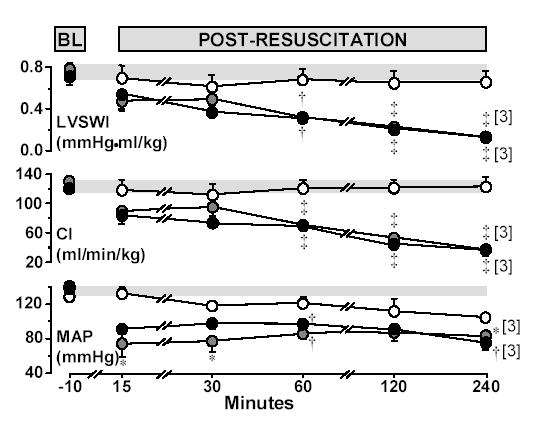
Hemodynamic and left ventricular measurements at baseline and post-resuscitation in rats randomized to untreated VF lasting 4 minutes (closed grey circles, n = 4), 8 minutes (closed black circles, n = 4), or to sham intervention (open circles, n = 4). Numbers in brackets indicate rats still alive. BL = Baseline; LVSWI = Left ventricle stroke work index; CI = Cardiac index; MAP = Mean aortic pressure. The shaded horizontal bar across each graph represents the 95% confidence interval of the aggregate baseline values. Mean ± SEM. *p < 0.05; †p < 0.01, and ‡p < 0.001 vs sham by one-way ANOVA and Holm-Sidak’s test for multiple comparisons.
Figure 3.
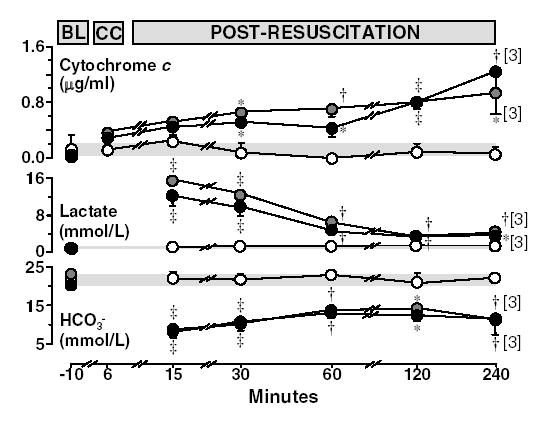
Plasma cytochrome c (HPLC), lactate, and bicarbonate (HCO3−) at baseline, chest compression (for cytochrome c), and post-resuscitation in rats randomized to untreated VF lasting 4 minutes (closed grey circles, n = 4), 8 minutes (closed black circles, n = 4), or to sham intervention (open circles, n = 4). Numbers in brackets indicate rats still alive. BL = Baseline; CC = Chest compression. The shaded horizontal bar across each graph represents the 95% confidence interval of the aggregate baseline values. Mean ± SEM. *p < 0.05; †p < 0.01 and ‡p < 0.001 vs sham by one-way ANOVA and Holm-Sidak’s test for multiple comparisons.
Plasma cytochrome c rose progressively during the post-resuscitation interval in rats subject to VF separating statistically from sham rats at 30 minutes post-resuscitation and onwards (Figure 3). Western immunoblotting confirmed elevated levels of cytochrome c in plasma during the post-resuscitation interval (Figure 4). The plasma levels of cytochrome c were inversely correlated with LVSWI (r = −0.40, p = 0.02, for 38 measurements obtained at five post-resuscitation events in eight resuscitated rats).
Figure 4.
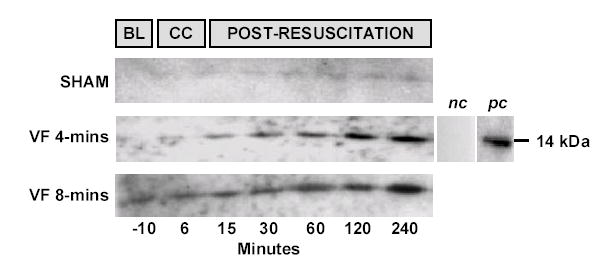
Western immunoblots of plasma cytochrome c using rabbit polyclonal anti-cytochrome c primary antibody (1:2000 dilution) and goat polyclonal anti-rabbit IgG HRP conjugated secondary antibody (1:1000 dilution) in three representative experiments. Eight μl of plasma were loaded in each lane. Plasma cytochrome c levels remained unchanged in sham controls but progressively rose in rats subjected to VF. Negative control (nc) was obtained from a cytochrome c positive rat plasma (240 minutes post-resuscitation) in which the primary antibody was omitted. Positive control (pc) represents the antibody reactivity to rat heart cytochrome c from Sigma.
In left ventricular tissue, higher values for cytochrome c were observed in cytosolic and mitochondrial fractions proportional to the injury but the differences were not statistically significant (Figure 5, panel A and Figure 6). The level of 17 kDa caspase-3 fragments measured in the cytosolic fraction, however, was significantly increased in rats resuscitated from VF (Figure 5, panel B and Figure 6).
Figure 5.

A: Western immunoblots of prohibitin (30 kDa) and cytochrome c (14 kDa) in left ventricular cytosolic (c) and mitochondrial (m) fractions (20 μg each) from 2 rats each randomized to untreated VF lasting 4 minutes (VF 4-mins), 8 minutes (VF 8-mins), or to sham intervention. Prohibitin served as loading control for the mitochondrial fraction and to exclude mitochondrial contamination of the cytosolic fraction. β-actin (42 kDa) served as loading control for the cytosolic fractions. Negative controls (nc) obtained by omitting the primary antibody. B: Western immunoblots of caspase-3, full-length (35 kDa) and cleaved fragments (19 and 17 kDa) in left ventricular cytosolic fraction (100 μg) from 2 rats each randomized to untreated VF lasting 4 minutes, 8 minutes, or to sham intervention. β-actin (42 kDa) served as loading control. Negative controls (nc) obtained by omitting the primary antibody. Longer exposure times were required to detect the cleaved fragments.
Figure 6.
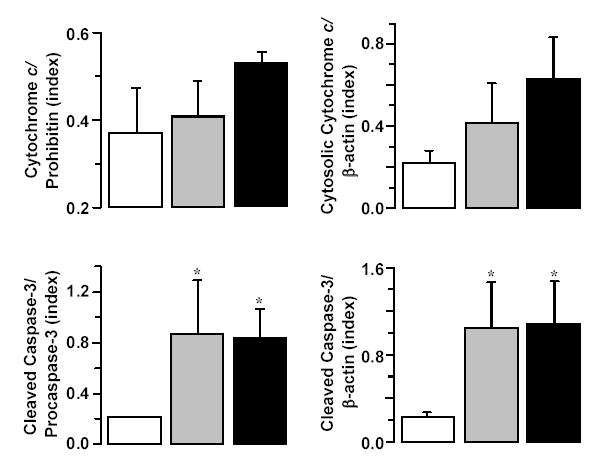
Densitometry of immunoblots demonstrating numerical increases in mitochondrial cytochrome c relative to prohibitin and cytosolic cytochrome c relative to β-actin and statistically significant increases in 17 kDa cleaved caspase-3 fragments in the cytosolic fraction relative to pro-caspase-3 and β-actin at 240 minutes post-resuscitation. Rats were randomized to untreated VF lasting 4 minutes (closed grey bars, n = 4), 8 minutes (closed black bars, n = 4), or to sham intervention (open bars, n = 4). Mean ± SEM. *p < 0.05 vs sham by one-way ANOVA and Dunn’s test for multiple comparisons.
Series-2
Of 12 successfully resuscitated rats, 3 survived for more than 24 hours and were euthanized according to protocol after 70 to 96 hours. In this group, cytochrome c rose gradually to levels not exceeding 2 μg/ml and then returned to baseline levels (Figure 7). The remaining 9 rats died between 1.3 and 32.5 hours post-resuscitation having a progressive rise in plasma cytochrome c (Figure 1, panel C and Figure 7) attaining higher maximal levels (4.6 ± 2.0 vs 1.6 ± 0.3 μg/ml; p = 0.029) and at faster rates (0.7 ± 0.5 vs 0.1 ± 0.05 μg/ml/hr; p = 0.046) than in survivor rats. Comparison of survivors and non-survivors demonstrated similar coronary perfusion pressures during chest compression but numerically higher energy requirements for successful defibrillation in non-survivors (Table 1). Post-resuscitation, non-survivor rats had a numerically lower mean aortic pressure at 60 minutes (78 ± 26 and 98 ± 2 mmHg) and at 120 minutes (85 ± 18 and 100 ± 4 mmHg).
Figure 7.

Serial measurements of plasma cytochrome c by reverse-phase HPLC in rats successfully resuscitated after 8 minutes of untreated VF. Measurements were made until the cytochrome c level had returned to baseline or the rat had died. Open circles represent survivors (n = 3) and closed circles represent non-survivors (n = 9).
Table 1.
Resuscitation effort
| Averaged CPP (mmHg)
|
Energy of initial successful shock (Joules)
|
Total # of DF shocks (n)
|
Cumulative DF energy (Joules)
|
Duration of VF (Seconds)
|
|
|---|---|---|---|---|---|
| Non-Survivors (n = 9) | 21 ± 3 | 4 ± 2 | 1.9 ± 1.5 | 7 ± 7 | 983 ± 29 |
| Survivors (n = 3) | 20 ± 3 | 3 ± 0 | 1.0 ± 0.0 | 3 ± 0 | 906 ± 103 |
CPP = Coronary perfusion pressure averaged from minute 2 to minute 8 of chest compression; DF = Defibrillation; VF = Ventricular fibrillation. No statistical differences were observed between groups.
Leukocyte Apoptosis
Flow cytometry scattergrams of total leukocytes, neutrophils, and lymphocytes at baseline and post-resuscitation are shown in Figure 8. Dots in the lower left quadrant (AV−/PI−) represent viable cells that bind neither annexin V nor PI. Dots in the lower right quadrant (AV+/PI−) represent cells that bind only annexin V and are considered to be in early stages of apoptosis and maintain their membrane integrity. Dots in the upper right quadrant (AV+/PI+) represent cells that bind to both annexin V and PI and are considered to be in late stages of apoptosis having disruption of cell membrane, or to be undergoing necrosis (43). The aggregate data from the in vitro and in vivo studies are shown in Table 2. The in vitro studies showed that incubation with increasing concentrations of cytochrome c (up to 10 μg/ml) did not induce apoptosis in total leukocytes, neutrophils, or lymphocytes as evidenced by comparably low percentage of AV+/PI− and AV+/PI+ cells. The in vivo studies showed a decreased percentage of AV+/PI− neutrophils after resuscitation but not in lymphocytes, which already had low level of apoptosis. The plasma cytochrome c levels measured by HPLC in these rats corresponded to 0.13 ± 0.18 μg/ml at baseline and 2.36 ± 0.74 μg/ml at post-resuscitation.
Figure 8.

Detection of apoptosis in rat blood leukocytes by annexin V-FITC and propidium iodide labeling followed by flow cytometry. Flow scattergrams of total leukocytes, neutrophils, and lymphocytes from blood obtained from representative rats at baseline in one animal and at post-resuscitation (PR) after 8 minutes of untreated VF in another. The x- and y-axes represent relative fluorescence intensity. The percentages represent number of events within the respective quadrants.
Table 2.
Flow cytometric analysis of apoptotic cells in leukocytes, neutrophils, and lymphocytes.
|
In vitro |
In vivo |
||||
|---|---|---|---|---|---|
| Incubation with cytochrome c |
Baseline
|
Post-resuscitation
|
|||
| 0-μg/ml (n = 3) | 2-μg/ml (n = 3) | 10-μg/ml (n = 3) | (n = 3) | (n = 2) | |
| Leukocytes (% of cells) | |||||
| AV+/PI− | 2.95 ± 2.12 | 4.41 ± 3.67 | 3.59 ± 1.72 | 2.29 ± 1.06 | 0.24 ± 0.34 |
| AV+/PI+ | 0.19 ± 0.11 | 0.26 ± 0.19 | 0.28 ± 0.18 | 0.17 ± 0.07 | 0.41 ± 0.18 |
| Neutrophils (% of cells) | |||||
| AV+/PI− | 9.94 ± 6.47 | 13.71 ± 9.66 | 10.93 ± 4.10 | 9.28 ± 1.50 | 1.31 ± 1.58* |
| AV+/PI+ | 0.37 ± 0.36 | 0.65 ± 0.66 | 0.64 ± 0.40 | 0.54 ± 0.60 | 0.78 ± 0.30 |
| Lymphocytes (% of cells) | |||||
| AV+/PI− | 0.38 ± 0.09 | 0.53 ± 0.23 | 0.55 ± 0.16 | 0.20 ± 0.19 | 0.20 ± 0.21 |
| AV+/PI+ | 0.00 ± 0.00 | 0.01 ± 0.02 | 0.00 ± 0.00 | 0.00 ± 0.01 | 0.01 ± 0.00 |
AV = Annexin V. PI = Propidium iodide. AV+/PI− = Early apoptotic cells. AV+/PI+ = Late apoptotic/necrotic cells. Approximately 10,000 events were gated for leukocytes and proportionally fewer for the subpopulations of neutrophils and lymphocytes. Mean ± SD.
p < 0.02 vs baseline by one-way ANOVA.
DISCUSSION
The present study demonstrates for the first time in a rat model of VF and closed-chest resuscitation that cytochrome c is released into the bloodstream after resuscitation from cardiac arrest. Release of cytochrome c was associated with activation of executioner caspase-3, impaired left ventricular function, and decreased survival. Accordingly, measurement of cytochrome c in plasma may serve as in vivo marker of mitochondrial injury that inversely relates to survival outcome.
Cytochrome c Release to the Cytosol
Release of cytochrome c to the cytosol is an important pathogenic event that signals activation of the intrinsic (or mitochondrial) apoptotic pathway with subsequent activation of executioner caspases. In the present studies, we documented activation of the executioner caspase-3 in the cytosol of left ventricular tissue by detecting 17-kDa cleaved fragments. Caspase-3 activation was associated with numerical increases in cytosolic and mitochondrial cytochrome c. Additional work is underway in our laboratory to validate these tissue findings, explore possible participation of the extrinsic apoptotic pathway, and examine the downstream effect of caspase activation considering that apoptotic death is one of many other possible cell effects, some of which may not be lethal and explain reversible dysfunction (13, 40). The possibility of increased mitochondrial cytochrome c after resuscitation is intriguing but consistent with recent studies reporting up regulation of genes encoding for proteins of the respiratory chain during apoptosis (11).
Various mechanisms have been proposed to explain how cytochrome c is released from the mitochondria. One mechanism involves opening of a high-conductance mega channel known as the mitochondrial permeability transition pore (MPTP) (14). The pore forms by apposition of at least three major proteins including adenine nucleotide translocator, voltage dependent anion channel, and cyclophilin D (14) enabling molecules up to 1.5 kDa to pass through the channel. MPTP opening in vitro causes mitochondrial swelling with disruption of the outer mitochondrial membrane and release of cytochrome c (14, 47). However, it is not clear whether swelling occurs in vivo. Another mechanism involves selective permeabilization of the outer mitochondrial membrane without MPTP opening. Pro-apoptotic and anti-apoptotic proteins of the beta-cell leukaemia/lymphoma-2 (Bcl-2) family play a critical role given their capability for forming channel-like structures when pro-apoptotic members translocate to the outer mitochondrial membrane (19, 28). Cytochrome c release is facilitated by concurrent peroxidation of cardiolipin by ROS. Peroxidation of cardiolipin decreases its binding affinity for cytochrome c creating a soluble pool that can be released to the cytosol (34).
The specific mechanism(s) responsible for cytochrome c release in our experimental model is not yet known. It is conceivable that a particular mechanism of cytochrome c release may relate to the type and severity of tissue injury. For instance, MPTP opening but not outer mitochondrial membrane permeabilization causes collapse of the mitochondrial voltage gradient leading to uncoupling of oxidative phosphorylation and cessation of ATP production (17).
Cytochrome c Release to the Bloodstream
The mechanism by which cytosolic cytochrome c reaches the extracellular space and appears in the bloodstream is not well understood. Several studies have shown that cytochrome c release outside the cell occurs without concomitant release of larger molecules such as lactate dehydrogenase, which is considered a marker of cell necrosis with disruption of cell membrane (1, 6, 7, 37). Regardless of mechanisms, our study demonstrated progressive rise in plasma cytochrome c during the post-resuscitation period attaining levels that were inversely related to survival outcome. Increases in cytochrome c occurred after return of spontaneous circulation despite reversal of whole-body ischemia. This would suggest that ischemia and reperfusion trigger processes leading to progressive rise in plasma cytochrome c after return of metabolically adequate blood flow. The specific organs that contributed to circulating cytochrome c were not determined in this study. Organs rich in mitochondria with high metabolic rate and prone to ischemia and reperfusion injury such as the heart and brain are likely candidates. However, without knowing the specific mechanisms of cytochrome c release especially after return of spontaneous circulation, other mitochondria-rich organs such as the liver, kidney, pancreas, and skeletal muscle can not be excluded. The possibility that plasma cytochrome c was contributed by circulating blood cells was considered. Circulating red cells contain considerable amount of caspase-3; however, they lack nuclei, mitochondria, and the machinery for activation of apoptotic pathways (8). Neutrophils, on the other hand can undergo apoptosis. However, studies have shown that apoptosis in neutrophils is actually delayed under conditions such as acute respiratory distress syndrome (31), sepsis (33), and burn injury (12). Huda et al. demon strated no signs that apoptosis is activated in neutrophils at 4 hours post-reperfusion following tourniquet-induced ischemia in human skeletal muscle (27). Acute stress, in fact, seems to suppress the mitochondrial apoptotic pathway of neutrophils consequent to down-regulation of pro-apoptotic Bcl-2 proteins (26). Likewise, we found in the present studies that the percentage of neutrophils undergoing apoptosis is reduced after resuscitation from cardiac arrest and that increased levels of cytochrome c are not likely to induce apoptosis in leukocytes. Accordingly, the increased plasma levels of cytochrome c in the present studies most likely originated from organs that suffered ischemia and reperfusion injury during cardiac arrest and resuscitation.
Significance
Our studies suggest that measuring levels of circulating cytochrome c could serve as in vivo marker of mitochondrial injury and organ damage (i.e., left ventricular dysfunction) and prognosticate survival after resuscitation from cardiac arrest. Recently, similar observations have been made in patients with a wide variety of critical conditions. For example, Adachi et al. reported rapid rise in serum cytochrome c in patients presenting with the systemic inflammatory response syndrome and multi organ dysfunction syndrome, with higher levels observed in patients who did not survive the episode (1). Likewise, levels of cytochrome c in patients presenting with influenza-associated encephalopathy were significantly higher in those who died (25). A similar negative predictive value of serum cytochrome c has been reported in patients presenting with fulminant hepatitis (38).
Conclusions
We conclude that cardiac arrest and resuscitation trigger events leading to progressive and prominent increases in circulating cytochrome c. We propose that plasma cytochrome c may represent a novel in vivo marker of mitochondrial injury during resuscitation from cardiac arrest that could serve to quantitate the severity of injury, prognosticate survival outcomes, and act as surrogate measurement for gauging the effects of therapeutic interventions.
Acknowledgments
We gratefully acknowledge the assistance of Dr. Kenneth D. Beaman, PhD, Professor and Director of Clinical Immunology and Dr. Alice Gilman-Sachs, PhD, Associate Professor and Associate Director of Clinical Immunology and Director of the Flow Cytometry Laboratory at Rosalind Franklin University of Medicine and Science. They provided invaluable material support and guidance for the experiments involving flow cytometry.
Footnotes
DISCLOSURES
None
GRANTS
Work supported by an NIH grant R01 HL71728-01 entitled “Myocardial Protection by NHE-1 Inhibition” and a VA Merit Review Grant entitled “Myocardial Protection during Ventricular Fibrillation”.
References
- 1.Adachi N, Hirota M, Hamaguchi M, Okamoto K, Watanabe K, Endo F. Serum cytochrome c level as a prognostic indicator in patients with systemic inflammatory response syndrome. Clin Chim Acta. 2004;342:127–136. doi: 10.1016/j.cccn.2003.12.011. [DOI] [PubMed] [Google Scholar]
- 2.Alleyne T, Joseph J, Sampson V. Cytochrome-c detection: a diagnostic marker for myocardial infarction. Appl Biochem Biotechnol. 2001;90:97–105. doi: 10.1385/abab:90:2:97. [DOI] [PubMed] [Google Scholar]
- 3.Ambrosio G, Zweier JL, Duilio C, Kuppusamy P, Santoro G, Elia PP, Tritto I, Cirillo P, Condorelli M, Chiariello M, Flaherty JT. Evidence that mitochondrial respiration is a source of potentially toxic oxygen free radicals in intact rabbit hearts subjected to ischemia and reflow. J Biol Chem. 1993;268:18532–18541. [PubMed] [Google Scholar]
- 4.Andree HA, Reutelingsperger CP, Hauptmann R, Hemker HC, Hermens WT, Willems GM. Binding of vascular anticoagulant alpha (VAC alpha) to planar phospholipid bilayers. J Biol Chem. 1990;265:4923–4928. [PubMed] [Google Scholar]
- 5.Ausubel FM, Brent R, Kingston RE, Moore DD, Seidman JG, Smith JA, Struhl K. Short Protocols in Molecular Biology. John Wiley & Sons, Inc; 2004. Analysis of Proteins. [Google Scholar]
- 6.Barczyk K, Kreuter M, Pryjma J, Booy EP, Maddika S, Ghavami S, Berdel WE, Roth J, Los M. Serum cytochrome c indicates in vivo apoptosis and can serve as a prognostic marker during cancer therapy. Int J Cancer. 2005;116:167–173. doi: 10.1002/ijc.21037. [DOI] [PubMed] [Google Scholar]
- 7.Ben Ari Z, Schmilovotz-Weiss H, Belinki A, Pappo O, Sulkes J, Neuman MG, Kaganovsky E, Kfir B, Tur-Kaspa R, Klein T. Circulating soluble cytochrome c in liver disease as a marker of apoptosis. J Intern Med. 2003;254:168–175. doi: 10.1046/j.1365-2796.2003.01171.x. [DOI] [PubMed] [Google Scholar]
- 8.Berg CP, Engels IH, Rothbart A, Lauber K, Renz A, Schlosser SF, Schulze-Osthoff K, Wesselborg S. Human mature red blood cells express caspase-3 and caspase-8, but are devoid of mitochondrial regulators of apoptosis. Cell Death Differ. 2001;8:1197–1206. doi: 10.1038/sj.cdd.4400905. [DOI] [PubMed] [Google Scholar]
- 9.Bialik S, Cryns VL, Drincic A, Miyata S, Wollowick AL, Srinivasan A, Kitsis RN. The mitochondrial apoptotic pathway is activated by serum and glucose deprivation in cardiac myocytes. Circ Res. 1999;85:403–414. doi: 10.1161/01.res.85.5.403. [DOI] [PubMed] [Google Scholar]
- 10.Budihardjo I, Oliver H, Lutter M, Luo X, Wang X. Biochemical pathways of caspase activation during apoptosis. Annu Rev Cell Dev Biol. 1999;15:269–290. doi: 10.1146/annurev.cellbio.15.1.269. [DOI] [PubMed] [Google Scholar]
- 11.Chandra D, Liu JW, Tang DG. Early mitochondrial activation and cytochrome c up-regulation during apoptosis. J Biol Chem. 2002;277:50842–50854. doi: 10.1074/jbc.M207622200. [DOI] [PubMed] [Google Scholar]
- 12.Chitnis D, Dickerson C, Munster AM, Winchurch RA. Inhibition of apoptosis in polymorphonuclear neutrophils from burn patients. J Leukoc Biol. 1996;59:835–839. doi: 10.1002/jlb.59.6.835. [DOI] [PubMed] [Google Scholar]
- 13.Communal C, Sumandea M, de Tombe P, Narula J, Solaro RJ, Hajjar RJ. Functional consequences of caspase activation in cardiac myocytes. Proc Natl Acad Sci U S A. 2002;99:6252–6256. doi: 10.1073/pnas.092022999. [DOI] [PMC free article] [PubMed] [Google Scholar]
- 14.Crompton M. The mitochondrial permeability transition pore and its role in cell death. Biochem J. 1999;341:233–249. [PMC free article] [PubMed] [Google Scholar]
- 15.Crouser ED, Gadd ME, Julian MW, Huff JE, Broekemeier KM, Robbins KA, Pfeiffer DR. Quantitation of cytochrome c release from rat liver mitochondria. Anal Biochem. 2003;317:67–75. doi: 10.1016/s0003-2697(03)00044-7. [DOI] [PubMed] [Google Scholar]
- 16.de Moissac D, Gurevich RM, Zheng H, Singal PK, Kirshenbaum LA. Caspase activation and mitochondrial cytochrome C release during hypoxia-mediated apoptosis of adult ventricular myocytes. J Mol Cell Cardiol. 2000;32:53–63. doi: 10.1006/jmcc.1999.1057. [DOI] [PubMed] [Google Scholar]
- 17.Di Lisa F, Canton M, Menabo R, Dodoni G, Bernardi P. Mitochondria and reperfusion injury. The role of permeability transition. Basic Res Cardiol. 2003;98:235–241. doi: 10.1007/s00395-003-0415-x. [DOI] [PubMed] [Google Scholar]
- 18.Duggal C, Weil MH, Gazmuri RJ, Tang W, Sun S, O'Connell F, Ali M. Regional blood flow during closed-chest cardiac resuscitation in rats. J Appl Physiol. 1993;74:147–152. doi: 10.1152/jappl.1993.74.1.147. [DOI] [PubMed] [Google Scholar]
- 19.Eskes R, Desagher S, Antonsson B, Martinou JC. Bid induces the oligomerization and insertion of Bax into the outer mitochondrial membrane. Mol Cell Biol. 2000;20:929–935. doi: 10.1128/mcb.20.3.929-935.2000. [DOI] [PMC free article] [PubMed] [Google Scholar]
- 20.Fadok VA, Voelker DR, Campbell PA, Cohen JJ, Bratton DL, Henson PM. Exposure of phosphatidylserine on the surface of apoptotic lymphocytes triggers specific recognition and removal by macrophages. J Immunol. 1992;148:2207–2216. [PubMed] [Google Scholar]
- 21.Gao W, Pu Y, Luo KQ, Chang DC. Temporal relationship between cytochrome c release and mitochondrial swelling during UV-induced apoptosis in living HeLa cells. J Cell Sci. 2001;114:2855–2862. doi: 10.1242/jcs.114.15.2855. [DOI] [PubMed] [Google Scholar]
- 22.Gazmuri RJ, Ayoub IM, Hoffner E, Kolarova JD. Successful ventricular defibrillation by the selective sodium-hydrogen exchanger isoform-1 inhibitor cariporide. Circulation. 2001;104:234–239. doi: 10.1161/01.cir.104.2.234. [DOI] [PubMed] [Google Scholar]
- 23.Harlow E, Lane D. Immunoblotting. In: Harlow E, Lane D, editors. Using Antibodies: A Laboratory Manual. Vol. 269. Cold Spring Harbor, NY: Cold Spring Harbor Laboratory Press; pp. 309–1999. [Google Scholar]
- 24.Hosoya M, Kawasaki Y, Katayose M, Sakuma H, Watanabe M, Igarashi E, Aoyama M, Nunoi H, Suzuki H. Prognostic predictive values of serum cytochrome c, cytokines, and other laboratory measurements in acute encephalopathy with multiple organ failure. Arch Dis Child. 2006;91:469–72. doi: 10.1136/adc.2005.078436. [DOI] [PMC free article] [PubMed] [Google Scholar]
- 25.Hosoya M, Nunoi H, Aoyama M, Kawasaki Y, Suzuki H. Cytochrome c and tumor necrosis factor-alpha values in serum and cerebrospinal fluid of patients with influenza-associated encephalopathy. Pediatr Infect Dis J. 2005;24:467–470. doi: 10.1097/01.inf.0000160995.07461.b8. [DOI] [PubMed] [Google Scholar]
- 26.Hu Z, Sayeed MM. Suppression of mitochondria-dependent neutrophil apoptosis with thermal injury. Am J Physiol Cell Physiol. 2004;286:C170–C178. doi: 10.1152/ajpcell.00187.2003. [DOI] [PubMed] [Google Scholar]
- 27.Huda R, Vergara LA, Solanki DR, Sherwood ER, Mathru M. Selective activation of protein kinase C delta in human neutrophils following ischemia reperfusion of skeletal muscle. Shock. 2004;21:500–504. doi: 10.1097/01.shk.0000124029.92586.5a. [DOI] [PubMed] [Google Scholar]
- 28.Kluck RM, Esposti MD, Perkins G, Renken C, Kuwana T, Bossy-Wetzel E, Goldberg M, Allen T, Barber MJ, Green DR, Newmeyer DD. The pro-apoptotic proteins, Bid and Bax, cause a limited permeabilization of the mitochondrial outer membrane that is enhanced by cytosol. J Cell Biol. 1999;147:809–822. doi: 10.1083/jcb.147.4.809. [DOI] [PMC free article] [PubMed] [Google Scholar]
- 29.Kolarova JD, Ayoub IM, Gazmuri RJ. Cariporide enables hemodynamically more effective chest compression by leftward shift of its flow-depth relationship. Am J Physiol Heart Circ Physiol. 2005;288:H2904–H2911. doi: 10.1152/ajpheart.01181.2004. [DOI] [PubMed] [Google Scholar]
- 30.Li P, Nijhawan D, Budihardjo I, Srinivasula SM, Ahmad M, Alnemri ES, Wang X. Cytochrome c and dATP-dependent formation of Apaf-1/caspase-9 complex initiates an apoptotic protease cascade. Cell. 1997;91:479–489. doi: 10.1016/s0092-8674(00)80434-1. [DOI] [PubMed] [Google Scholar]
- 31.Matute-Bello G, Liles WC, Radella F, Steinberg KP, Ruzinski JT, Jonas M, Chi EY, Hudson LD, Martin TR. Neutrophil apoptosis in the acute respiratory distress syndrome. Am J Respir Crit Care Med. 1997;156:1969–1977. doi: 10.1164/ajrccm.156.6.96-12081. [DOI] [PubMed] [Google Scholar]
- 32.Nicholson DW, Ali A, Thornberry NA, Vaillancourt JP, Ding CK, Gallant M, Gareau Y, Griffin PR, Labelle M, Lazebnik YA, Munday NA, Raju SM, Smulson ME, Yamin TT, Yu VL, Miller DK. Identification and inhibition of the ICE/CED-3 protease necessary for mammalian apoptosis. Nature. 1995;376:37–43. doi: 10.1038/376037a0. [DOI] [PubMed] [Google Scholar]
- 33.Nolan B, Collette H, Baker S, Duffy A, De M, Miller C, Bankey P. Inhibition of neutrophil apoptosis after severe trauma is NFkappabeta dependent. J Trauma. 2000;48:599–604. doi: 10.1097/00005373-200004000-00004. [DOI] [PubMed] [Google Scholar]
- 34.Ott M, Robertson JD, Gogvadze V, Zhivotovsky B, Orrenius S. Cytochrome c release from mitochondria proceeds by a two-step process. Proc Natl Acad Sci U S A. 2002;99:1259–1263. doi: 10.1073/pnas.241655498. [DOI] [PMC free article] [PubMed] [Google Scholar]
- 35.Petrosillo G, Ruggiero FM, Pistolese M, Paradies G. Ca2+-induced reactive oxygen species production promotes cytochrome c release from rat liver mitochondria via mitochondrial permeability transition (MPT)-dependent and MPT-independent mechanisms: role of cardiolipin. J Biol Chem. 2004;279:53103–53108. doi: 10.1074/jbc.M407500200. [DOI] [PubMed] [Google Scholar]
- 36.Picklo MJ, Zhang J, Nguyen VQ, Graham DG, Montine TJ. High-pressure liquid chromatography quantitation of cytochrome c using 393 nm detection. Anal Biochem. 1999;276:166–170. doi: 10.1006/abio.1999.4349. [DOI] [PubMed] [Google Scholar]
- 37.Renz A, Berdel WE, Kreuter M, Belka C, Schulze-Osthoff K, Los M. Rapid extracellular release of cytochrome c is specific for apoptosis and marks cell death in vivo. Blood. 2001;98:1542–1548. doi: 10.1182/blood.v98.5.1542. [DOI] [PubMed] [Google Scholar]
- 38.Sakaida I, Kimura T, Yamasaki T, Fukumoto Y, Watanabe K, Aoyama M, Okita K. Cytochrome c is a possible new marker for fulminant hepatitis in humans. J Gastroenterol. 2005;40:179–185. doi: 10.1007/s00535-004-1517-4. [DOI] [PubMed] [Google Scholar]
- 39.Saleh A, Srinivasula SM, Acharya S, Fishel R, Alnemri ES. Cytochrome c and dATP-mediated oligomerization of Apaf-1 is a prerequisite for procaspase-9 activation. J Biol Chem. 1999;274:17941–17945. doi: 10.1074/jbc.274.25.17941. [DOI] [PubMed] [Google Scholar]
- 40.Supinski GS, Callahan LA. Caspase activation contributes to endotoxin induced diaphragm weakness. J Appl Physiol. 2006;100:1770–1777. doi: 10.1152/japplphysiol.01288.2005. [DOI] [PubMed] [Google Scholar]
- 41.Van Oostveldt K, Dosogne H, Burvenich C, Paape MJ, Brochez V, Van den EE. Flow cytometric procedure to detect apoptosis of bovine polymorphonuclear leukocytes in blood. Vet Immunol Immunopathol. 1999;70:125–133. doi: 10.1016/s0165-2427(99)00071-9. [DOI] [PubMed] [Google Scholar]
- 42.Varadarajan SG, An J, Novalija E, Smart SC, Stowe DF. Changes in [Na(+)](i), compartmental [Ca(2+)], and NADH with dysfunction after global ischemia in intact hearts. Am J Physiol Heart Circ Physiol. 2001;280:H280–H293. doi: 10.1152/ajpheart.2001.280.1.H280. [DOI] [PubMed] [Google Scholar]
- 43.Vermes I, Haanen C, Steffens-Nakken H, Reutelingsperger C. A novel assay for apoptosis. Flow cytometric detection of phosphatidylserine expression on early apoptotic cells using fluorescein labelled Annexin V. J Immunol Methods. 1995;184:39–51. doi: 10.1016/0022-1759(95)00072-i. [DOI] [PubMed] [Google Scholar]
- 44.von Harsdorf R, Li PF, Dietz R. Signaling pathways in reactive oxygen species-induced cardiomyocyte apoptosis. Circulation. 1999;99:2934–2941. doi: 10.1161/01.cir.99.22.2934. [DOI] [PubMed] [Google Scholar]
- 45.von Planta I, Weil MH, von Planta M, Bisera J, Bruno S, Gazmuri RJ, Rackow EC. Cardiopulmonary resuscitation in the rat. J Appl Physiol. 1988;65:2641–2647. doi: 10.1152/jappl.1988.65.6.2641. [DOI] [PubMed] [Google Scholar]
- 46.Zager RA, Johnson AC, Hanson SY. Proximal tubular cytochrome c efflux: determinant, and potential marker, of mitochondrial injury. Kidney Int. 2004;65:2123–2134. doi: 10.1111/j.1523-1755.2004.00638.x. [DOI] [PubMed] [Google Scholar]
- 47.Zoratti M, Szabo I. The mitochondrial permeability transition. Biochim Biophys Acta. 1995;1241:139–176. doi: 10.1016/0304-4157(95)00003-a. [DOI] [PubMed] [Google Scholar]
- 48.Zou H, Li Y, Liu X, Wang X. An APAF-1.cytochrome c multimeric complex is a functional apoptosome that activates procaspase-9. J Biol Chem. 1999;274:11549–11556. doi: 10.1074/jbc.274.17.11549. [DOI] [PubMed] [Google Scholar]