

Abstract
Recognition of DNA double-strand breaks during non-homologous end joining is carried out by the Ku70–Ku80 protein, a 150 kDa heterodimer that recruits the DNA repair kinase DNA-dependent protein kinase catalytic subunit (DNA-PKcs) to the lesion. The atomic structure of a truncated Ku70–Ku80 was determined; however, the subunit-specific carboxy-terminal domain of Ku80—essential for binding to DNA-PKcs—was determined only in isolation, and the C-terminal domain of Ku70 was not resolved in its DNA-bound conformation. Both regions are conserved and mediate protein–protein interactions specific to mammals. Here, we reconstruct the three-dimensional structure of the human full-length Ku70–Ku80 dimer at 25 Å resolution, alone and in complex with DNA, by using single-particle electron microscopy. We map the C-terminal regions of both subunits, and their conformational changes after DNA and DNA-PKcs binding to define a molecular model of the functions of these domains during DNA repair in the context of full-length Ku70–Ku80 protein.
Keywords: cryo-EM, DNA-PK, Ku70, Ku80, DNA repair
Introduction
Non-homologous end joining (NHEJ) directly ligates DNA double-strand breaks (DSBs) independently of the template, and is the most prevalent DSB repair mechanism in mammalian cells (Jackson, 2002; Lees-Miller & Meek, 2003; Lieber et al, 2003). The first step during NHEJ is the specific recognition of the DNA ends at the site of the lesion. This is carried out by the Ku70–Ku80 protein, a heterodimer consisting of the two highly related subunits Ku70 (70 kDa) and Ku80 (86 kDa), which build a preformed ring that can encircle DNA (Fig 1; Doherty & Jackson, 2001; Walker et al, 2001; Downs & Jackson, 2004). Ku70–Ku80 then recruits the catalytic subunit of the DNA-dependent protein kinase catalytic subunit (DNA-PKcs) to the DNA end (Gottlieb & Jackson, 1993; West et al, 1998; Meek et al, 2004; Falck et al, 2005). The medium resolution structures of the 460 kDa DNA-PKcs kinase and its complex with Ku have been solved by cryo-electron microscopy (cryo-EM) and show that the molecule is divided into a large head that comprises the conserved carboxy-terminal domains and an extended arm assigned to the amino terminus (Rivera-Calzada et al, 2005; Spagnolo et al, 2006).
Figure 1.
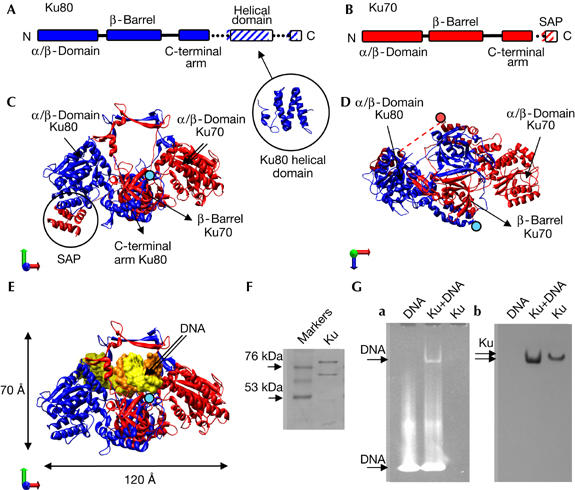
Purification of the Ku70–Ku80 dimer. (A) Schematic representation of the domain organization of Ku80. Ku80-CTD contains a helical domain (PDB 1Q2Z; Harris et al, 2004). (B) Schematic representation of Ku70. (C,D) Two views of the Ku70–Ku80 atomic structure (PDB 1JEQ; Walker et al, 2001). Ku80 and Ku70 subunits are coloured blue and red, respectively. In (D), a dotted line represents the connection between the core of Ku70 and the SAP domain, not solved in the structure. (E) Front view of the Ku-DNA atomic structure (PDB 1JEY). In (C–E), the last amino acid of each carboxy-terminal arm, from which the subunit-specific C-terminal domains emerge, is indicated with either a blue (Ku80) or a red (Ku70) filled circle. (F) SDS gel of purified Ku70–Ku80. (G) DNA interaction assay. (a) 6% native polyacrylamide gel electrophoresis gel developed with UV to show the presence of DNA. (b) Western blot of the native gel using a monoclonal antibody against Ku70. SDS, sodium dodecyl sulphate.
The atomic structure of a truncated form of the Ku70–Ku80 dimer has been determined by using X-ray crystallography (Walker et al, 2001). Both subunits show a common topology consisting of an N-terminal α/β domain, a central β-barrel domain and a helical C-terminal arm, which together form a pseudo-symmetrical structure with a preformed ring extending from a broad base (Fig 1A–D). DNA is embraced by the narrow bridge through sequence-independent interactions (Fig 1E). The ends of the C-terminal arms are located centrally in this atomic structure (Fig 1D, shown by blue and red filled circles), from which the subunit-specific C-terminal regions of each monomer emerge (Fig 1A). The 19 kDa C-terminal region of Ku80 (Ku80-CTD; residues 545–732) is implicated in the recruitment of DNA-PKcs by Ku to sites of damage, and has also been shown to interact with the Werner's syndrome protein (Gell & Jackson, 1999; Falck et al, 2005). Nuclear magnetic resonance studies of Ku80-CTD in isolation show a flat helical structure for the fragment comprising residues 592–709 (Harris et al, 2004; Zhang et al, 2004; Fig 1A), whereas the most C-terminal portion of Ku80-CTD (residues 720–732) is disordered. The Ku70-specific C-terminal region consists of a 5 kDa SAP domain (Ku70-SAP), the structure of which was determined both in isolation (Zhang et al, 2001) and as part of the Ku70–Ku80 crystal structure (Walker et al, 2001; Fig 1C). Importantly, in the DNA-bound Ku70–Ku80 crystal structure, the Ku70-SAP domain was displaced from its original position and was not resolved. SAP domains have been defined as putative DNA-binding motifs (Aravind & Koonin, 2000); therefore, this region could also have a role in DNA binding during the NHEJ reaction.
The subunit-specific C-terminal domains of Ku mediate DNA recognition and DNA-PKcs recruitment specific to mammals, and the structural basis of these processes has remained unclear in the absence of a three-dimensional (3D) structure of the full-length Ku70–Ku80. Here, a 3D structural model of the full-length Ku protein is proposed on the basis of single-particle EM experiments.
Results
Ku purification and its interaction with DNA
Ku70–Ku80 was purified from HeLa cells (Fig 1F). The ability of our preparation to form a stable complex with DNA was tested by incubation with a 54 bp oligonucleotide. We used concentrations and conditions that were identical to those used later in the EM. The complex was resolved by using native polyacrylamide gel electrophoresis, which was first incubated with ethidium bromide to show the presence of DNA (Fig 1Ga), followed by immunoblotting with a monoclonal antibody specific for the Ku70 subunit (Fig 1Gb). A faster migrating band is detected both by the antibody and the ethidium bromide, and indicates that under these conditions we can assemble a homogenous DNA-bound Ku complex as there is only one band after incubation with DNA.
EM and 3D structure of full-length Ku70–Ku80
Ku molecules were clearly seen in negatively stained electron micrographs (Fig 2A, indicated by asterisks) with some single-molecule images being strongly evocative of the typical view of Ku (Fig 2A,B, within a red square). A total of 3,419 images were subjected to iterative angular refinement using a strategy defined to avoid any influence of our previous knowledge of the atomic structures (supplementary information online), which resulted in a 3D reconstruction at a resolution of approximately 25 Å (at a Fourier shell correlation of 0.5; Fig 2E–G, top row; supplementary Movie S1 online). Projections and averages at the final step of refinement (Fig 2C) were consistent with averages derived from the initial data set using reference-free classification and 2D averaging methods implemented in EMAN (Electron Micrograph Analysis; Ludtke et al, 1999) and XMIPP (X-windows-based microscopy image processing package; Sorzano et al, 2004; Fig 2D).
Figure 2.
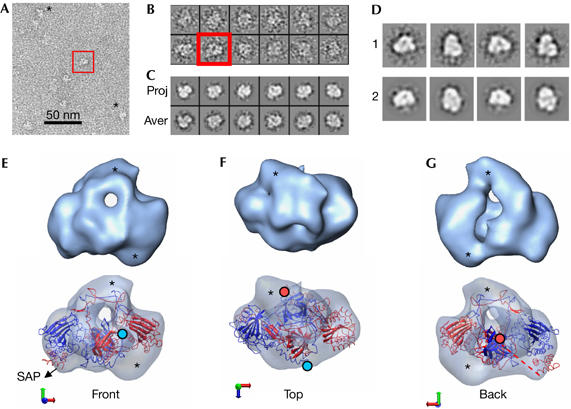
Three-dimensional structure of full-length Ku70–Ku80. (A) Electron microscopy field of negatively stained Ku70–Ku80 dimers. Some molecules are indicated with asterisks. (B) Gallery containing a representative collection of single molecules. (A,B) A view evocative of the atomic structure of Ku is shown within a red square. (C) Panel containing projections (upper row) and their corresponding class averages (lower row) obtained after image refinement. (D) Galley of reference-free two-dimensional averages obtained using EMAN and XMIPP (1) compared with projections derived by angular refinement (2). (E–G) Views of the three-dimensional reconstruction of Ku (upper row) and their corresponding fitting of the atomic structure of Ku (PDB file 1JEQ; lower row). Ku80 and Ku70 are coloured blue and red, respectively. The last amino acid of each carboxyl-terminal arm, from which the subunit-specific C-terminal domains emerge, is indicated with either a blue (Ku80) or a red (Ku70) filled circle. Densities in the reconstruction that are not accounted for by the atomic structure are highlighted with asterisks.
The homogeneity and consistency of the EM reconstructions in this work was further evaluated by using several approaches: (i) a number of volumes were used as starting references for angular refinement and all of these converged to the same solution (ii) regions of high variance within the 3D reconstructions calculated using a bootstrap technique of sampling (Penczek et al, 2006) were found to be very limited (supplementary Fig S1 online); and (iii) we employed the random conical tilt (RCT) method (Radermacher, 1988) on typical views. Internal consistency of the reconstructions defined by angular refinement was supported by their similarity to the RCT volumes, which were constructed from tilted data not used in the reconstruction using EMAN (supplementary Fig S2 online). These results support that the reconstructed volume is coherent with the input data and that the methodology used has probably minimized the effects of distortions caused by the staining agent at the particles in the 3D reconstruction.
The reconstructed volume contains the general features found in the atomic structure of the core dimer, with an obvious hole underneath a narrow bridge of density (Fig 2E). However, there are other masses evident at the main axis and also at the back of the hole (see asterisks in Fig 2E–G), which break the symmetry of the structure. As information on atomic resolution is available for much of the Ku molecule, although in several pieces (Fig 1), we fitted the structure of the crystallized dimer in the absence of DNA but containing the SAP domain (Walker et al, 2001) into the EM density maps using SITUS (Chacon & Wriggers, 2002). The top solution shows an excellent agreement between the low- and high-resolution structures (cross-correlation value of 0.66), substantiating the quality of our map and defining the correct handedness (Fig 2E–G, bottom row; supplementary Movie S2 and supplementary Fig S3 online). The characteristic ring and elongated shape of the Ku molecule, plus the presence of the SAP domain limit the number of acceptable solutions during the fitting. The density of the SAP domain was clearly present in our reconstruction and, significantly, a region in our map was not accounted for by the atomic structure and was therefore considered as the likely position of Ku80-CTD (Fig 2E–G, indicated by asterisks).
3D structure of Ku70–Ku80 complexed with DNA
Ku70–Ku80 was incubated with a 54 bp oligonucleotide under conditions in which all the protein was bound to DNA (Fig 1G), and then observed using an electron microscope (Fig 3A). A total of 8,285 particles were extracted from the micrographs (Fig 3B) and the images were processed, as stated above into a structure, with a resolution of approximately 25Å, which shows substantial conformational changes (Fig 3D–F, top row; supplementary Movie S3 online). To confirm these rearrangements, the reconstructions of Ku and DNA-Ku were used as input references of the DNA-bound and DNA free data sets respectively, which nonetheless refined to the correct final structure. We fitted the crystal structure of DNA-bound Ku into the EM map of the full-length DNA-Ku molecule but without the DNA (Fig 3D–F, bottom row; supplementary Fig S4 and supplementary Movie S4 online). In the atomic structure of DNA-bound Ku (Walker et al, 2001), the SAP domain moves from its position in the apo-structure but is not resolved in the DNA-bound complex. Our EM reconstruction fits this atomic structure well (cross-correlation value of 0.75) and confirms this displacement of the SAP domain (Fig 3D). However, in the EM reconstruction, there is some additional density that is not accounted for by the atomic structure (Fig 3D–F, asterisks). Furthermore, the hole beneath the bridge, which is responsible for encircling DNA, now shows some density.
Figure 3.
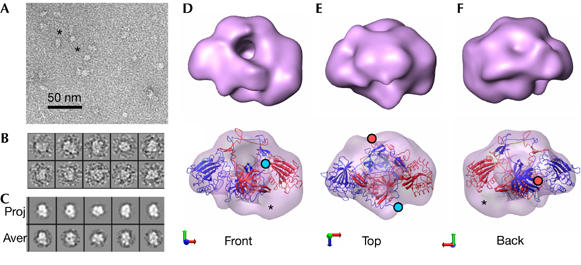
Three-dimensional structure of full-length DNA-bound Ku70–Ku80 complex. (A) Electron microscopy field of negatively stained DNA-Ku complexes. Some particles are indicated with asterisks. (B) Gallery of representative single molecules. (C) Panel containing projections (upper row) and their corresponding class averages (lower row) obtained after refinement. (D–F) Views of the DNA-Ku reconstruction (upper row) and the fitting of the atomic structure of DNA-bound Ku (PDB file 1JEY; lower row). Ku80 and Ku70 are colored blue and red, respectively. The last amino acid of each carboxyl-terminal arm, from which the subunit-specific C-terminal domain emerge, is indicated with either a blue (Ku80) or a red (Ku70) filled circle. Densities in the reconstruction that are not accounted for by the atomic structure are indicated with asterisks.
Mapping of Ku70-SAP and Ku80-CTD
To locate the subunit-specific Ku70-SAP and Ku80-CTD in the full-length Ku70–Ku80, we calculated difference maps between the reconstructions and their corresponding fitted atomic structures (Fig 4, differences are shown in yellow). This approach seems to be supported by the consistency of our reconstructions (supplementary Figs S1,S2 online) and their close resemblance with the atomic information of Ku despite this not being used during refinement. In addition, the observed displacement of the SAP domain matches that found by X-ray crystallography, further supporting our reconstructions. Consequently, difference mapping showed only a few regions that possibly correspond to the missing C-terminal domains.
Figure 4.
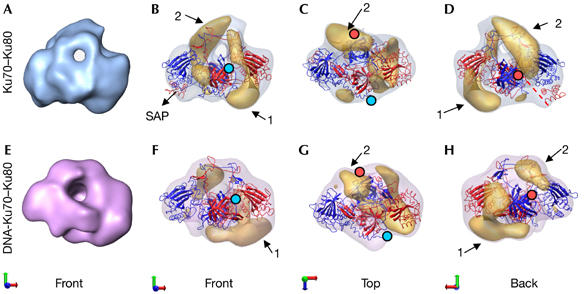
Mapping of Ku80-CTD and Ku70-CTD. (A) Front view of the Ku volume. (B–D) Reconstruction of Ku70–Ku80, in which densities shown by difference mapping are in yellow. (E) Front view of the DNA-Ku reconstruction. (F–H) DNA-bound Ku70–Ku80 with difference map in yellow. Ku80 and Ku70 are coloured blue and red, respectively. The last amino acid of each carboxyl-terminal arm, from which the subunit-specific C-terminal domains emerge, is indicated with either a blue (Ku80) or a red (Ku70) filled circle.
In the DNA-free protein, Ku70-SAP maps to one side, as seen in the atomic structure, and the additional densities that are not occupied by the atomic structure probably enclose the linker segments and the missing Ku80-CTD domain (Fig 4B–D, arrows 1 and 2). Putative density for Ku80-CTD is present underneath the base beside the α/β domain of the Ku70 subunit (Fig 4B–D, arrow 1) and also in the back of the ring and slightly protruding from the top (Fig 4B–D, arrow 2). Ku80-CTD contains a helical domain connected by a flexible linker to the core domain of Ku, and followed by a C-terminal region, which is implicated in DNA-PKcs recruitment (Gell & Jackson, 1999; Fig 1A). Either of the regions of unoccupied density (Fig 4B–D, arrows 1 and 2) could accommodate this helical domain, and the combination of both regions is sufficient to account for the whole Ku80-CTD. Nevertheless, the NMR structures of the helical domain in Ku80-CTD were better fitted in the region under the α/β domain of the Ku70 subunit (Fig 4B,D, arrow 1), which, together with its proximity to the C-terminal end of Ku80 at the core domains (Fig 4B,C, blue filled circle), allows us to assign this region speculatively to the helical domain. The second additional region placed proximal to the ring might correspond to the most C-terminal portion to Ku80-CTD implicated in DNA-PKcs recruitment (Fig 4B–D, arrow 2).
Similar difference mapping analyses were carried out with the DNA-bound conformation (Fig 4E–H), showing densities under the α/β domain of the Ku70 subunit in a similar orientation to that described previously in the DNA-free density (Fig 4B–D, arrow 1). Additional material was evident at the level of the hole, but here it was more compact and packed against the core domains (Fig 4G,H, arrow 2). These observations indicate that Ku80-CTD remains at a similar position after DNA binding but is probably affected by some changes in conformation. The largest change occurs to the SAP domain, which is in contact with the α/β domain of Ku80 in the absence of DNA, a location found unoccupied after DNA binding. The atomic structure of DNA-bound Ku shows a similar change and Walker et al indicate that the domain could have moved to regions in contact with the DNA present in the structure (Walker et al, 2001). Those regions are located at the side of the Ku ring opposed to the free end of the DNA, facing the continuous DNA molecule; therefore, Ku70-SAP could be implicated in the maintenance of interactions between DNA and Ku. In our difference map, densities that might accommodate the displaced SAP domain could not be mapped owing to its small size.
Model of recruitment of DNA-PKcs by DNA-Ku
In the 3D structure of the DNA-PKcs–Ku complex (Spagnolo et al, 2006), Ku sits on the top of the palm domain of DNA-PKcs in a defined orientation that allows the DNA to follow a continuous channel formed by Ku and the cavity in DNA-PKcs (Fig 5A). We compared the structure of DNA-bound Ku with that after the recruitment of DNA-PKcs to explore the conformational changes that might occur in full-length Ku70–Ku80 on forming a complex with DNA-PKcs. We fitted the reconstruction of DNA-bound Ku into the DNA-PKcs–Ku complex, by matching the orientation of the core domains of DNA-Ku shown after fitting (Fig 3), with the position of the core domains of Ku in the DNA-PKcs–Ku complex (Spagnolo et al, 2006; Fig 5B). This fitting shows directly (Fig 5B) and after calculating a difference map (Fig 5C), that the Ku80-CTD present in DNA-Ku underneath the base is missing in the corresponding position after formation of the complex with DNA-PKcs. As this region is essential for the interaction with DNA-PKcs, the Ku80-CTD domain has probably dislocated and it is likely to be now situated in the density of the complex. Tentatively, we searched for possible locations; visual inspection showed an area of protein density in the DNA-PKcs–Ku complex that was not found in isolated DNA-PKcs (Rivera-Calzada et al, 2005) and that might therefore be very cautiously attributed to this domain (Fig 5A, dotted circle).
Figure 5.

Model of domain rearrangements in full-length Ku70–Ku80 on DNA and DNA-dependent protein kinase catalytic subunit recognition. (A) Two views of the DNA-PKcs–Ku complex (grey density), in which the atomic structure of Ku has been fitted (Spagnolo et al, 2006). (B) Three-dimensional reconstruction of DNA-Ku (purple density) fitted with the DNA-PKcs–Ku complex and positioned in an orientation equivalent to that found for Ku in the complex. (C) Difference map between the reconstructions of DNA-Ku and the DNA-PKcs–Ku complex shown in blue. (D) Schematic model of the domain movements described in full-length Ku70–Ku80 after DNA interaction and DNA-PKcs recruitment. DNA is in yellow. Ku80 an Ku70 are coloured blue and red, respectively. DNA-PKcs, DNA-dependent protein kinase catalytic subunit.
Discussion
We propose a structural model of the functions of the subunit-specific C-terminal domains in the context of the full-length Ku70–Ku80 protein (Fig 5D). The Ku70-SAP domain changes its position on DNA binding from the base of the α/β domain of Ku80 to a position that might be proximal to the ring in the side of Ku that faces the continuous DNA. At this site, the SAP domain may be in contact with the DNA, possibly acting to stabilize Ku binding at the end of the break and favouring its interaction with DNA-PKcs. By contrast, Ku80-CTD undergoes a substantial displacement only when DNA-PKcs is recruited, detaching from the Ku core to interact with DNA-PKcs. The length of the linker between the Ku80 core and the helical domain of Ku80-CTD would certainly allow such a displacement. As Ku and DNA-PKcs do not associate in the absence of DNA—whereas Ku80-CTD is sufficient to interact with DNA-PKcs—it is likely that the displacement of Ku80-CTD contributes to stabilizing the interaction. Such a mechanism would ensure that the DNA-PKcs–Ku repair complex assembles only at the site of the lesion. It has also been recently reported that Ku80-CTD can dissociate a DNA-PKcs–Artemis complex (Drouet et al, 2006). Our structure would suggest that the displacement of Ku80-CTD on DNA-PKcs binding could potentially remove Artemis by competition.
Methods
Purification of the Ku70/Ku80 dimer. Ku70 and Ku80 were purified from the HeLa nuclear extract (CilBiotech, Mons, Belgium) by using a combination of heparin, double-stranded DNA cellulose, phenyl sepharose high resolution and monoQ chromatographies.
DNA interaction assay. A 54 bp blunt-ended double-stranded DNA was constructed by annealing two FPLC-purified complementary 54-base oligonucleotides (5′-biotGGCCGCACGCGTCCACCATGGGGTACAACT ACGATCTAGCTTCATGCACCGGAC-3′; Oswell, Southampton, UK). Then, 2 μl of purified Ku (0.45 μM), an approximately tenfold molar excess of 3.7 μM DNA (4 μl) and 1 μl of buffer (50 mM Tris pH 7.5, 20% glycerol, 1 mM MgCl2, 50 mM KCl, 10 mM EDTA) were incubated at 25°C for 20 min. A 6% native polyacrylamide gel electrophoresis gel was run at 4°C in Tris-glycine buffer, incubated with ethidium bromide and developed with UV. After washing, the gel was subjected to immunoblotting with a polyvinyl difluoride membrane (Bio-Rad Laboratories, Hercules, CA, USA) with a monoclonal anti-Ku70 (2C3.11, ab87; Abcam, Cambridge, UK) followed by a horseradish peroxidase-conjugated secondary antibody (ab6728; Abcam).
Electron microscopy and image processing. A few microlitres of the purified Ku and the DNA-bound complexes were adsorbed to glow discharged carbon-coated grids and negatively stained using 1% uranyl acetate. The grids were observed in a JEOL 1230 operated at 100 kV. Micrographs were taken at × 50,000 magnification under low-dose conditions and digitized at a final 10 μm step size. Particles from the micrographs were extracted, normalized, centred, filtered and refined using different commands found in the EMAN (Ludtke et al, 1999). A total of 3,419 particles for Ku and 8,285 for the DNA-containing protein were collected. The resolution was estimated at approximately 25 Å for both reconstructions by Fourier shell correlation using the eotest command and a correlation of 0.5. The density maps and the atomic structures were visualized with University of California, San Francisco Chimera (Pettersen et al, 2004). In addition, pairs of micrographs were obtained and processed according to the RCT method and using the XMIPP platform (Sorzano et al, 2004). 3D variance was estimated using a bootstrap technique of sampling as proposed by Penczek et al (2006) with SPIDER (Frank et al, 1996; supplementary information online).
Fitting atomic structures into the EM volumes and calculation of difference maps. Fitting was carried out using files from the Protein Data Bank (1JEY and 1JEQ) by a six-dimensional search using colores (Chacon & Wriggers, 2002) from the software SITUS. Fittings were performed using both possible hands in the volumes and it was found that one hand allowed the most adequate fitting. To calculate the difference maps between the fitted atomic structures and the EM density, the atomic structures were converted to density maps at comparable resolution. The EM maps of the Ku70–Ku80 dimer have been deposited in the 3D EM database (http://www.ebi.ac.uk/msd/) under accession codes EMD-1270 (Ku70–Ku80) and EMD-1271 (DNA-bound Ku70–Ku80).
Supplementary information is available at EMBO reports online (http://www.emboreports.org).
Supplementary Material
Supplementary Movie S1
Supplementary Movie S2
Supplementary Movie S3
Supplementary Movie S4
Supplementary Information
Acknowledgments
We thank P. Penczek (The University of Texas, Houston) for providing batches and help with the estimation of 3D variance. This work was supported by projects SAF2002-01715, SAF2005-00775 and GEN2003-20239-C06-06 from the Spanish Ministry of Education and Science (O.L.) and a Programme grant from Cancer Research UK (L.H.P.). A.R.C. is supported by an Itinerario Integrado De Insercion Profesional PhD fellowship from the Spanish National Research Council (CSIC) and the European Social Fund.
References
- Aravind L, Koonin EV (2000) SAP—a putative DNA-binding motif involved in chromosomal organization. Trends Biochem Sci 25: 112–114 [DOI] [PubMed] [Google Scholar]
- Chacon P, Wriggers W (2002) Multi-resolution contour-based fitting of macromolecular structures. J Mol Biol 317: 375–384 [DOI] [PubMed] [Google Scholar]
- Doherty AJ, Jackson SP (2001) DNA repair: how Ku makes ends meet. Curr Biol 11: R920–R924 [DOI] [PubMed] [Google Scholar]
- Downs JA, Jackson SP (2004) A means to a DNA end: the many roles of Ku. Nat Rev Mol Cell Biol 5: 367–378 [DOI] [PubMed] [Google Scholar]
- Drouet J, Frit P, Delteil C, de Villartay JP, Salles B, Calsou P (2006) Interplay between Ku, artemis and DNA-PKcs at DNA ends. J Biol Chem 281: 27784–27793 [DOI] [PubMed] [Google Scholar]
- Falck J, Coates J, Jackson SP (2005) Conserved modes of recruitment of ATM, ATR and DNA-PKcs to sites of DNA damage. Nature 434: 605–611 [DOI] [PubMed] [Google Scholar]
- Frank J, Radermacher M, Penczek P, Zhu J, Li Y, Ladjadj M, Leith A (1996) SPIDER and WEB: processing and visualization of images in 3D electron microscopy and related fields. J Struct Biol 116: 190–199 [DOI] [PubMed] [Google Scholar]
- Gell D, Jackson SP (1999) Mapping of protein–protein interactions within the DNA-dependent protein kinase complex. Nucleic Acids Res 27: 3494–3502 [DOI] [PMC free article] [PubMed] [Google Scholar]
- Gottlieb TM, Jackson SP (1993) The DNA-dependent protein kinase: requirement for DNA ends and association with Ku antigen. Cell 72: 131–142 [DOI] [PubMed] [Google Scholar]
- Harris R, Esposito D, Sankar A, Maman JD, Hinks JA, Pearl LH, Driscoll PC (2004) The 3D solution structure of the C-terminal region of Ku86 (Ku86CTR). J Mol Biol 335: 573–582 [DOI] [PubMed] [Google Scholar]
- Jackson SP (2002) Sensing and repairing DNA double-strand breaks. Carcinogenesis 23: 687–696 [DOI] [PubMed] [Google Scholar]
- Lees-Miller SP, Meek K (2003) Repair of DNA double strand breaks by non-homologous end joining. Biochimie 85: 1161–1173 [DOI] [PubMed] [Google Scholar]
- Lieber MR, Ma Y, Pannicke U, Schwarz K (2003) Mechanism and regulation of human non-homologous DNA end-joining. Nat Rev Mol Cell Biol 4: 712–720 [DOI] [PubMed] [Google Scholar]
- Ludtke SJ, Baldwin PR, Chiu W (1999) EMAN: semiautomated software for high-resolution single-particle reconstructions. J Struct Biol 128: 82–97 [DOI] [PubMed] [Google Scholar]
- Meek K, Gupta S, Ramsden DA, Lees-Miller SP (2004) The DNA-dependent protein kinase: the director at the end. Immunol Rev 200: 132–141 [DOI] [PubMed] [Google Scholar]
- Penczek PA, Yang C, Frank J, Spahn CM (2006) Estimation of variance in single-particle reconstruction using the bootstrap technique. J Struct Biol 154: 168–183 [DOI] [PubMed] [Google Scholar]
- Pettersen EF, Goddard TD, Huang CC, Couch GS, Greenblatt DM, Meng EC, Ferrin TE (2004) UCSF Chimera—a visualization system for exploratory research and analysis. J Comput Chem 25: 1605–1612 [DOI] [PubMed] [Google Scholar]
- Radermacher M (1988) Three-dimensional reconstruction of single particles from random and nonrandom tilt series. J Electron Microsc Tech 9: 359–394 [DOI] [PubMed] [Google Scholar]
- Rivera-Calzada A, Maman JD, Spagnolo L, Pearl LH, Llorca O (2005) Three-dimensional structure and regulation of the DNA-dependent protein kinase catalytic subunit (DNA-PKcs). Structure 13: 243–255 [DOI] [PubMed] [Google Scholar]
- Sorzano CO, Marabini R, Velazquez-Muriel J, Bilbao-Castro JR, Scheres SH, Carazo JM, Pascual-Montano A (2004) XMIPP: a new generation of an open-source image processing package for electron microscopy. J Struct Biol 148: 194–204 [DOI] [PubMed] [Google Scholar]
- Spagnolo L, Rivera-Calzada A, Pearl LH, Llorca O (2006) Three-dimensional structure of the human DNA-PKcs/Ku70/Ku80 complex assembled on DNA and its implications for DNA DSB repair. Mol Cell 22: 511–519 [DOI] [PubMed] [Google Scholar]
- Walker JR, Corpina RA, Goldberg J (2001) Structure of the Ku heterodimer bound to DNA and its implications for double-strand break repair. Nature 412: 607–614 [DOI] [PubMed] [Google Scholar]
- West RB, Yaneva M, Lieber MR (1998) Productive and nonproductive complexes of Ku and DNA-dependent protein kinase at DNA termini. Mol Cell Biol 18: 5908–5920 [DOI] [PMC free article] [PubMed] [Google Scholar]
- Zhang Z, Zhu L, Lin D, Chen F, Chen DJ, Chen Y (2001) The three-dimensional structure of the C-terminal DNA-binding domain of human Ku70. J Biol Chem 276: 38231–38236 [DOI] [PubMed] [Google Scholar]
- Zhang Z, Hu W, Cano L, Lee TD, Chen DJ, Chen Y (2004) Solution structure of the C-terminal domain of Ku80 suggests important sites for protein–protein interactions. Structure 12: 495–502 [DOI] [PubMed] [Google Scholar]
Associated Data
This section collects any data citations, data availability statements, or supplementary materials included in this article.
Supplementary Materials
Supplementary Movie S1
Supplementary Movie S2
Supplementary Movie S3
Supplementary Movie S4
Supplementary Information