Abstract
Recordings have been made from 127 single muscle spindle afferents from the longissimus lumborum muscles of anaesthetized cats. They have been characterized by their responses to passive muscle stretch and the effects of succinylcholine (SCh) and by their sensitivity to vibration. The use of SCh permitted the assessment for each afferent of the influence of bag1 (b1) and bag2 (b2) intrafusal muscle fibres. From this, on the assumption that all afferents were affected by chain (c) fibres, they were classified in four groups: b1b2c (41.9%), b2c (51.4%), b1c (1.3%) and c (5.4%). All the afferents with b1 influence were able to respond one to one to vibration at frequencies above 100 Hz and were considered to belong to primary endings. On the basis of the vibration test, 64% of the b2c type afferents appeared to be primaries and 36% secondaries. Of the units classified as primaries, 41% were designated as b2c and would not therefore be able to respond to dynamic fusimotor activity. The significance of this relatively high proportion of b2c-type spindle primary afferents is discussed in relation to the specialized postural function of the back muscles.
The bony vertebral column is an anatomically complex support for the whole body, which works effectively for this purpose through the balanced action of the many specialized muscles connecting its components together. The mechanisms by which this balanced action is achieved are likely to differ to some extent from those found in the limbs, because the spine must form a strong supporting pillar, with some conflict between the need for flexibility and the need for stability. Study of the control of spinal muscles has advanced very little compared with that of the limb muscles. This is perhaps due partly to the belief that the back muscles are not as important as the limb muscles in everyday activities, but also to the practical difficulties of carrying out on them the sort of neurophysiological studies which have been successful in the case of the limb muscles.
For reasons of technical convenience, most definitive studies on proprioceptors have used limb muscles, mainly from the cat hindlimb, though there have been some studies of spindle physiological properties in dorsal neck muscles (Richmond & Abrahams, 1979). Despite the very high density of spindles in this region and the fact that about a third of them contain only a single bag intrafusal fibre instead of two, their responses to passive stretch were not thought to be in any way unusual. This, however, was in the absence of any fusimotor activity and Price & Dutia (1987) were able to show later, by the use of succinylcholine, that the single bag fibre spindles were of the b2c type, i.e. their primary afferent endings contacted only bag2 and chain fibres and therefore could not respond to dynamic fusimotor excitation, which requires the additional presence of a bag1 intrafusal fibre. In a brief report of spindle function in cat back muscles Carlson (1978) recorded spindle-like responses from lumbar dorsal roots evoked by stretching the longissimus lumborum muscle. The afferent activity was not further identified and no detailed examination of unitary firing was made. More recently, a method has been described for recording the reponses of single spindle afferents from multifidus or longissimus muscles (Pickar, 1999; Ge et al. 2005). Muscles were stretched by applying forces in various directions to one vertebra and consequently the actual muscle length changes were not clearly defined. The aim of the present study was to identify physiologically single muscle spindle afferents from the longissimus lumborum muscle, the individual heads of which can be isolated and stretched in a well controlled fashion. The spindle afferents were then characterized as primary or secondary first according to their behaviour to muscle stretch and vibration and second, according to their intrafusal muscle fibre innervation by using succinylcholine (SCh), which mimics fusimotor activity through contracture of the bag1 (b1) and bag2 (b2) intrafusal muscle fibres (Gladden, 1976; Dutia, 1980; Price & Dutia, 1987; Taylor et al. 1992a,b). The data so obtained are important for subsequent investigation of the central synaptic projections of the spindles. A preliminary report has been presented in abstract form (Taylor et al. 2000).
Methods
All experiments were carried out in full accordance with the United Kingdom (Scientific Procedures) Animal Act of 1986. Female cats were used in the weight range 2.3–3.5 kg. Animals were fully anaesthetized throughout with sodium pentobarbitone (60 mg kg−1). In the initial experiments, induction was by this dose given intraperitoneally, followed by supplements of 12 mg kg−1 in 1 ml 0.9% saline i.v. In later experiments induction was by halothane vapour (5% in 10 l min−1 of 50% nitrous oxide and 50% oxygen delivered into a 30 l box) and followed by pentobarbitone given i.v. as above. The trachea was cannulated, the right carotid artery was cannulated for BP recording and the right jugular vein was cannulated for the delivery of drugs. The level of anaesthesia was monitored by arterial BP, respiration, end-tidal PCO2, pupillary diameter and depression of reflex responses. Rectal temperature and muscle temperature were monitored and maintained at 36–38°C by means of a heating blanket and radiant heat. The animals were killed by an intravenous overdose with pentobarbitone at the end of the experiment.
Preparation of muscle heads and spindle afferents
A midline incision was made along the length of the back and the lumbar fascia was opened and the iliocaudalis muscle removed. Multifidus muscles were carefully separated and removed from the vertebrae to expose the points of emergence of the segmental spinal nerves. Threads were tied around the tendons of up to five heads of the longissimus lumborum muscle on the left side, which were then carefully detached from their insertions on the vertebral accessory processes. The threads were individually attached to an electromagnetic servo which applied controlled stretches to the muscle heads. Nerve branches to other muscles not being studied and cutaneous input from the same side of the body were cut to reduce afferent input. A laminectomy was performed over several segments, usually L1–L5, to expose the dorsal roots and ganglia supplying the muscle heads of interest. A skin pool was formed and filled with 2.25% agar in normal saline at 39°C. Once this had set, part was removed to expose the muscles and the laminectomy and the cavity filled with paraffin oil, which was maintained at 37°C. In the earlier experiments, dorsal rootlets were cut and split to obtain recordings from single afferents responding to muscle stretch. In this way several (up to six) single afferents could be recorded simultaneously to speed up the tests. In the later experiments, single afferents were recorded using glass-coated tungsten microelectrodes. Electrodes, constructed as described by Merrill & Ainsworth (1972), were shortened to 8 mm and a 20 mm length of 50 µm diameter silver wire was wound around the bared shaft and secured with silver loaded resin. This microwire provided a light and flexible connection to the AC preamplifier. Large, well-isolated afferent spikes were readily recorded by simply placing the electrode tip lightly on a dorsal root close to the spinal cord. Usually only a single afferent was recorded at a time in this fashion, but the advantage was that single units could be isolated very quickly and the axon concerned remained in continuity, as was required for related studies of central projections to the spinal cord (Taylor et al. 2004).
Identification of afferents
Muscle spindle afferents were distinguished from Golgi tendon organ (GTO) afferents by their response to muscle twitches. Since the procedure of implanting stimulating electrodes around the fine muscle nerve branches had the potential to damage them, it was used in very few of the experiments. As an alternative, the muscles were stimulated by pairs of silver wires inserted in the muscle spaced 10 mm apart. It is evident from other studies of back muscles that conduction velocity is not a reliable means of distinguishing primary and secondary spindle afferents (Ge et al. 2005). The alternative criteria are their different sensitivities to vibration (see Brown et al. 1967) and the distinct effects of SCh. In the first half of the study muscle vibration was applied by means of a large 128 Hz tuning fork placed on the thread close to the muscle. Later, vibration was applied via the electromagnetic servo puller. The frequency of muscle vibration could be varied using an oscillator to determine the maximum frequency at which the afferent could respond 1 : 1.
Before testing with SCh care was taken to see that the level of anaesthesia was adequately deep, and provision was made for artificial ventilation. It was assumed that fusimotor activity would be suppressed by the anaesthetic. Each individual muscle head was set to the length at which slack was just taken up and ramp and hold stretches of 2.0 mm were applied from this point. Stretches were repeated regularly at 5.8 s intervals with the rise lasting 0.8 s, the plateau of stretch lasting 1.7 s and the fall 1 s. Before testing the afferents with SCh, the blood flow to the muscles was increased by stimulating the muscle supramaximally for contraction at 10 Hz for 30 s. Afferent responses to five control ramp stretches were recorded prior to a standardized dose of SCh (200 µg kg−1 ml−1; 1 ml injected i.v.) and continuously for 200–300 s thereafter.
Data recording, display and analysis
Muscle spindle afferent spikes were selected by window discriminators and their times of occurrence stored using the CED 1401-plus interface with the Spike 2 for Windows processing package (Cambridge Electronic Design, Cambridge, UK). These signals were displayed on the screen as instantaneous frequency in real time, which provides a good means of detecting any false triggering. During vibration the timing of the zero crossing of the vibration oscillator was also stored. In addition, ramp displacements were recorded, sampled at 100 Hz, and a marker placed 0.5 s prior to stretch was also stored, to allow for alignment of stretches for analysis. The data were analysed off-line using scripts written in-house for the Spike 2 system.
Quantitative assessment of afferent response to stretch
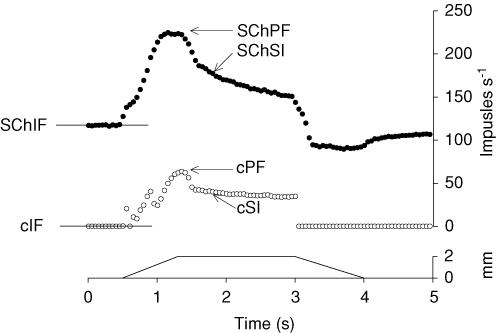
A convenient scheme for describing responses to cyclically repeating ramp-and-hold stretches was used as previously described (Taylor et al. 1992a,b) and is illustrated in Fig. 1. Measurements were made from averages of five stretch cycles. The use of stretches continuously cycling every 5.8 s avoided the occurrence of initial bursts (Proske & Gregory, 1977; Haftel et al. 2004). The afferent frequency in the 0.5-s period immediately before each stretch commences is known as the initial frequency (IF). The maximal response to stretch is given by the peak frequency (PF) at the end of the stretching phase. There is an adaptation of the discharge frequency to a value called the static index (SI) 0.5 s after the end of stretch. The maximal response to stretch is the dynamic difference (DD) given by PF − IF. The adaptation is measured by the difference PF − SI and referred to as the dynamic index (DI; Crowe & Matthews, 1964). The maintained response to stretch is called the static difference (SD) given by SI − IF. In this study we concentrated on the values of IF and DD and in the control and test conditions using SCh, and these variables are prefixed by ‘c’ and ‘SCh’, respectively. To characterize changes caused by the SCh it is convenient to take the changes in the above values, symbolized by the prefix Δ. Thus, e.g. ΔDD is DD during SCh testing minus control DD (SChDD − cDD; Taylor et al. 1992a,b). In measuring the SCh responses, averages were computed for five stretch cycles selected to include the periods of maximum increase in IF and DD.
Figure 1. Explanation of the measures of the response of spindle afferents to ramp-and-hold stretch and the effect of succinylcholine.
Lowermost record: the ramp-and-hold stretch waveform. Middle: cycle average frequency of spindle afferent under control conditions. Upper: response of the same afferent in the presence of SCh. Responses to 5 cycles have been averaged. Labelling of the records is explained in the text.
Results
In total, 127 muscle spindle afferents were recorded from the longissimus lumborum muscle in 19 cats. Of these we were able to make control measurements to ramp-and-hold stretches in 119 cases. Seventy-four afferents were then tested in the presence of SCh. Vibration testing was performed on 110 afferents out of the 127 recorded. In 61 cases this was with the tuning fork and in 49 cases it was with vibration applied through the servo-controlled puller.
Response of afferents to SCh and to vibration testing
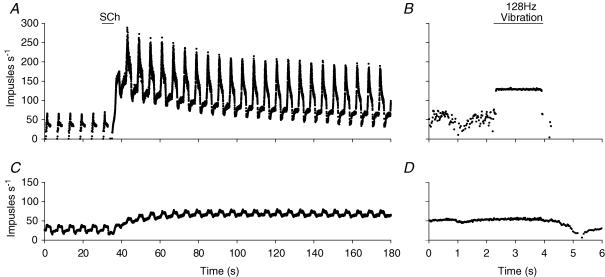
Figure 2A and C shows examples of the effect of SCh on the responses to ramp-and-hold stretches of two afferents recorded at the same time. Throughout the records the stretches (not shown) were applied regularly every 5.8 s and the SCh injected i.v. after a 30 s control period (indicated by horizontal line in panel A). In the control period, the afferent in Fig. 2A had no resting discharge between successive ramp and hold stretches (IF = 0). During the ramp stretch afferent discharge increased rapidly to a maximum (PF) of 65 impulses s−1 for each of the ramps prior to the application of SCh. During the hold phase, the afferent discharge decayed rapidly initially then at a slower rate to a value of approximately 45 impulses s−1. At the release of stretch, the afferent discharge fell silent. After intravenous injection of SCh, there was a rapid increase in IF to a maximum of 150 impulses s−1 followed by a gradual fall to 75 impulses s−1 by 180 s. Accompanying the increase in IF was a large increase in dynamic sensitivity to stretch, as measured by DD (= PF − IF).
Figure 2. The succinylcholine test and the vibration test illustrated for two spindle afferents.
A and C show the effect of SCh injection (200 µg kg−1i.v.) on the responses of two spindle afferent units, recorded simultaneously, to repeated ramp-and-hold stretches. The injection was given after the 5th control stretch. Instantaneous frequency records. The stretches were as in Fig. 1, but are not shown. Note the increase in IF and DD in the upper unit (diagnosed as b1b2c) and the increase in IF only in the lower unit (diagnosed as b2c). B and D show the responses of the same two units to 128 Hz vibration in the absence of SCh. Only the upper unit responds to vibration. The fall in frequency after vibration at 4 s in both cases is due to release of muscle stretch rather than to some post-vibrational effect.
This increase was maintained throughout the remainder of the recording period. The other afferent (Fig. 2C) showed a different behaviour. During the control period the IF was 25 impulses s−1. With the application of stretch, the afferent discharge increased to give a PF of 45 impulses s−1, which fell in the hold phase only slightly to 40 impulses s−1. When the stretch was released the afferent discharge fell below the IF value before recovering slowly. In the presence of SCh, IF increased, reaching a maximum value of about 70 impulses s−1 at 90 s and was then maintained. There was no accompanying increase in dynamic sensitivity but actually a small reduction. It is known that SCh mimics fusimotor activation by contracture of the b1 and b2 intrafusal muscle fibres. The principal effect of contracture of the b1 fibre is to increase DD, whilst contracture of the b2 fibre increases IF (Taylor et al. 1992a,b). Thus, based on the above observations, and the assumption that all spindle afferents contact the chain (c) intrafusal fibre, we may conclude that the afferent in Fig. 2A innervated both bag fibre types, and may be called a b1b2c afferent. The afferent in Fig. 2C showed signs only of b2 intrafusal muscle fibre activation and so is identified as a b2c afferent.
As an alternative to conduction velocity as a means of distinguishing primary and secondary afferents sensitivity to vibration was assessed, because primary afferents are known to be able to follow to a higher frequency than can secondaries (Brown et al. 1967). The vibration tests are shown in Fig. 2B and D. In Fig. 2B, when a 128 Hz tuning fork was applied to the thread attached to the tendon, the afferent responded in a 1 : 1 manner, i.e. it fired at 128 impulses s−1. In contrast, the afferent in Fig. 2D showed no discernable effect upon application of the vibration. These results strongly suggest that the afferent in Fig. 2A and B (previously identified as b1b2c) was indeed a primary afferent, whilst the other (b2c afferent) was a secondary.
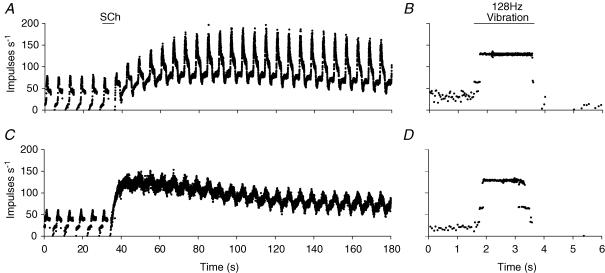
The response shown in Fig. 2A was typical for the majority of spindle Ia afferents, namely ones that have contacts with both b1 and b2 intrafusal muscle fibres. However, it is well documented that depending upon the particular muscle, between 20 and 30% of muscle spindle primary afferents lack a b1 fibre contact (Price & Dutia, 1987; Taylor et al. 1992a, b). Figure 3 shows how the use of SCh could distinguish between the two different types of primary afferent. As in Fig. 2, the first 30-s period of each record shows the afferent behaviour in control conditions and the remainder the response in the presence of SCh. In the control period the afferent in Fig. 3A had an IF value of 10 impulses s−1. During control stretches, the afferent firing increased rapidly to a PF value of 80 impulses s−1. In the hold phase, the discharge fell rapidly initially then at a slower rate to approximately 45 impulses s−1. At the release of stretch, the afferent fell silent, before recovering to its IF value. After SCh injection, IF rose gradually to 80 impulses s−1 at 90 s and fell slowly to 60 impulses s−1 by 180 s. There was also an increase in DD, which gradually reached a maximum 60 s after SCh injection and was maintained for the remainder of recording period. The afferent in Fig. 3C showed a different behaviour. The control IF was 25 impulses s−1 and the PF was 60 impulses s−1. In the hold phase the afferent discharge showed a small rapid fall followed by a slow decay to a value of 40 impulses s−1. When the stretch was released the afferent discharge ceased briefly before recovering slowly to the IF value. In the presence of SCh there was a rapid increase to 120 impulses s−1, maintained for two stretch cycles before falling gradually thereafter to a value of 75 impulses s−1 by 180 s. There was no increase in DD accompanying this increase in IF. Rather there was initially a fall followed by a gradual return to control values. Figure 3B and D shows that both afferents followed the 128 Hz tuning fork vibration in a 1 : 1 manner. Taking the SCh and vibration observations together we conclude that the afferent in the top row (Fig. 3A and C) is a b1b2c primary afferent, whilst that in the bottom row is a b2c primary afferent.
Figure 3. The succinylcholine test and the vibration test illustrated for two further spindle afferents.
The conditions and layout of this figure are the same as for Fig. 2. Note the increase in IF and DD in A (diagnosed as b1b2c) and the increase in IF only in C (diagnosed as b2c). Both units respond to the vibration.
Population properties of the spindle afferents
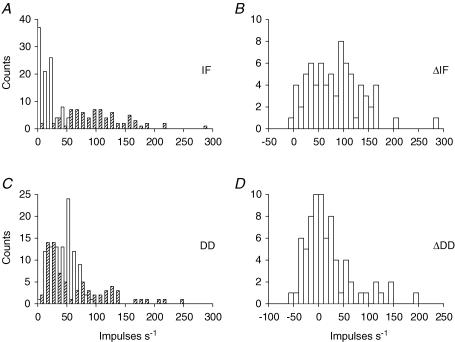
Whilst the identifications in Figs 2 and 3 appear to be reliable, considerable variation of responses was seen in the population of units studied, so that some quantitative criteria for recognizing b1 and b2 effects needed to be determined statistically. Figure 4 shows the distributions of control values of IF and DD and the effects of SCh. In Fig. 4A it is seen that the majority of afferents had control values of IF (open bars) below 25 impulses s−1 which increased in the presence of SCh (hatched bars). The changes (ΔIF) seen in Fig. 4B appear unimodally distributed and indicate widely varying strengths of the b2 effects.
Figure 4. Histograms of the values of the measures of the ramp-and-hold stretch responses and the effects of SCh.
A, values observed for IF under control conditions (open bars) and with SCh (hatched bars). B, values of ΔIF. C, control values of DD (open bars) and with SCh (hatched bars). D, values of ΔDD.
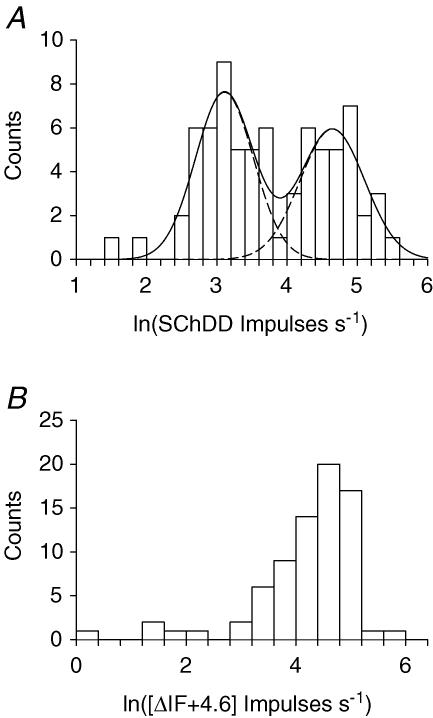
Control values of DD (Fig. 4C, open bars) extend up to 90 impulses s−1. Values of DD in the presence of SCh (hatched bars) extended up to 250 impulses s−1. The values of ΔDD (Fig. 4D) show no sign of bimodality which could be used to distinguish between those afferents which have contacts on b1 fibres and those which do not, in the way that has been demonstrated for hindlimb and jaw muscle spindles (Taylor et al. 1992a,b). The most likely reason for this difference is that many of the back muscle afferents have much higher values of control DD than would have been expected in the absence of dynamic fusimotor activity. Indeed, inspection of the records for units with small values of ΔDD showed that in a number of cases the control ramp-and-hold stretch responses were characteristic of primary afferents during dynamic gamma (γd) stimulation. It is possible therefore that, though the level of anaesthesia was sufficient to remove withdrawal, pinna and corneal reflexes it was sometimes not sufficient to suppress natural tonic γd activity. This would raise the control value of DD and therefore the full potential for SCh to increase DD could not be revealed. A similar observation has been reported for intercostal muscle spindles (Taylor & Durbaba, 1996). In support of this idea is the unexpectedly large number of values of cDD in the range of 50–60 impulses s−1, which were not seen in the hindlimb and jaw spindles. As a means of dealing with this problem, the maximum values of DD following SCh dosage (SChDD) have been examined rather than the ΔDD values. The plot of the values of SChDD (Fig. 4C, hatched bars), suggests that they are bimodally distributed with a division at 50–60 impulses s−1. The distribution of values of SChDD is replotted in Fig. 5 in logarithmic form, as this proved advantageous for the distribution of ΔDD values in studies of jaw and hindlimb spindles (Taylor et al. 1992a,b). The logarithmic distribution now shows clear signs of bimodality, emphasized by the fitting with two normal distributions. There is only a slight overlapping of the two curves and the best dividing point is 3.9 which corresponds to a value of 50 impulses s−1 for the maximum DD value in the presence of SCh. Thus, those afferents with SChDD > 50 impulses s−1 may be considered to have a b1 fibre contact.
Figure 5. Distributions of the values of DD in the presence of SCh and of Δif.
A, distribution of the values of logn(SChDD). The bimodal distribution is emphasized by the superimposed fit of two normal distributions. The dashed line represents the individual distributions and the continuous line their sum. B, logarithmic distribution of values of ΔIF. To avoid negative numbers, before taking logarithms 4.6 has been added to all values of ΔIF. Note the unimodal distibution of the majority of values with 5 additional low values.
Whilst it appears from the above that there was commonly some on-going γ activity, this was apparently restricted to the dynamic system. The evidence for this is that control values of IF were seldom greater than 30 impulses s−1 (Fig. 4A), which is generally exceeded in the presence of natural static activity (Taylor et al. 1992c,Taylor et al. 1992c). Static activity would have given elevated values. It was therefore appropriate to take values of ΔIF to indicate effects due to afferent contacts on b2 fibres. The logarithmic distribution of these values has been plotted in Fig. 5B. This shows that, whilst the majority of observations were unimodally distributed, there were five cases with very low values (< 7 impulses s−1) separated from the main body. The interpretation proposed is that the latter were from afferents which had no significant contacts on b2 fibres.
Classification of the spindle afferents
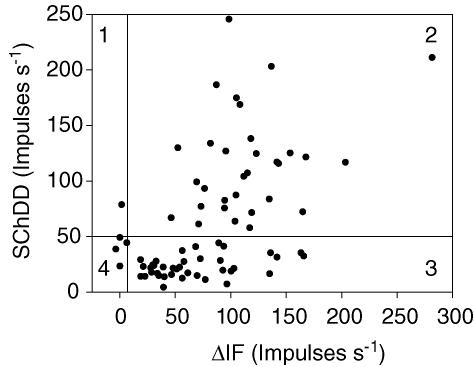
In Fig. 6 the observed values of SChDD are plotted against the corresponding values of ΔIF. There is evidently no correlation between them, which is as expected if ΔIF and SChDD are measuring two unrelated variables, namely the extent of terminations of afferents on b1 and b2 intrafusal muscle fibres. A horizontal line at 50 impulses s−1 has been drawn to represent the best criterion for recognizing the presence or absence of b1 contacts as deduced from Fig. 5A. Also a vertical line at 7 impulses s−1 separates those units to the left with no significant bag2 contacts from the rest. Thus, the plot is divided into four regions, designated 1 (b1 only), 2 (b1 and b2), 3 (b2 only) and 4 (neither). On this basis, and with the assumption that all afferents contact chain fibres, the following numbers of afferents were attributed to the four possible groups: b1c, 1; b1b2c, 31; b2c, 38 and c, 4.
Figure 6. The joint distribution of values of SChDD and ΔIF.
The values of DD at the height of the SCh effect (vertical axis) are plotted against the values of ΔIF. The vertical and horizontal lines indicate the division of the afferent responses into 4 classes, as explained in the text.
Relation of SCh classification to vibration sensitivity
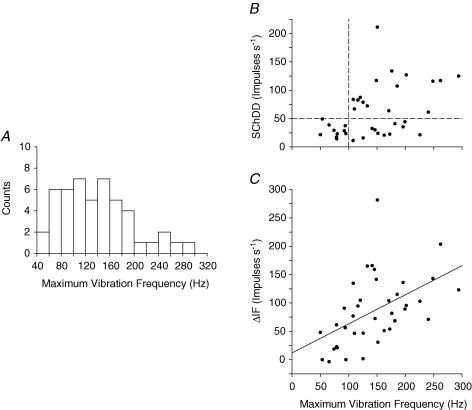
It is probable that the 32 units classified above as having bag1 contacts are primary afferents and the 4 units with neither b1 nor b2 contacts are secondary. However, an uncertain proportion of the 38 b2c afferents are likely to be primaries with no b1 contacts. In the absence of conduction velocity measurements, the only other way of distinguishing the b2c primaries from secondaries is by consideration of sensitivity to vibration. Figure 7A shows the distribution of observed values of the maximum vibration frequency (MVF) at which the 37 units so tested could respond 1 : 1 to vibration. There is no obvious separation into two groups in this regard. However, considering Fig. 7B in which SChDD is plotted against MVF, it is evident that all units with SChDD > 50 impulses s−1 (horizontal broken line), that have a b1 fibre contact, can follow frequencies above 100 Hz (vertical broken line). Consequently, it may be argued that afferents with MVF greater than 100 Hz should be regarded as belonging to primary endings. Taking these observations, together with those for the tuning fork vibration test, we concluded that, of the 74 afferents tested with SCh, 56 were primary and 16 were secondary. There were 2 afferents which we were not able to assess as primary or secondary. An unexpected additional finding is shown in Fig. 7C in the plot of ΔIF against MVF. There is a linear correlation between these two measures (r = 0.5), which is significant (P = 0.001).
Figure 7. Sensitivity to vibration related to SChDD and to Δif.
A, the distribution of values of the maximum frequency that each unit could follow vibration. B, joint distribution of values of SChDD and maximum vibration following frequency. Note that all units with SChDD > 50 impulses s−1 (horizontal interrupted line) can follow vibration above 100 Hz (vertical interrupted line). C, maximum vibration following frequency plotted against ΔIF with the linear regression line superimposed. (r = 0.5, n = 38, t = 3.47, P = 0.001).
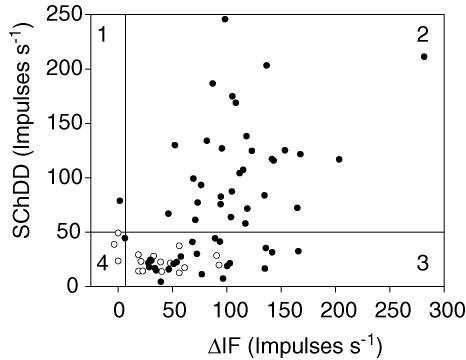
Figure 8 shows a plot of SChDD against ΔIF for the 72 afferents which could be assessed as primary or secondary, based on the vibration test. The primary afferents are shown as filled circles and the secondaries as open circles. As predicted above, the 32 afferents that had a SChDD value above 50 impulses s−1 are all apparently primary. In the case of the b2c afferents 23 were primary and 13 secondary. The secondary units were observed to have ΔIF values extending up to 100 impulses s−1 whilst the primary b2c afferents could have greater values. Thus, of the units classified as primaries, 55% can be designated as b1b2c and 41% as b2c.
Figure 8. To show the relationship of the designation as primary or secondary to the joint distribution of SChDD and ΔIF.
The joint distribution is shown of the values of SChDD and ΔIF for the 72 units which could be identified as primary (•) or secondary (○). Note that the secondary units are restricted to quadrants 3 and 4, whilst the primary units are predominantly in quadrants 2 and 3.
Discussion
The relative shortage of data available regarding the muscle spindles of the back muscles is a result of the technical difficulties encountered working with these muscles. The various component muscles are difficult to prepare to allow them to be stretched in isolation, and the dorsal nerve roots are inconveniently short. Also, the muscle nerve branches are short and relatively inaccessible and this makes measurement of conduction velocity unreliable as a means of classification of afferents (see Ge et al. 2005). In the present experiments we have restricted attention to the heads of the longissimus lumborum muscle, which have well-defined tendons allowing them to be stretched independently, though some mechanical interaction was inevitable because of their partially shared fascial origins. The difficulty of dissecting the short dorsal rootlets has been circumvented in some cases by recording with microelectrodes inserted into the dorsal rootlets close to the cord. We have thus been able to obtain data from a substantial population of back muscle spindle afferents permitting statistical analysis of their properties.
In the absence of conduction velocity measurements classification has had to depend upon response to vibration and to SCh and it is therefore important to consider the validity of these two methods. In a study of the effects of vibration of a limb muscle (Brown et al. 1967) it was found that only 1 out of 25 secondary afferents could be driven by vibration at a frequency above 100 Hz at 250 µm amplitude. Most primary endings could be driven by smaller amplitudes of vibration up to much higher frequencies. Consequently, the use of a tuning fork at 128 Hz, as described for the earlier experiments here, was probably a reasonable test. The subsequent employment of more carefully controlled vibration derived from an oscillator and electromechanical vibrator permitted a MVF to be measured. Although the distribution of MVF values (Fig. 7A) certainly does not give rise to a clear separation of two groups, it was found that all afferents diagnosed as having a b1 influence were able to follow vibration above 100 Hz. This suggests that this frequency is a useful dividing point separating primary from secondary endings. This result is similar to that found when this test was applied to jaw-closer spindle afferents (Cody et al. 1972) and is qualitatively consistent with the findings of Price & Dutia (1987) with respect to neck muscles in the cat.
The use of SCh for spindle afferent classification has been previously described in some detail for limb muscles (Price & Dutia, 1987; Taylor et al. 1992a, b). The problem which arose here for back muscles was that the control values of dynamic sensitivity were unusually high, so that SCh could produce only small increases. The practical solution adopted was to use the maximum value of dynamic response to stretch in the presence of SCh, rather than the increment in sensitivity caused by SCh. The cause of the high control values of dynamic sensitivity seems likely to have been the persistence of some tonic dynamic fusimotor activity, despite the use of pentobarbitone anaesthetic. Why the fusimotor output to the back muscles should be more resistant to anaesthesia than that to the leg muscles is unclear, but a similar situation has been reported when testing muscle spindles in intercostal muscles with SCh (Taylor & Durbaba, 1996). It may also be relevant that respiratory activity persists in γ-motor fibres to intercostal muscles in barbiturate-anaesthetized cats (Sears, 1964; Eklund et al. 1964). In the event, the method described here for back muscles gave results consistent with those for jaw and for hindlimb muscles in that distributions of measures of effects attributable to b1 and b2 intrafusal muscle fibres are clearly bimodal. This has permitted setting specific criteria for detecting contacts of afferents upon each of these fibre types. It is true that this evidence is indirect in that there is no corroboration available by direct histological examination. However, in the case of limb muscles the proportions of the different types of afferent ending so diagnosed were in accord with data from independent morphological studies (Banks et al. 1982; Taylor et al. 1995). In the present data also there is consistency in that all the afferents diagnosed as having b1 contacts were also classified as primary afferents by the vibration test.
An interesting feature of the present observations is that the proportion of primary afferents (as diagnosed by vibration) which have no apparent terminations on the b1 fibre is high compared with the situation in hindlimb muscles. Thus, here we find 41% of longissimus lumborum primaries to be of this type (b2c) as compared with 33% in medial gastrocnemius muscle (Taylor et al. 1992b). In this respect longissimus lumborum is similar to the neck muscles studied by Price & Dutia (1987) in which 50% of supposed primary afferents were thought to be b2c type. They were believed to originate in the part of tandem spindles which contained no bag1 fibre (Richmond & Abrahams, 1979; Richmond et al. 1986). The functional significance of this high proportion of atypical primary afferents in axial muscles has not been established, but some insights may come from studies of the central synaptic connections of the various afferent types. The commonly accepted view is that primary spindle afferents have strong monosynaptic connections to homonymous motoneurones and that such connections are weak in the case of secondaries. However, in the case of the jaw muscles it has been established that for each afferent the strength of monosynaptic projection is best predicted by the strength of the bag2 influence (Taylor et al. 1993). If this also holds true for the back muscles then the average strength of the back muscle spindle monosynaptic excitatory projection may be high. However, it is also known that, in the absence of fusimotor excitation, the responses of b2c primary afferents to stretch are indistiguishable from the responses of b1b2c afferents (Banks et al. 1980; Gioux et al. 1991; Taylor et al. 1992b). Therefore, if there is some functional purpose for b2c primary afferents, it must be connected with their being unaffected by dynamic fusimotor activity. It may be that as the axial muscles are predominantly involved in the maintenance of posture, then a potentiality for dynamic responsiveness is not as important as it is in the hindlimb muscles. Taking these points together, we might predict the existence of a strong tonic stretch reflex. It must be conceded, however, that the rapid postural corrections in the horizontal plane required by a cat in such tasks as walking along narrow fence palings would be expected to require substantial dynamic sensitivity in the spindles of the back muscles.
Acknowledgments
We are grateful to the late Mrs O. D. Taylor for skilled technical assistance. The research was supported by the Medical Research Council.
References
- Banks RW, Barker D, Stacey MJ. Form and distribution of sensory terminals in cat hindlimb muscle spindles. Phil Trans R Soc B. 1982;99:329–364. doi: 10.1098/rstb.1982.0136. [DOI] [PubMed] [Google Scholar]
- Banks RW, Ellaway PH, Scott JJ. Responses of de-efferented muscle spindles of peroneus brevis and tertius muscles in the cat. J Physiol. 1980;310:53P. [Google Scholar]
- Brown MC, Engberg I, Matthews PBC. The relative sensitivity to vibration of muscle receptors of the cat. J Physiol. 1967;192:773–800. doi: 10.1113/jphysiol.1967.sp008330. [DOI] [PMC free article] [PubMed] [Google Scholar]
- Carlson H. Observations on stretch relexes in lumbar back muscles of the cat. Acta Physiol Scand. 1978;103:437–445. doi: 10.1111/j.1748-1716.1978.tb06238.x. [DOI] [PubMed] [Google Scholar]
- Cody FWJ, Lee RWH, Taylor A. A functional analysis of the components of the mesencephalic nucleus of the fifth nerve in the cat. J Physiol. 1972;226:249–261. doi: 10.1113/jphysiol.1972.sp009983. [DOI] [PMC free article] [PubMed] [Google Scholar]
- Crowe A, Matthews PBC. The effects of stimulation of static and dynamic fusimotor fibres on the response to stretching of the primary endings of muscle spindles. J Physiol. 1964;174:109–131. doi: 10.1113/jphysiol.1964.sp007476. [DOI] [PMC free article] [PubMed] [Google Scholar]
- Dutia MB. Activation of cat muscle spindle primary, secondary and intermediate sensory ending by suxamethonium. J Physiol. 1980;304:315–330. doi: 10.1113/jphysiol.1980.sp013326. [DOI] [PMC free article] [PubMed] [Google Scholar]
- Eklund G, von Euler C, Rutkowski S. Spontaneous and reflex activity of intercostal gamma motoneurones. J Physiol. 1964;171:139–163. doi: 10.1113/jphysiol.1964.sp007368. [DOI] [PMC free article] [PubMed] [Google Scholar]
- Ge W, Long CR, Pickar JG. Vertebral position alters paraspinal muscle spindle responsiveness in the feline spine: effect of positioning duration. J Physiol. 2005;569:655–665. doi: 10.1113/jphysiol.2005.095281. [DOI] [PMC free article] [PubMed] [Google Scholar]
- Gioux M, Petit J, Proske U. Responses of cat muscle spindles which lack a dynamic fusimotor supply. J Physiol. 1991;432:557–571. doi: 10.1113/jphysiol.1991.sp018400. [DOI] [PMC free article] [PubMed] [Google Scholar]
- Gladden MH. Structural features relative to the function of intrafusal muscle fibres in the cat. Prog Brain Res. 1976;44:51–59. doi: 10.1016/S0079-6123(08)60722-0. [DOI] [PubMed] [Google Scholar]
- Haftel VK, Bichler EK, Nichols TR, Pinter MJ, Cope TC. Movement reduces the dynamic response of muscle spindle afferents and motoneuron synaptic potentials in rat. J Neurophysiol. 2004;91:2164–2171. doi: 10.1152/jn.01147.2003. [DOI] [PubMed] [Google Scholar]
- Merrill EG, Ainsworth A. Glass-coated platinum plated tungsten microelectrodes. Med Biol Eng. 1972;10:662–672. doi: 10.1007/BF02476084. [DOI] [PubMed] [Google Scholar]
- Pickar JG. An in vivo preparation for investigating neural reponses to controlled loading of a lumbar vertebra in the anaesthetised cat. J Neurosci Meth. 1999;89:87–96. doi: 10.1016/s0165-0270(99)00060-6. [DOI] [PubMed] [Google Scholar]
- Price RF, Dutia MB. Properties of cat neck muscle spindle afferents and their excitation by succinylcholine. Exp Brain Res. 1987;68:619–630. doi: 10.1007/BF00249805. [DOI] [PubMed] [Google Scholar]
- Proske U, Gregory JE. The time-course of recovery of initial burst of primary endings of muscle spindles. Brain Res. 1977;121:358–361. doi: 10.1016/0006-8993(77)90159-7. [DOI] [PubMed] [Google Scholar]
- Richmond FJR, Abrahams VC. Physiological properties of muscle spindles in the dorsal neck muscles of the cat. J Neurophysiol. 1979;42:604–617. doi: 10.1152/jn.1979.42.2.604. [DOI] [PubMed] [Google Scholar]
- Richmond FJR, Bakker GJ, Bakker DA, Stacey MJ. The innervation of tandem muscle spindles in the cat neck. J Comp Neurol. 1986;245:483–497. doi: 10.1002/cne.902450405. [DOI] [PubMed] [Google Scholar]
- Sears TA. Efferent discharges in alpha and fusimotor fibres of intercostal nerves of the cat. J Physiol. 1964;174:295–315. doi: 10.1113/jphysiol.1964.sp007488. [DOI] [PMC free article] [PubMed] [Google Scholar]
- Taylor A, Durbaba R. Fusimotor control of the respiratory muscles. In: Bostock H, Kirkwood PA, Pullen AH, editors. The Neurobiology of Disease. Cambridge: Cambridge University Press; 1996. pp. 231–240. [Google Scholar]
- Taylor A, Durbaba R, Ellaway PH, Rawlinson SR. Spinal projection of back muscle spindle afferents by spike-triggered averaging of focal synaptic potentials. J Physiol. 2004;557.P:C94. [Google Scholar]
- Taylor A, Durbaba R, Rodgers JF. The classification of afferents from muscle spindles of the jaw-closing muscles of the cat. J Physiol. 1992a;456:609–628. doi: 10.1113/jphysiol.1992.sp019356. [DOI] [PMC free article] [PubMed] [Google Scholar]
- Taylor A, Durbaba R, Rodgers JF. Projection of cat jaw muscle spindle afferents related to intrafusal fibre influence. J Physiol. 1993;465:647–660. doi: 10.1113/jphysiol.1993.sp019698. [DOI] [PMC free article] [PubMed] [Google Scholar]
- Taylor A, Durbaba R, Rodgers JF. Quantitative aspects of the use of succinylcholine in the classification of muscle spindle afferents. In: Ferrell WR, Proske U, editors. Neural Control of Movement. New York: Plenum Press; 1995. pp. 35–42. [Google Scholar]
- Taylor A, Ellaway PH, Durbaba R, Rawlinson S. Muscle spindle afferents of the feline longissimus lumborum muscle. J Physiol. 2000;525:44–45P. doi: 10.1113/jphysiol.2005.102731. [DOI] [PMC free article] [PubMed] [Google Scholar]
- Taylor A, Rodgers JF, Durbaba R, Fowle AJ. The classification of hindlimb muscle spindle afferents in the cat by the influence of the intrafusal fibres. J Physiol. 1992b;456:629–644. doi: 10.1113/jphysiol.1992.sp019357. [DOI] [PMC free article] [PubMed] [Google Scholar]
- Taylor A, Rodgers JF, Fowle AJ, Durbaba R. Interpretation of spindle afferent recordings according to intrafusal fibre influence. In: Jami L, Pierrot-Deseilligny E, Zytnicki D, editors. Muscle Afferents and Spinal Control of Movement. Oxford: Pergamon Press Ltd; 1992c. pp. 105–111. [Google Scholar]


