

Abstract
Recent studies have shown that Kir2 channels display differential sensitivity to intracellular polyamines, and have raised a number of questions about several properties of inward rectification important to the understanding of their physiological roles. In this study, we have carried out a detailed characterization of steady-state and kinetic properties of block of Kir2.1–3 channels by spermine. High-resolution recordings from outside-out patches showed that in all Kir2 channels current–voltage relationships display a ‘crossover’ effect upon change in extracellular K+. Experiments at different concentrations of spermine allowed for the characterization of two distinct shallow components of rectification, with the voltages for half-block negative (V11/2) and positive (V21/2) to the voltage of half-block for the major steep component of rectification (V01/2). While V11/2 and V21/2 voltages differ significantly between Kir2 channels, they were coupled to each other according to the equation V11/2−V21/2= constant, strongly suggesting that similar structures may underlie both components. In Kir2.3 channels, the V21/2 was ∼50 mV positive to V01/2, leading to a pattern of outward currents distinct from that of Kir2.1 and Kir2.2 channels. The effective valency of spermine block (Z0) was highest in Kir2.2 channels while the valencies in Kir2.1 and Kir2.3 channels were not significantly different. The voltage dependence of spermine unblock was similar in all Kir2 channels, but the rates of unblock were ∼7-fold and ∼16-fold slower in Kir2.3 channels than those in Kir2.1 and Kir2.2 when measured at high and physiological extracellular K+, respectively. In all Kir2 channels, the instantaneous phase of activation was present. The instantaneous phase was difficult to resolve at high extracellular K+ but it became evident and accounted for nearly 30–50% of the total current when recorded at physiological extracellular K+. In conclusion, the data are consistent with the universal mechanism of rectification in Kir2 channels, but also point to significant, and physiologically important, quantitative differences between Kir2 isoforms.
Kir2.1–3 members of the Kir2 subfamily of potassium channels are believed to underlie the cardiac inwardly rectifying current IK1 in various species, as well as in different regions of the heart (Lopatin & Nichols, 2001; Melnyk et al. 2002; Dhamoon et al. 2004). There is growing evidence that native IK1 channels are heterotetramers of different Kir2 subunits contributing to IK1 in varying proportions within different cardiac tissues (Zaritsky et al. 2001; Schram et al. 2003; Zobel et al. 2003). All Kir2 channels rectify strongly due to a high-affinity voltage-dependent block by free endogenous intracellular polyamines (PAs), primarily spermine (Spm), as well as Mg2+ ions (Ficker et al. 1994; Lopatin et al. 1994; Fakler et al. 1995). Thus, the magnitude of outward, physiologically relevant, current is determined by both the sensitivity of IK1 channels to PAs, and the levels of free intracellular PAs themselves. The molecular composition of IK1 channels has been addressed in multiple studies by employing several specific properties of different Kir2 isoforms, such as unique single-channel conductances (Liu et al. 2001) and specific sensitivities to externally applied Ba2+ ions (Schram et al. 2003). While the principal mechanism of PA-induced rectification in Kir channels is now well established (Lopatin et al. 1995; Guo & Lu, 2000; Guo et al. 2003), only a few studies have paid attention to the differences in PA sensitivity between Kir isoforms (Dhamoon et al. 2004; Panama et al. 2004). For example, Dhamoon et al. (2004) have analysed the properties of Kir2 channels and concluded that Kir2.3 channels possess a unique rectification profile lacking a ‘crossover’ effect upon an increase in extracellular K+, a hallmark of strong inward rectifier channels. Ishihara & Ehara (2004) have found that Kir2.1 channels can adopt two different modes of high and low sensitivity to spermine, and that spermine unblock is characterized by clear instantaneous and time-dependent phases. Several potential experimental limitations, and a number of missing complementary experiments in the above studies have prompted us to look more carefully at some of the novel findings, and to further characterize the differential PA sensitivity in Kir2 channels. In this study, we have extended experiments involving whole-cell measurements of Kir2 currents by performing high-resolution recordings in inside-out and outside-out configurations in order to study inward rectification under more controlled conditions. We have carried out a detailed analysis of K+ dependence of Kir2 channel rectification and found, in contrast to published whole-cell data (Dhamoon et al. 2004), that Kir2.3 channels do display a classical ‘crossover’ effect along with a clear region of negative slope conductance when studied in a cell-free environment (inside-out or outside-out configurations). In all Kir2 channels, block by spermine is characterized by three distinct components: one steep and two shallow components. The shallow components 1 and 2 are revealed at high and low concentrations of spermine, respectively. Strong relationships between several different parameters of rectification and conduction imply that both shallow components originate from a similar site in the channel pore. Analysis of activation kinetics revealed that the instantaneous component of spermine unblock is present in all Kir2 channels, and becomes more pronounced at a low physiological extracellular K+. The data in this study will aid in the search for molecular correlates of IK1 in different species and tissues, and will also be useful in delineating the channel structures underlying differential PA sensitivity.
Methods
Cloning of Kir2.x channels and mutagenesis
Kir2.x subunits were cloned from mouse genomic DNA using a PCR-based technique and sequenced to check for potential errors. Primers were designed using Vector NTI software (Invitrogen, USA). The channels were subcloned into a pIRES-GFP expression vector (Clontech, USA). In some experiments, a Kir2.3-YFP fusion protein was used to achieve better success rates for selection of highly expressing cells. YFP (yellow fluorescent protein, Clontech) was attached to the C-terminus of the channel without a linker. Site-directed mutagenesis was also done by a PCR-based technique using overlapping primers containing the desired altered sequences.
Cultured cell transfection
HEK 293 cells were cultured in Dulbecco's modified Eagles medium (DMEM) plus 10% calf serum, and 1% antibiotic/antimycotic (Invitrogen, USA) at 37°C, 5% CO2. Cells were plated on 35 mm plates containing a glass coverslip 30 h prior to transfection. Cells were transfected with DNA constructs (1–2 μg) using Lipofectamine 2000 (Invitrogen, USA) according to the manufacturer's instructions. After the ∼4 h required for DNA uptake into the cells, the media was changed, and sodium butyrate (5 mm; Sigma) was added for 12 h to increase expression (Moyer et al. 1998). Cells were used for recordings 1–3 days post transfection.
Patch-clamp recordings
Ionic currents from HEK 293 cells were recorded in whole-cell, inside-out and outside-out configurations (Hamill et al. 1981), using an Axopatch 200B amplifier, Digidata 1322A and pCLAMP 8.2 software (Axon Instruments, USA). Micropipettes (no. 73813, Kimble Glass Co., USA), were pulled on a horizontal puller (Sutter Instruments, USA). The patch-clamp set-up was as previously described (McLerie & Lopatin, 2003). Pipette resistance varied from 1 to 2 MΩ.
Whole-cell recordings
In all whole-cell recordings, the series resistance (Rs) was compensated 80%, and cells with an uncompensated Rs > 4 MΩ were discarded from analysis. The majority of whole-cell recordings were performed within 2–4 min after establishing whole-cell configuration in order to minimize washout of endogenous PAs and Mg2+. Typical increase of the outward current at 4–5 min was less than 20%. Importantly, for all channels, the currents were recorded under the same conditions within the same short period of time. Voltages were not corrected for a liquid junction potential. HEK 293 cells were bathed in modified Tyrode solution (for solution compositions see ‘Solutions’ below) and pipettes were filled with KINT solution containing 2 mm K2ATP. KINT but not FVPP pipette solution was used in whole-cell experiments to avoid a relatively (compared to Spm) fast diffusion of pyrophosphate, a known binding agent of PAs, into the cell, which would lead to a change in the free concentration of PAs. Kir2 currents were measured in response to a 4 s voltage ramp from −120 to +20 mV from a holding potential (Vh) of −75 mV. Correction for minor linear leak was performed off-line by bringing the reversal potential of corrected Kir current to −80 mV.
Inside-out recordings
The pipettes were filled with KINT solution (0 ATP). Patches were first excised into a PA- and Mg2+-free FVPP bath solution (below) to wash out endogenous PAs, and then Spm was applied at a desired concentration. With the exception of E224G and E229S mutant channels, steady-state currents were recorded using a series of 150 ms voltage steps to potentials between −90 and +60 mV preceded by a 10 ms prepulse to −80 or −70 mV from a holding potential of 0 mV. A minor linear leak was estimated and corrected for off-line by measuring current at +60 mV remaining after application of 300 μm Spm. Voltage pulses were prolonged to 600–800 ms and extended to +100 mV to accommodate the slow Spm block and weak rectification in E224G and E229S channels. Correspondingly, the amount of leakage was estimated by running down the current with Ag+ ions applied to the intracellular side of the patch.
Outside-out recordings
For experiments in the outside-out configuration FVPP was used as a pipette intracellular solution. Using FVPP significantly slowed down channel rundown, which we believe is primarily caused by unknown high valency cations leaching from the pipette glass. The total amount of Spm added was 30 μm. It should be noted that pyrophosphate in FVPP solution is a potent chelator of Spm. According to our measurements (authors' unpublished observations) 30 μm total Spm corresponds to ∼7 μm free Spm. Extracellular K+-free solution was used to isolate Kir currents (Ishihara et al. 1989).
Current activation (PA unblock) was evoked using a series of hyperpolarizing steps from a Vh of −30 mV to potentials up to −130 mV (whole-cell), and from a Vh of +50 mV to potentials up to −80 mV (inside-out). The P/4 procedure with a subsweep holding level of 0 to +20 mV in whole-cell recordings, and +60 mV in inside-out recordings was used to subtract the capacitance transients from the activation current records.
The data were not corrected for a ∼4 mV voltage shift due to small asymmetry in the K+ concentration between KINT and FVPP solutions.
Solutions
Modified Tyrode solution (mm): 137 NaCl, 5.4 KCl, 0.5 MgCl2, 0.3 CaCl2, 0.16 NaH2PO4, 3 NaHCO3, 5 Hepes, 5 glucose, pH 7.35 with NaOH.
KINT (mm): 130 KCl, 1 EGTA, 10 Hepes, 2 K2ATP, pH 7.35 with KOH (estimated ∼150 mm K+).
FVPP (mm): 95 KCl, 0.1 Na3VO4, 10 K4P207, KF, 10 Hepes, 1 EGTA, pH = 7.35 (estimated ∼145 mm K+) with KOH.
Data analysis
Data analysis was performed using Microsoft Excel (2000) and Clampfit 8.2 (Axon Instruments, Foster City, CA, USA).
Since residual rectification is always present even after careful washout of PAs, as well as due to the presence of contaminating ions (Guo & Lu, 2002), the currents in the absence of Spm in wild-type Kir2 and some mutant channels were approximated by a linear model (Lopatin & Nichols, 1996a) I =λ(V − Vrev), with the slope conductance (λ) equal to that of corresponding chord conductance at far negative membrane potentials. Unblocked I–V relationships for E224G and E299S mutant channels are not linear. Thus, the I–V relationships in the absence of Spm were first fitted at negative membrane potentials to a modified Goldman current equation incorporating a surface charge according to the equation:
Vm and ϕ are membrane potential and internal surface potential, respectively. λ=F/RT, where R, T and F are the universal gas constant, absolute temperature (300 K) and Faraday constant, respectively. α is a scaling factor. The equation was extrapolated to the depolarized potentials, and then used for calculations of the relative current.
Relative currents were calculated as a ratio between currents in the presence of Spm and the unblocked current approximation, then fitted with the sum of two Boltzmann functions:
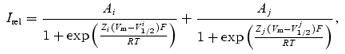 |
where A, Z and V1/2 are amplitudes, effective valencies and voltages of half-block for the steep and shallow components of block.
The small voltage region (∼±2 mV) around the reversal potential was excluded from the fits.
The mean ± standard error of the mean (s.e.m.) is used throughout the text. A two-tailed unpaired t test with equal variances was used for estimation of statistical significance of the differences which were considered significant if P < 0.05.
Results
Kir2 channels display distinct patterns of Spm-induced rectification
Steady-state rectification properties of Kir2 channels were first studied in inside-out patches exposed to a high concentration (∼150 mm) symmetrical K+, with 0 and 300 μm Spm on the intracellular side of the membrane. All channels rectified strongly in the presence of Spm, but displayed a different degree of block at far negative potentials (Fig. 1A and B). Specifically, in the presence of 300 μm Spm and at a −90 mV membrane potential, only Kir2.3 channels were nearly completely unblocked while ∼80% and ∼60% (P < 0.01) of Kir2.1 and Kir2.2 channels, respectively, remained unblocked under the same conditions (Fig. 1B). Relative currents (Fig. 1C) obtained from experiments as in Fig. 1A display two distinct phases of rectification: one shallow (component 1) and one steep (component 0) (Lopatin et al. 1995; Xie et al. 2002; Shin & Lu, 2005). Table 1 summarizes the parameters of rectification obtained by fitting relative currents (Irel) measured at 300 μm Spm with a double Boltzmann equation. The V11/2 component of block was difficult to characterize at lower concentrations of Spm, but it could be easily observed at 100 and 300 μm. The major difference between Kir2 channels was observed in the voltage of half-block for the shallow component 1 (V11/2), while the V01/2 for the steep component (0) of rectification was similar in all channels (Fig. 1D). Specifically, V11/2 in Kir2.3 channels was ∼12 and ∼23 mV more positive than that in Kir2.1 and Kir2.2 channels, respectively. In addition, the effective valency Z0 for the steep component of Spm block in Kir2.2 channels was significantly higher than in Kir2.1 and Kir2.3 channels. Consistent with the latter, a close inspection of relative currents revealed that both Kir2.1 and Kir2.3 channels also display a ∼2-fold (P < 0.05) higher conductance at the reversal potential than Kir2.2 channels (not shown).
Figure 1. Differential spermine (Spm) sensitivity in Kir2 channels.

Inside-out patches from HEK 293 cells expressing Kir2.1 (n = 7), Kir2.2 (n = 4) and Kir2.3 (n = 9) channels were exposed to Spm and high symmetrical [K+] (see Methods), and currents measured at the end of 150 ms voltage steps. A, representative current traces from Kir2.1-, Kir2.2- and Kir2.3-expressing cells recorded in 0 or 300 μm Spm in response to voltage steps to potentials between −90 and +60 mV preceded by 10 ms prepulse to −80 mV. Dashed lines indicate the zero current level. B, all channels showed strong inward rectification, with Kir2.3 blocked the least and Kir2.2 blocked the most at far negative potentials. Currents in the absence of Spm showed linear I–V relations at negative membrane potentials, and were assumed to be linear at positive potentials for all Kir2 channels. Residual rectification of varying degree remained even after careful PA washout but did not affect the results (see Methods). C, block by 30, 100 and 300 μm Spm was quantified by fitting relative currents with a double Boltzmann equation (see Methods). D, Kir2.1, 2.2 and 2.3 relative currents at 300 μm Spm are superimposed. The major differences between the Kir2 isoforms occurred at negative potentials.
Table 1.
Parameters of rectification in Kir2.1–3 channels in high extracellular K+ at 300 μM spermine
| Z0 | Z1 | V01/2 | V11/2 | n | |
|---|---|---|---|---|---|
| Kir2.1 | 5.0 ± 0.2 | 1.4 ± 0.1 | −23.4 ± 1.0 | −64.6 ± 4.3 | 7 |
| Kir2.2 | 5.9 ± 0.2* | 1.5 ± 0.1 | −22.4 ± 0.3 | −75.5 ± 1.9 | 4 |
| Kir2.3 | 5.2 ± 0.1 | 1.7 ± 0.1 | −24.6 ± 0.4* | −52.2 ± 0.8** | 9† |
n is number of cells
Only 3 cells expressing Kir2.3 channels at a level suitable for reliable analysis are included. The remaining 6 cells expressed Kir2.3-YFP fusion channels. The presence of a YFP tag dramatically facilitates selection of highly expressing cells. There was no measurable difference in any parameter between the two channel constructs, and thus the data were pooled together
P < 0.05
P < 0.01 compared to Kir 2.1
It has been shown that in Kir2.1 both shallow component 1 and the steep phase of rectification (component 0) strongly depend on Spm concentration (Lopatin et al. 1995; Xie et al. 2002; Ishihara & Ehara, 2004). In order to test if the same phenomenon takes place in Kir2.2 and Kir2.3 channels we have measured the Spm dependence of rectification in these channels and compared it to that in Kir2.1 channels. Figures 1 and 9A show that in all Kir2 channels both components 1 and 0 strongly depend on [Spm], and the block of the channels at far negative potentials is relieved upon a decrease in [Spm]. The amplitude, or the contribution, of the shallow component 1 to the total current varies with [Spm] and its correct estimation within the range of membrane potentials used in these experiments becomes less reliable at either low (< 30 μm) or high (> 900 μm) Spm. Because of the above, we were only able to obtain reliable data at 300 μm and 100 μm Spm with Kir2.2 channels.
Figure 9. Spermine dependence of rectification, and relationships between parameters of rectification and single-channel conductance in Kir2 channels.

A, voltages for half-block for components of rectification 0, 1 and 2 were derived from the fits to the data presented in Figs 1C and 4 and plotted against log[Spm] (log μm)]. B, the separation voltages for shallow components 1 and 2 in Kir2 channels measured at different concentrations of Spm are directly proportional to each other. Linear fits to the data correspond to: 1 = (100V01/2− 100V11/2)versus(30V21/2− 30V01/2), 2 = (300V01/2−300V11/2) versus (30V21/2− 30V01/2), and 3 = (300V01/2− 300V11/2) versus (3V21/2−3V01/2). For example, 300V21/2 means that the V21/2 component was measured at 300 μm Spm, etc. Since V01/2 is nearly the same for all channels at any specific [Spm] the relations translate to V21/2−V11/2∼ constant. The V01/2−V11/2 differences were derived from data in A and Table 1. At 3 μm Spm the V01/2 and V21/2 differences were obtained from inside-out patches (Fig. 4) only, and at 30 μm Spm the data are averages from Fig. 4 and Table 2 (outside-out patches). C, single-channel conductances of Kir channels (Liu et al. 2001) are plotted against V11/2, a voltage of half-block for the shallow component 1 of rectification.
Differential rectification properties of Kir2 isoforms under physiological extracellular K+
To further investigate the differential properties of Kir2 isoforms under conditions similar to those used for measurements of IK1 in cardiac myocytes, we examined Kir2 currents in the whole-cell configuration with a physiological (low) extracellular K+ concentration. Initially, whole-cell experiments were designed to look more carefully at the outward component of the currents at low extracellular K+, which was quite a challenging task in excised patch configurations due to relatively small current densities. No Spm was added to the pipette (intracellular) solutions in initial experiments, so only undefined cytosolic concentrations of PAs and other unknown potential factors were present. Recordings of Kir2 currents were made within a few minutes after establishment of the whole-cell configuration to minimize PA washout. Figure 2A shows averaged whole-cell recordings for each of the channels. It should be noted that the level of channel expression was quite different for different Kir isoforms: Kir2.1 channels displayed the highest level of expression, while it was smallest for Kir2.3 channels. All Kir2 channels showed strong inward rectification, although clear differences in their rectification profile at depolarized potentials were apparent. Figure 2B shows the same currents as in Fig. 2A, but normalized at −120 mV. In contrast to Kir2.1 and Kir2.2 channels, Kir2.3 channels did not seem to rectify completely even at +20 mV, and displayed a ‘weak’ region of negative slope conductance. The above results are similar to the ‘shallow’ and incomplete rectification reported in Kir2.3 channels by Dhamoon et al. (2004). To test whether the incomplete and ‘weak’ rectification at depolarized potentials might be explained by a low level of intracellular PAs (or PA washout), in a series of experiments we included 1 mm Spm in the patch pipette solution and allowed it to wash in for 5–12 min. An example in Fig. 2C shows that although the amplitude of inward Kir2.3 current was significantly decreased at hyperpolarizing membrane potentials (−100 mV; confirming Spm washing-in), a smaller reduction in the outward current was observed at intermediate depolarized potentials (−40 mV). Also, Spm failed to affect currents in any significant way at far depolarized potentials (+20 mV). Similar results were observed in four other experiments. In addition, extension of the ramp pulse to +50 mV also failed to bring Kir2.3 current to the small levels observed with Kir2.1 and Kir2.2 channels at even less depolarized potentials (see Discussion).
Figure 2. Kir2 channels display differential rectification.

A, averaged steady-state I–V relationships for the Kir2.x isoforms were obtained in the whole-cell configuration with physiological (5.4 mm) extracellular K+ and without Spm in the pipette solution (KINT). s.e.m. bars are shown only at −120, −60 and +20 mV (not visible; overlaps with the symbol) for clarity. The error bar for Kir2.3 channels at −120 mV is also shifted for clarity (*). n = 5, 4 and 5 for Kir2.1, Kir2.2 and Kir2.3 channels, respectively. The data are not corrected off-line for voltage errors due to serial resistance remaining after compensation using the amplifier. B, currents in A were normalized at −120 mV. Inset shows expanded currents and corresponding error bars at an expanded current scale. Kir2.3 channels display ‘shallow’ rectification at depolarized potentials as well as a small but clear region of negative slope. C, Kir2.3 currents were recorded immediately after establishing whole-cell configuration (▴) and after 12 min of dialysis with 1 mm Spm (▵). I–V relationships are normalized at −120 mV.
K+ dependence of rectification in Kir channels
One of the major concerns in studying Kir2 currents in the whole-cell mode is that although the absolute total current amplitudes may seem quite large (several nA), the current densities (pA pF−1) are relatively low, and thus quantification of small density currents may potentially be compromised by the presence of unknown endogenous conductances originating from the whole membrane of the cell as well as from some unknown intracellular factors affecting the properties of Kir2 channels. Using Ba2+ to isolate small Kir2 currents may not be sufficient as other endogenous currents (potentially induced by Kir2 channel expression) may also be sensitive to Ba2+ ions. Specifically, the problem is manifested with Kir2.3 channels, which display severalfold lower current densities than Kir2.1 channels, and therefore questions arise about their true rectification profile. Additionally, quantitative control over the concentrations of intracellular PAs, especially the longer Spm, as well as other potentially important unknown intracellular factors is virtually impossible. Lastly, the origin of small endogenous currents or the nature of intracellular factors potentially affecting Kir2 channels in whole-cell recordings may be difficult to identify and thus alternative currently available approaches are highly desirable.
To alleviate the above difficulties and to achieve precise control over the composition of solutions on both sides of the membrane, we measured Kir2 currents in the outside-out configuration. Surprisingly, in multiple outside-out patches the amplitude of inward Kir2.3 current was comparable to that routinely obtained in the whole-cell configuration (see also Dhamoon et al. 2004). Whether the above ‘phenomenon’ is due to potential clustering of Kir2.3 channels or due to some other mechanism is unknown.
Relative currents in Kir2 channels were measured at different extracellular K+ concentrations in outside-out patches in the presence of a physiological (∼7 μm free Spm; close to that in cardiac myocytes, Yan et al. 2005) concentration of Spm, and data fitted with the sum of two Boltzmann equations (n = 2, 2 and 3 patches for Kir2.1, Kir2.2 and Kir2.3, respectively). Figure 3 and Table 2 combine the data.
Figure 3. Extracellular K+ dependence of rectification in Kir2 channels.

Kir2 currents were recorded in outside-out patches exposed to different extracellular K+ concentrations and in the presence of 30 μm total Spm in FVPP intracellular solution (see Methods). ‘5' corresponds to an actual value of 5.4 mm K+. A–C, representative currents recorded at 5.4, 10, 20 and 60 mm extracellular K+. Note different scale (absolute) for currents. D, an example of relative conductances for Kir2.1, Kir2.2 and Kir2.3 channels obtained at 5.4 mm extracellular K+. Original traces and the fits with Boltzmann functions overlap. A region of the data near the reversal potential (∼few mV) is omitted from fits. E, the K+ dependence of relative conductance in Kir2.1 channels. F, V01/2 and V21/2 voltages for half-block for the steep component and shallow component 2 of rectification, respectively, were measured at different K+ concentrations and plotted against corresponding reversal potentials. Filled and open symbols correspond to V01/2 and V21/2, respectively. Continuous lines are linear approximations to the data (8–12 measurements for each regression). The data and corresponding fits for V01/2 overlap for Kir2.1 and Kir2.2 channels. The data are from 2, 2 and 3 independent experiments for Kir2.1, Kir2.2 and Kir2.3, respectively.
Table 2.
Parameters of the K+ dependence of rectification in Kir2.1–3 channels at 30 μM spermine
| k0 | k2 | Z0 | Z2 | V01/2 (0 mV) | V21/2 (0 mV) | |
|---|---|---|---|---|---|---|
| Kir2.1 | 0.98 ± 0.01 | 1.04 ± 0.02 | 5.6 ± 0.1 | 3.2 ± 0.1 | −6.4 ± 0.3 | 29.5 ± 1.0 |
| Kir2.2 | 0.98 ± 0.03 | 1.01 ± 0.06 | 6.7 ± 0.1 | 2.9 ± 0.1 | −6.4 ± 1.8 | 19.7 ± 2.9** |
| Kir2.3 | 1.04 ± 0.04 | 1.01 ± 0.08 | 5.2 ± 0.3 | 2.0 ± 0.1 | −10.1 ± 2.1 | 39.0 ± 4.1** |
Data were obtained from outside-out patches at different external K+ concentrations. V01/2 (at 0 mV) and V21/2 (at 0 mV) values are derived from linear fits to data in Fig. 3 extrapolated to 0 mV.
P < 0.01.
An expanded view of the outward currents in Fig. 3A–C shows that all Kir2 channels displayed a clear region of negative slope conductance and a classic ‘crossover’ effect (○), accompanied by an increase in outward current amplitude upon an increase in extracellular K+. While Kir2.1 and Kir2.2 current profiles were similar, Kir2.3 channels displayed quite a different pattern of outward currents, which is qualitatively characterized by a more shallow voltage dependence. The rectification properties of Kir2.3 shown in Fig. 3C are different than that obtained from whole-cell recordings (Fig. 2), and in sharp contrast to other whole-cell data (Dhamoon et al. 2004), which suggests that the lack of a classical ‘crossover’ effect in whole-cell recordings is potentially explained by either contamination with other unknown endogenous currents or by some unknown endogenous factors.
A more detailed analysis of rectification revealed a number of important similarities and differences between Kir2 isoforms. Effective valencies Z0 and Z2 for a steep (component 0) and a shallow phase (component 2) of rectification, respectively, did not show K+ dependence (r2 regression 0.1–0.3), and thus the data for each particular channel obtained at different K+ concentrations were pooled together. In Table 2, V01/2 and V21/2 voltages represent the linear fits to the data in Fig. 3 extrapolated to 0 mV (equivalent to true symmetrical K+).
Inspection of the data in Table 2 shows that the voltage dependence of the steep part of rectification Z0 is nearly the same for Kir2.1 and Kir2.3 channels, and is highest in Kir2.2 channels, consistent with the data obtained at high concentrations of Spm in inside-out patches (Table 1). More dramatic differences are observed at far depolarized potentials. The V21/2 voltages for half-block of the shallow component 2 differed by nearly 20 mV between Kir2.2 and Kir2.3 channels, with Kir2.1 channels being intermediate. The effective valencies of the shallow component 2 (Z2) were roughly 2-fold smaller than those of the steep component (Z0).
One of the parameters important for understanding the mechanism of Kir2 channel block is the difference between the voltages of half-block for different components di,j =Vi1/2−Vj1/2, which we will call a ‘separation voltage’ (see Discussion). For example, the separation voltage between the shallow component 2 and the steep component 0 of block d2,0 reaches ∼36, ∼26 and ∼50 mV in Kir2.1, Kir2.2 and Kir2.3 channels, respectively.
The K+ dependence of rectification parameters shows remarkable similarities between Kir2 channels. Figure 3E is an example of the data for Kir2.1 channels showing that relative currents shift essentially without any significant change in shape upon an increase in extracellular K+ concentration. Detailed analysis of K+ dependence of individual components revealed that in all Kir2 channels the dependence of both V01/2 and V21/2 on Erev can be described by a linear function (Fig. 3F) according to the equation Vi1/2=kiErev+Vi1/2 (0 mV), with coefficients of proportionality ki close to 1 within a few percent precision (Table 2).
Spermine dependence of shallow component 2 rectification
It has been previously shown that, similar to shallow component 1 in Kir2.1 channels, shallow component 2, observed at lower [Spm], is also dependent on the level of Spm (Guo & Lu, 2000; Ishihara & Ehara, 2004). Consistent with the above, we found, using inside-out patches at high symmetrical K+, that shallow component 2 in Kir2.2 and Kir2.3 channels also displayed a strong dependence on [Spm] (Figs 4 and 9A). Similar to V11/2 and V01/2, V21/2 shifted to more depolarized potentials as the Spm concentration decreased.
Figure 4. Spermine dependence of shallow component 2.

Representative records of Kir2 currents in inside-out patches at high symmetrical K+ exposed to 3 or 30 μm Spm in FVPP intracellular solution with pipettes filled with KINT solution (see Methods). Currents were recorded in response to 4 s voltage ramp, normalized at ∼−40 mV and fitted with the sum of two Boltzmann functions. A small region of the data near the reversal potential (a few mV) is omitted from fits. Fits overlap with the current traces and may not be visible in some places. The data are plotted on a log scale to highlight the shallow component 2.
Mutational analysis of the shallow components of rectification
It is well established that shallow component 1 of rectification is affected by several mutations in the inner vestibule of Kir2.1 channels. We performed additional experiments to investigate whether shallow component 2 is also affected by the same, or similar, manipulations in the inner vestibule. In addition to previously reported E224G, E299S and F254A mutations (Taglialatela et al. 1995; Yang et al. 1995; Kubo & Murata, 2001; Shin et al. 2005) we have also tested two novel mutations, S256I and S256K, which we believe might potentially be involved in the rectification process (Fig. 5).
Figure 5. Location of Kir2.1 mutations used in the study.

A and B, crystal structure of C terminus of Kir2.1 channel (Pegan et al. 2005) was visualized using Swiss-PDB Viewer software. Two opposing subunits were removed for clarity and side chains for the mutants used in this study displayed. A represents a side view, and B shows a top view of the pore region. C, sequence alignment of Kir2 channels in the region around the residues critical for inward rectification. Arrowhead points to the highly conserved F254 residue and asterisk indicates the least conserved site in this region.
Specifically, we focused on S256 because (a) it is close to F254 and D255, which have been shown to affect rectification (Pegan et al. 2005; Shin et al. 2005), and (b) it is not conserved among Kir2 channels, and thus may underlie the observed differences in shallow component 1. E224G and E299S channels display significantly slower kinetics of Spm block requiring longer voltage steps to reach a reasonable steady-state level even at high [Spm]. Using longer pulses is impractical due to limited patch viability and channel rundown. Estimation of potential errors using extrapolated data shows that the effective valencies Zi and the corresponding Vi1/2 values may be underestimated by more than ∼30–40% and 3–6 mV, respectively (not shown), in this and other similar studies. The major differences in rectification between E224G and E299S, and wild-type Kir2.1 channels, and thus any major conclusions of this study, are not affected in any significant manner by the above underestimation.
All mutations affected the shallow component 1 (measured at 300 μm Spm), but to different degrees (Fig. 6). In E224G, E299S and F254A mutants, shallow component 1 was nearly abolished (the amplitude was too small to be measured with certainty), in S256I it was barely affected, and in S256K it was reduced, but still clearly present (Fig. 6B). Importantly, in the presence of 300 μm Spm, both E224G and E299S mutants displayed another component which would correspond to component 2 observed at lower [Spm] in wild-type Kir2 channels (Fig. 6B; arrowhead). The V21/2 potential, ∼90 mV, for these mutants was close to the maximum depolarization used in the experimental protocol, while the steep component of rectification was barely affected, assuming the underestimation of V01/2 due to slow blocking kinetics in these mutants (Table 3). In addition, close inspection of F254A records at 300 μm Spm also reveals a relatively small but detectable deviation of the data from a single Boltzmann fit at depolarized potentials (Fig. 6B; arrowhead), which would indicate the presence of an additional component at potentials positive to the steep component 0. Indeed, analysis of relative currents at 30 μm Spm revealed a significant shallow component 2 in F254A channels with V21/2 potential ∼20 mV more positive to that of wild-type Kir2.1 channels, and close to that in Kir2.3 channels (Tables 2 and 4). Consistent with the data at 300 μm Spm, E299S channels displayed an even more prominent component 2 at 30 μm Spm with V21/2 potential ∼100 mV, close to the maximum test potential used in voltage protocols.
Figure 6. Rectification profiles of Kir2.1 mutants.

A, representative current traces for Kir2.1 mutant channels were recorded in inside-out patches at high symmetrical K+ (see Methods) in the presence of 0 and 300 μm Spm. Note the larger time scale for E224G and E299S mutants where currents were recorded with longer voltage steps in order to accommodate slower kinetics of activation, and block at depolarized potentials. B, averaged steady-state relative currents at end of the test pulses (Irel) measured at 300 μm were fitted with a double Boltzmann equation (see Methods), with the exception of F254A that was fitted with a single Boltzmann equation. C, representative relative currents at 30 μm Spm are plotted at log scale to highlight shallow component 2. Due to slow kinetics in E224G and E299S mutants currents were measured at the end 600–800 ms test pulses, while the currents from faster gating F254A, S256I and S256K channels were recorded in response to slow voltage ramps (see Methods). In E224G mutant component 2 could not be fitted with confidence and thus was not determined (n.d.). B and C, fits to Kir2.1 Irel are shown for comparison with each mutant as a fine continuous curve. Arrowheads point to shallow component 2. n = 2–5 (Tables 3 and 4).
Table 3.
Parameters of rectification in mutant Kir2.1 channels at 300 μM spermine
| Z0 | V01/2 | Z1 | V11/2 | Z2 | V21/2 | n | |
|---|---|---|---|---|---|---|---|
| E224G | 2.2 ± 0.2§ | −16.3 ± 0.8§ | n.d. | n.d. | 2.9 ± 0.6 | 88.0 ± 3.0 | 4 |
| E299S | 3.5 ± 0.1§ | −24.9 ± 0.1§ | n.d. | n.d. | 1.9 ± 0.2 | 90.3 ± 0.4 | 2 |
| F254A | 4.2 ± 0.1 | −23.2 ± 0.2 | n.d. | n.d. | n.d. | n.d. | 3 |
| S256I | 4.8 ± 0.3 | −24.2 ± 1.2 | 1.4 ± 0.1 | −54.5 ± 7.1 | n.d. | n.d. | 3 |
| S256K | 5.1 ± 0.2 | −23.1 ± 0.3 | 1.6 ± 0.1 | −45.2 ± 1.8 | n.d. | n.d. | 4 |
;The effective valencies and V01/2 may be underestimated due to slow blocking kinetics by spermine. n.d., not determined, i.e. the fitting protocol did not include the specific parameter.
Table 4.
Parameters of rectification in mutant Kir2.1 channels at 30 μM spermine
| Z0 | V01/2 | Z2 | V21/2 | n | |
|---|---|---|---|---|---|
| WT Kir2.1 | 5.3 ± 0.1 | −8.5 ± 1.0 | 3.3 ± 1.0 | 24.8 ± 1.3 | 3 |
| E299S | 2.8 ± 0.2 | 1.1 ± 1.9 | 1.1 ± 0.3 | 99.3 ± 3.0** | 5 |
| F254A | 5.2 ± 0.1 | −7.1 ± 0.1 | 2.1 ± 0.1 | 45.6 ± 2.5** | 3 |
| S256I | 4.6 ± 0.1 | −7.9 ± 0.3 | 3.7 ± 0.2 | 24.8 ± 0.1 | 2 |
| S256K | 5.6 ± 0.2 | −7.3 ± 0.4 | 3.6 ± 0.7 | 21.3 ± 2.1 | 2 |
Statistical significance relative to wild-type (WT) Kir2.1 channels (P < 0.01). V21/2 potential could not be determined with certainty in E224G channels at 30 μm spermine, and thus data were not included. Experiments for Kir2.1 presented in this table are independent of those in Table 2.
At 30 μm Spm, in S256I channels the V21/2 potential was not significantly different from that in Kir2.1 channels (Fig. 6C), in parallel with only minor changes in the V11/2 potential measured at 300 μm (Fig. 6B). It is important to note that in S256K channels shallow component 2 was not affected in any significant way, while the block at hyperpolarized potentials was measurably relieved, with V11/2 close to that in Kir2.3 channels (Tables 1 and 3).
Altogether the data point to a strong relation between the two shallow components of rectification (see Discussion).
Kir2.3 channels display unique kinetics of activation
Inside-out recordings – high K+
In parallel with the differences in steady-state rectification, unblock (activation) kinetics of Spm were also different between different Kir2 isoforms. Figure 7A shows that activation of Kir2.3 channels at negative membrane potentials is significantly slower than in Kir2.1 (and Kir2.2; not shown) channels. Quantitative analysis using monoexponential fits of current activation shows that the voltage dependence of activation was not significantly different between Kir2 isoforms (Fig. 7B), but the activation time constant (τ) for Kir2.3 channels at −60 mV was ∼7-fold larger than in Kir2.1 channels (Fig. 7C). Kir2.2 channels displayed kinetics of activation that were nearly indistinguishable from those in Kir2.1 channels (Fig. 7B). Importantly, and in contrast to the time course of current activation in the whole-cell configuration under physiological external [K+] (below; Fig. 8), no significant instantaneous component of activation was observed in any of the Kir2 channels.
Figure 7. Differential kinetics of activation in Kir2 channels.

A, representative inside-out current recordings from Kir2.1 and Kir2.3 channels in the presence of 300 μm Spm and high symmetrical [K+] (KINT; see Methods). Monoexponential fits to the time-dependent part of current traces are superimposed, but may not be seen due to overlapping. B, the activation τ for Kir2.x channels was obtained from current tracings as in A using a monoexponential fit and log values plotted against the membrane potential. Continuous lines represent a linear fit to the data. Note the log scale for τ. Kir2.1 and Kir2.2 channels display nearly identical activation times and voltage dependencies, Kir2.1 (▪) and Kir2.2 (⋄) symbols overlap (↑, ↓). Kir2.3 channels activate significantly more slowly and display similar voltage dependence of activation. C, at −60 mV Kir2.3 channels activate ∼7-fold slower than Kir2.1 and Kir2.2 channels. n = 8, 9 and 4 for Kir2.1, Kir2.2 and Kir2.3, respectively. Current activation was evoked using a series of hyperpolarizing steps from a Vh of +50 mV to potentials up to −80 mV.
Figure 8. Activation kinetics of Kir2 channels at physiological extracellular K+.

A, representative whole-cell current recordings from Kir2.1 and Kir2.3 channels in the presence of 5.4 mm extracellular K+ and without Spm in the pipette solution (KINT). Dashes at the beginning of activation of Kir2.3 currents point to a quasi-instantaneous component of activation. Currents were recorded in response to voltage steps from −30 mV holding potential to potentials between −130 and −30 mV in 10 mV increments. Monoexponential fits to the time-dependent part of current traces are superimposed. B, activation τ values for Kir2.x channels were obtained from current tracings as in A using monoexponential fits and log values plotted against the membrane potential. Continuous lines represent a linear fit to the data. Note log scale for τ. C, Kir2.3 channels activate significantly more slowly and display voltage dependence of activation similar to Kir2.1 and Kir2.2 channels. At −115 mV Kir2.3 channels activate ∼16-fold slower than Kir2.1 and Kir2.2 channels. n = 4, 4 and 9 for Kir2.1, Kir2.2 and Kir2.3, respectively.
Whole-cell recordings – low K+
Kinetics of activation of Kir2 channels under conditions of physiological K+ was studied in the whole-cell configuration. Channels were first blocked by a 1000 ms long prepulse to −30 mV, and then activated by a series of hyperpolarizing steps to potentials between −120 and −30 mV (Fig. 8A). Current traces were fitted with a double-exponential function to accommodate a slow ‘inactivation’ observed at far hyperpolarized potentials, and only the activation phase was analysed. Activation of Kir2.3 channels was ∼16-fold slower than that in Kir2.1 or Kir2.2 channels (Fig. 8C), in contrast to a ∼7-fold difference observed in inside-out patches. Kir2.1 and Kir2.2 channel kinetics were not significantly different. The small difference in the slope of the voltage dependence between Kir2.1 and Kir2.2 channels is probably due to voltage errors associated with the higher densities of Kir2.1 currents. Thus, in spite of great differences in the speed of activation between Kir2.3 and Kir2.1/2.2 channels, the voltage dependence of activation was not significantly different between any of them. In experiments when no Spm was added to the pipette (intracellular) solution we also observed a clear outward current transient upon depolarization back to −30 mV, indicating the low intracellular PA content of the HEK 293 cells (not shown).
Another feature of Kir2 channel activation at low extracellular K+ is a prominent quasi-instantaneous phase of current activation (Fig. 8A; not shown for Kir2.2). Most of the quasi-instantaneous component of activation (Ishihara & Ehara, 2004) is not due to partial blocking of the Kir2 channels at the depolarized potentials (Vh=−30 mV). It follows from Fig. 2C that at a −30 mV holding potential the (relative) current is only ∼0.05, while the inward current at −120 mV is more than 0.5 (out of scale), i.e. the potential contribution of unblocked current is about 10% or less. In some cases, 1 mm Spm was added to the pipette solution to minimize washout (very slow) of endogenous Spm. Inclusion of Spm decreases the outward currents at longer times thus minimizing the contribution of the unblocked fraction to the quasi-instantaneous component of activation even further. Specifically, for the representative Kir2.3 experiment in Fig. 8 the amplitude of the unblocked current at a −30 mV holding potential was only ∼45 pA while the quasi-instantaneous component at −120 mV is about 1000 pA, more than 50-fold difference (2% error). With the concentration of Spm used in this study, more than 95% of Kir2.3 channels, and an even higher fraction of Kir2.1 and Kir2.2 channels, are blocked at −30 mV. This quasi-instantaneous phase was not diminished by including 10 mm EDTA in the patch pipette or by longer perfusion times, suggesting that it is not due to the presence of Mg2+ ions or low molecular weight PAs such as putrescine. At potentials 30 mV negative to the reversal potential (i.e. at −105 mV), the instantaneous component accounted for 30–50% of the total current amplitude in all Kir2 channels.
Discussion
Substantial efforts have been made in the past to characterize numerous properties of different Kir2 channels, but only recently has attention begun to focus on the most defining property of these channels: PA-induced rectification. This study has been driven primarily by unusual and sometimes controversial data surrounding Kir2.3 channels. Specifically, it has been reported (Dhamoon et al. 2004; Dhamoon & Jalife, 2005) that, in contrast to Kir2.1 channels, Kir2.3 channels do not display a classical ‘crossover’ effect (Fig. 3A–C) upon an increase in extracellular K+. The ‘crossover’ effect originates from a characteristic region of negative slope conductance and, in particular, the increase in the peak outward current.
In this study, we have carried out a detailed analysis of Spm-induced steady-state rectification and kinetics of activation in three Kir2 channels which are believed to underlie cardiac IK1.
Differential properties of steady-state PA-induced rectification in Kir2 channels
Our initial experiments focused on the rectification profile of Kir2 channels negative to EK in the presence of high extracellular K+ and high concentration of Spm. It has been shown that in Kir2.1 and Kir2.3 channels block by Spm under these conditions is characterized by two distinct components, steep (component 0) and shallow (component 1) (Lopatin et al. 1995; Xie et al. 2002). The shallow and steep components are believed to correspond to the Spm molecule blocking at, or near, two distinct sites in the channel pore: a cluster of negatively charged residues in the cytoplasmic vestibule (E224, E299) (Yang et al. 1995; Kubo & Murata, 2001), and the ‘rectification controller’ deep in the pore (D172) (Stanfield et al. 1994). All reported critical residues underlying the shallow binding site 1, including recently identified additional residues F254, D255, D259 and M301 (Pegan et al. 2005; Shin et al. 2005), are highly conserved in Kir2 channels, suggesting that they should all display similar binding properties for Spm at this shallow site. Yet, the data in Fig. 1 prove otherwise: Spm block at shallow site 1 is more potent in Kir2.2 and less potent in Kir2.3, implying that other not yet identified structures are involved in the formation of the shallow outer binding site. Much smaller, yet significant, differences are also observed in the steep component of rectification (V01/2, Z0). Notably (i) the effective valency Z0 of Spm block is highest in Kir2.2 channels, and (ii) the voltage of half-block V01/2 in Kir2.3 channels is shifted to negative potentials by 1–2 mV compared to that in Kir2.1 and Kir2.2 channels. The latter property is also confirmed by data in Fig. 3D and F and Table 2 summarizing the results obtained at a lower Spm concentration.
To better characterize the outward currents at potentials positive to EK we measured Kir2 currents in outside-out patches at lower concentrations of Spm. One of the most important findings of this study was that all Kir2 channels, including Kir2.3, displayed a classical ‘crossover’ effect originating from a clear region of negative slope conductance, as well as an increase of the peak outward current upon an increase in extracellular K+. The ‘crossover’ effect is a hallmark of classical strong inward rectifier channels (Noble, 1965), and has also been observed in cloned Kir2.1 channels (Ishihara, 1997). A controversy surrounds Kir2.3 channels, which are believed to contribute to the atrial inward rectifier current IK1 in several species (Melnyk et al. 2002; Dhamoon et al. 2004). The prominent feature of atrial IK1 is a small, or nearly absent, region of negative slope conductance. A recent study by Dhamoon et al. (2004) has addressed this issue by comparing the rectification properties of atrial IK1 and that of Kir2 channels. The authors utilized whole-cell patch-clamp recordings to observe outward currents in cultured cells expressing different Kir2 channels and found that the rectification profile of Kir2.3 channels was similar to that of sheep atrial IK1. Specifically, the authors found that Kir2.3 channels do not rectify completely and do not display a ‘crossover’ effect upon an increase in extracellular K+. While the weak rectification may be well explained by the presence of unknown endogenous factors important for physiological functioning of Kir2 channels, we first wanted to assess the properties of Kir2 channels in a more controlled environment. In this study, we attempted to overcome some limitations and uncertainties of whole-cell recordings by (i) using an outside-out configuration to achieve complete control over ionic composition on both sides of the membrane, (ii) boosting channel expression by adding 5 mm sodium butyrate during channel expression, and (iii) using YFP-tagged Kir2.3 channels to identify highly expressing cells. C-terminus YFP or GFP attachments to Kir2 channels do not affect rectification properties in any significant way in all settings tested so far (see footnote to Table 1). The above improvements allowed us to obtain Kir2.3 current densities reaching a few hundred picoamps at −100 mV, at 5.4 mm extracellular K+, in outside-out patches, compared with similar current amplitudes recorded from the whole cell in the study by Dhamoon et al. (2004).
Further quantification of outward Kir2 currents revealed a number of important differences and similarities between different channel isoforms. Qualitatively, at low (physiological) levels of Spm, all Kir2 channels displayed two components of block, characterized by corresponding effective valencies (Z0, Z2), and corresponding voltages for half-block (V01/2, V21/2). The properties of shallow component 2 (V21/2 and Z2 in this study) were recently addressed in Kir2.1 channels (Guo & Lu, 2000; Ishihara & Ehara, 2004; Yan & Ishihara, 2005), but the exact mechanisms underlying the phenomenon remain controversial. For example, Guo & Lu (2000) provided evidence that the two components of PA block correspond to different protonation states of PAs. Ishihara & Ehara (2004) argue instead that Kir2.1 channels exist as two populations with different sensitivities to PAs. Quantitative analysis in this study shows that the properties of both steep and shallow components are significantly different between Kir2 channels. Kir2.3 channels are at the far end of the distribution, displaying the largest separation voltages between the steep component and shallow component 2, d2,0=V21/2−V01/2. Taken together with the lowest effective valency Z2 of shallow component 2 (Table 2), the latter leads to an unusual pattern of outward currents (Fig. 3C), quite different from that in Kir2.1 and Kir2.2 channels. Kir2.2 channels, on the contrary, display the smallest separation between the two components, as well as the highest effective valency for the steep component Z0. On the other hand, the relative amplitude of shallow component 2 was similar in all channels: 11%, 13% and 11% for Kir2.1, Kir2.2 and Kir2.3, respectively, similar to that reported by Ishihara & Ehara (2004) in Kir2.1 channels.
Another finding important for the further understanding of the mechanism underlying modal block by Spm is that both the shallow (component 2) and the steep (0) components displayed a nearly identical dependence on extracellular K+ (Lopatin & Nichols, 1996b) (Fig. 3E and F), with corresponding voltages for half-block being directly proportional to Erev with a slope factor of ∼1.0 (Table 2).
It is also noteworthy to mention several other intriguing relationships between the parameters of rectification and/or conduction in different Kir2 channels. For example, the separation voltages between the two shallow components 1 and 2, and the steep component are directly proportional to the slope factor ∼1.0 (Fig. 9B). Since the V01/2 voltages for different Kir2 channels are nearly the same, the other interpretation of the above data would lead to the following relation: V21/2−V11/2= constant. This relationship is not unique for any specific [Spm]. Since in all Kir2 channels both V21/2 and V11/2 display a similar dependence on [Spm] (Fig. 9A), the above relationship holds at any combination of [Spm] used to estimate V21/2 and V11/2 potentials (as observed in Fig. 9B). Surprisingly, the two components of block were never considered to be related. Component 1 is observed at high [Spm] and commonly assigned to block (Yang et al. 1995; Kubo & Murata, 2001) or a charge screening (Xie et al. 2002) at the E224/E299 cluster (Fig. 5). Component 2 is observed at low [Spm], and explained either via the block by partially de-protonated Spm (Guo & Lu, 2000), or by the existence of two populations of channels (or two modes of a channel) with low and high sensitivity to Spm (Ishihara & Ehara, 2004). The effective valencies of block for the two shallow components are different because these parameters are estimated in different conditions (Spm concentration and membrane potential), but the above nearly direct relationship between V21/2 and V11/2 is the strong experimental evidence that both components are the result of block at a common site. There is little doubt that the E224/E299 cluster contributes to component 1, while there is no solid evidence for any of the two different mechanisms mentioned above for component 2. Therefore, even though V11/2 and V21/2 voltages describe seemingly different properties of Kir2 channels obtained under quite different experimental conditions, the data strongly argue that both shallow components reflect the block at or near the E224/E299 cluster of negatively charged residues. To gain further support for this hypothesis we carried out an analysis of the relationship between the two components of block in a number of Kir2.1 mutants, including E224G and E299S substitutions. Charge neutralization at indicated positions leads to the most dramatic changes in rectification compared to other mutations. Specifically, in E224G and E299S channels, component 1 can no longer be reliably measured even at 300 μm Spm, and instead, a prominent component 2 with highly positive V21/2 (Table 3) is now clearly observed (Fig. 6B). Another striking result is that the steep component 0 is virtually unaffected in E299S, and probably not changed in the E224G mutant if one assumes underestimation of V01/2 due to experimental limitations. Another support for the tight relationship between components 1 and 2 comes from F254A mutant (Fig. 5): a ‘milder’, zero charge, mutation leads to a significant (∼20 mV) shift in V21/2 (compared to wild-type Kir2.1; Fig. 6C), as well as for a significant reduction of block at hyperpolarized potentials (shallow component 1) but no significant change in the steep component 0 (Fig. 6B).
We have also attempted to expand the search for residues involved in the shallow component of rectification by testing two previously undescribed mutations near the narrow part of the pore. S256 in Kir2.1 is not conserved in other members of the subfamily and we thought that this residue might underlie at least some differences between Kir2 channels (Fig. 5). We hypothesized that S256I and S256K mutations would, respectively, reduce and increase Spm block at hyperpolarized potentials (i.e. to ‘convert’ Kir2.1 channels into Kir2.3 and Kir2.2). The S256I mutation indeed caused a small (although not significant) shift of both V11/2, and V21/2 in a depolarized direction. Nevertheless, the S256K mutation did not support the above hypothesis. Similar to the S256I mutation it led to a relief of block at negative potentials but with no change in the V21/2 shallow component 2 (Fig. 6). Thus, although most of the evidence points to a strong relationship between components 1 and 2, the above data indicate that some regions of the shallow site may contribute differently to components 1 and 2 of block.
A number of other experimental studies also strongly support the idea that the same cluster of negatively charged residues is an essential regulator of the pore conductance (Kubo & Murata, 2001; Xie et al. 2002; Chang et al. 2005). Charge neutralization at the indicated sites leads to a reduced single-channel conductance and concurrent reduction of shallow component 1 of rectification. Figure 9C shows that in Kir2 channels, single-channel conductance is directly proportional to the voltage of half-block for shallow component 1 (and also component 2) V11/2, with a coefficient of proportionality ‘k’ close to one. It is plausible that the above relation is not coincidental, and that a differential electronegativity at the shallow sites in different Kir channels underlies the Vi1/2 of the shallow components and single-channel conductance as well. The data in this study show that although well-characterized residues E224 and E299 are important elements of the shallow site, not all the data can be explained solely by their effect. In line with this, Pegan et al. (2005) have recently shown that an additional di-aspartate cluster D255/D259 in the cytoplasmic vestibule of Kir2.1 channels is also involved in rectification. Further studies will be necessary to understand the contribution of this cluster to shallow components 1 and 2. Since the latter residues are also conserved in all Kir2 channels, our data and the above hypothesis would lead to a conclusion that there are even more, yet unidentified, residues which contribute to differential PA sensitivity in Kir2 channels.
Kinetic properties of activation in Kir2 channels
Although the data pointing to the unusually slow activation kinetics of Kir2.3 channels can be traced to early literature on PA-induced rectification (Lopatin et al. 1995; Lopatin & Nichols, 1996b), it is only recently that attention has begun to shift to this phenomenon in an attempt to employ specific properties of Kir2.3 channels in characterizing the underlying molecular correlates of the cardiac current IK1. Recently, Yan et al. (2005) have compared the whole-cell activation kinetics of Kir2 channels exposed to physiological extracellular K+. The authors found that the time constants of the Kir2.3 channel activation were ∼10-fold greater than those of Kir2.1 and Kir2.2 which activated at similar rates (with Kir2.2 being approximately twice faster). Our results (Fig. 7) are in qualitative agreement with the data by Yan et al. (2005), although some quantitative, not principal, differences exist.
A novel property of Kir2 channel activation which has recently been brought to attention by Ishihara & Ehara (2004) is the presence of a so-called pseudo-instantaneous phase followed by a characteristic monoexponential current increase. A similar phenomenon has been observed in early studies of inward rectification in native classical strong inward rectifier channels of starfish eggs (Hagiwara et al. 1976) and frog skeletal muscles (Leech & Stanfield, 1981), as well as in original cell-attached recordings of cloned Kir2.3 channels expressed in Xenopus oocytes (Lopatin et al. 1995). While in early classical studies the origin of the pseudo-instantaneous component could be explained, at least partially, by the fact that the holding potential was set to the resting membrane potential (at which not all Kir channels are blocked), or by the presence of Mg2+ ions and low molecular weight polyamines (putrescine, which unblocks nearly instantaneously), the instantaneous activation reported by Ishihara & Ehara (2004) represents a truly novel phenomenon. In the study mentioned above, the instantaneous activation was observed in Kir2.1 channels at a high concentration of extracellular K+ (∼0 mV reversal potential), with far depolarized holding potentials, where the block is nearly 100% complete, and in the presence of Spm only. The relative amplitude of the instantaneous component was shown to be rather small (∼10% in the presence of Spm) and corresponded to the proportion of channels in a ‘low affinity mode’ (equivalent to a fraction of the shallow component 2 in this study).
In our study, the instantaneous phase was hardly resolvable in all Kir2 channels in inside-out patches exposed to high extracellular K+ (Fig. 7), but became more evident in whole-cell recordings when the membrane was exposed to low extracellular K+ (Fig. 8A). The relative amplitude of the instantaneous component was about ∼30–50% in both Kir2.1 and Kir2.3, significantly greater than that estimated by Ishihara & Ehara (2004) for Kir2.1 channels at high K+, and also significantly greater than ∼10–13% found for shallow component 2 in outside-out patches. The discrepancy between our data and that of Ishihara & Ehara (2004) is furthered by the seemingly absent instantaneous component in Kir2.1 channels expressed in Xenopus oocytes (Shin & Lu, 2005). The exact mechanistic understanding of this phenomenon remains unclear, and will therefore have to be addressed by further studies.
Acknowledgments
This study was supported by RO1 HL69052 grant from the NHBLI (A.N.L.) and T-32 G008322 training grant from the NIH (B.K.P.). The authors would like to thank Meredith McLerie (University of Michigan) for excellent technical support during the whole course of the project, and invaluable assistance in preparation of the manuscript.
References
- Chang HK, Yeh SH, Shieh RC. A ring of negative charges in the intracellular vestibule of Kir2.1 channel modulates K+ permeation. Biophys J. 2005;88:243–254. doi: 10.1529/biophysj.104.052217. [DOI] [PMC free article] [PubMed] [Google Scholar]
- Dhamoon AS, Jalife J. The inward rectifier current (IK1) controls cardiac excitability and is involved in arrhythmogenesis. Heart Rhythm. 2005;2:316–324. doi: 10.1016/j.hrthm.2004.11.012. [DOI] [PubMed] [Google Scholar]
- Dhamoon AS, Pandit SV, Sarmast F, Parisian KR, Guha P, Li Y, Bagwe S, Taffet SM, Anumonwo JM. Unique Kir2.x properties determine regional and species differences in the cardiac inward rectifier K+ current. Circ Res. 2004;94:1332–1339. doi: 10.1161/01.RES.0000128408.66946.67. [DOI] [PubMed] [Google Scholar]
- Fakler B, Brandle U, Glowatzki E, Weidemann S, Zenner HP, Ruppersberg JP. Strong voltage-dependent inward rectification of inward rectifier K+ channels is caused by intracellular spermine. Cell. 1995;80:149–154. doi: 10.1016/0092-8674(95)90459-x. [DOI] [PubMed] [Google Scholar]
- Ficker E, Taglialatela M, Wible BA, Henley CM, Brown AM. Spermine and spermidine as gating molecules for inward rectifier K+ channels. Science. 1994;266:1068–1072. doi: 10.1126/science.7973666. [DOI] [PubMed] [Google Scholar]
- Guo D, Lu Z. Mechanism of IRK1 channel block by intracellular polyamines. J Gen Physiol. 2000;115:799–814. doi: 10.1085/jgp.115.6.799. [DOI] [PMC free article] [PubMed] [Google Scholar]
- Guo D, Lu Z. IRK1 inward rectifier K+ channels exhibit no intrinsic rectification. J Gen Physiol. 2002;120:539–551. doi: 10.1085/jgp.20028623. [DOI] [PMC free article] [PubMed] [Google Scholar]
- Guo D, Ramu Y, Klem AM, Lu Z. Mechanism of rectification in inward-rectifier K+ channels. J Gen Physiol. 2003;121:261–275. doi: 10.1085/jgp.200208771. [DOI] [PMC free article] [PubMed] [Google Scholar]
- Hagiwara S, Miyazaki S, Rosenthal NP. Potassium current and the effect of cesium on this current during anomalous rectification of the egg cell membrane of a starfish. J Gen Physiol. 1976;67:621–638. doi: 10.1085/jgp.67.6.621. [DOI] [PMC free article] [PubMed] [Google Scholar]
- Hamill OP, Marty A, Neher E, Sakmann B, Sigworth FJ. Improved patch-clamp techniques for high-resolution current recording from cells and cell-free membrane patches. Pflugers Arch. 1981;391:85–100. doi: 10.1007/BF00656997. [DOI] [PubMed] [Google Scholar]
- Ishihara K. Time-dependent outward currents through the inward rectifier potassium channel IRK1. The role of weak blocking molecules. J Gen Physiol. 1997;109:229–243. doi: 10.1085/jgp.109.2.229. [DOI] [PMC free article] [PubMed] [Google Scholar]
- Ishihara K, Ehara T. Two modes of polyamine block regulating the cardiac inward rectifier K+ current IK1 as revealed by the study of Kir2.1 channel. J Physiol. 2004;556:61–78. doi: 10.1113/jphysiol.2003.055434. [DOI] [PMC free article] [PubMed] [Google Scholar]
- Ishihara K, Mitsuiye T, Noma A, Takano M. The Mg2+ block and intrinsic gating underlying inward rectification of the K+ current in guinea-pig cardiac myocytes. J Physiol. 1989;419:297–320. doi: 10.1113/jphysiol.1989.sp017874. [DOI] [PMC free article] [PubMed] [Google Scholar]
- Kubo Y, Murata Y. Control of rectification and permeation by two distinct sites after the second transmembrane region in Kir2.1 K+ channel. J Physiol. 2001;531:645–660. doi: 10.1111/j.1469-7793.2001.0645h.x. [DOI] [PMC free article] [PubMed] [Google Scholar]
- Leech CA, Stanfield PR. Inward rectification in frog skeletal muscle fibres and its dependence on membrane potential and external potassium. J Physiol. 1981;319:295–309. doi: 10.1113/jphysiol.1981.sp013909. [DOI] [PMC free article] [PubMed] [Google Scholar]
- Liu GX, Derst C, Schlichthorl G, Heinen S, Seebohm G, Bruggemann A, Kummer W, Veh RW, Daut J, Preisig-Muller R. Comparison of cloned Kir2 channels with native inward rectifier K+ channels from guinea-pig cardiomyocytes. J Physiol. 2001;532:115–126. doi: 10.1111/j.1469-7793.2001.0115g.x. [DOI] [PMC free article] [PubMed] [Google Scholar]
- Lopatin AN, Makhina EN, Nichols CG. Potassium channel block by cytoplasmic polyamines as the mechanism of intrinsic rectification. Nature. 1994;372:366–369. doi: 10.1038/372366a0. [DOI] [PubMed] [Google Scholar]
- Lopatin AN, Makhina EN, Nichols CG. The mechanism of inward rectification of potassium channels: ‘long-pore plugging’ by cytoplasmic polyamines. J Gen Physiol. 1995;106:923–955. doi: 10.1085/jgp.106.5.923. [DOI] [PMC free article] [PubMed] [Google Scholar]
- Lopatin AN, Nichols CG. [K+] dependence of open-channel conductance in cloned inward rectifier potassium channels (IRK1, Kir2.1) Biophys J. 1996a;71:682–694. doi: 10.1016/S0006-3495(96)79268-8. [DOI] [PMC free article] [PubMed] [Google Scholar]
- Lopatin AN, Nichols CG. [K+] dependence of polyamine-induced rectification in inward rectifier potassium channels (IRK1, Kir2.1) J Gen Physiol. 1996b;108:105–113. doi: 10.1085/jgp.108.2.105. [DOI] [PMC free article] [PubMed] [Google Scholar]
- Lopatin AN, Nichols CG. Inward rectifiers in the heart: an update on IK1. J Mol Cell Cardiol. 2001;33:625–638. doi: 10.1006/jmcc.2001.1344. [DOI] [PubMed] [Google Scholar]
- McLerie M, Lopatin AN. Dominant-negative suppression of IK1 in the mouse heart leads to altered cardiac excitability. J Mol Cell Cardiol. 2003;35:367–378. doi: 10.1016/s0022-2828(03)00014-2. [DOI] [PubMed] [Google Scholar]
- Melnyk P, Zhang L, Shrier A, Nattel S. Differential distribution of Kir2.1 and Kir2.3 subunits in canine atrium and ventricle. Am J Physiol Heart Circ Physiol. 2002;283:H1123–H1133. doi: 10.1152/ajpheart.00934.2001. [DOI] [PubMed] [Google Scholar]
- Moyer BD, Loffing J, Schwiebert EM, Loffing-Cueni D, Halpin PA, Karlson KH, Ismailov II, Guggino WB, Langford GM, Stanton BA. Membrane trafficking of the cystic fibrosis gene product, cystic fibrosis transmembrane conductance regulator, tagged with green fluorescent protein in Madin-Darby canine kidney cells. J Biol Chem. 1998;273:21759–21768. doi: 10.1074/jbc.273.34.21759. [DOI] [PubMed] [Google Scholar]
- Noble D. Electrical properties of cardiac muscle attributable to inward going (anomalous) rectification. J Cell Comp Physiol. 1965;66:127–136. [Google Scholar]
- Panama B, McLerie M, Lopatin AN. Differential spermine sensitivity in Kir2 inward rectifier potassium channels. Biophysical Society 48th Annual Meeting, Biophysical Journal 2004 Abstracts issue. 2004:125a. Pos-657/B467. [Google Scholar]
- Pegan S, Arrabit C, Zhou W, Kwiatkowski W, Collins A, Slesinger PA, Choe S. Cytoplasmic domain structures of Kir2.1 and Kir3.1 show sites for modulating gating and rectification. Nat Neurosci. 2005;8:279–287. doi: 10.1038/nn1411. [DOI] [PubMed] [Google Scholar]
- Schram G, Pourrier M, Wang Z, White M, Nattel S. Barium block of Kir2 and human cardiac inward rectifier currents: evidence for subunit-heteromeric contribution to native currents. Cardiovasc Res. 2003;59:328–338. doi: 10.1016/s0008-6363(03)00366-3. [DOI] [PubMed] [Google Scholar]
- Shin HG, Lu Z. Mechanism of the voltage sensitivity of IRK1 inward-rectifier K+ channel block by the polyamine spermine. J Gen Physiol. 2005;125:413–426. doi: 10.1085/jgp.200409242. [DOI] [PMC free article] [PubMed] [Google Scholar]
- Shin HG, Xu Y, Lu Z. Evidence for sequential ion-binding loci along the inner pore of the IRK1 inward-rectifier K+ channel. J Gen Physiol. 2005;126:123–135. doi: 10.1085/jgp.200509296. [DOI] [PMC free article] [PubMed] [Google Scholar]
- Stanfield PR, Davies NW, Shelton PA, Sutcliffe MJ, Khan IA, Brammar WJ, Conley EC. A single aspartate residue is involved in both intrinsic gating and blockage by Mg2+ of the inward rectifier, IRK1. J Physiol. 1994;478:1–6. doi: 10.1113/jphysiol.1994.sp020225. [DOI] [PMC free article] [PubMed] [Google Scholar]
- Taglialatela M, Ficker E, Wible BA, Brown AM. C-terminus determinants for Mg2+ and polyamine block of the inward rectifier K+ channel IRK1. EMBO J. 1995;14:5532–5541. doi: 10.1002/j.1460-2075.1995.tb00240.x. [DOI] [PMC free article] [PubMed] [Google Scholar]
- Xie LH, John SA, Weiss JN. Spermine block of the strong inward rectifier potassium channel kir2.1: dual roles of surface charge screening and pore block. J Gen Physiol. 2002;120:53–66. doi: 10.1085/jgp.20028576. [DOI] [PMC free article] [PubMed] [Google Scholar]
- Yan DH, Ishihara K. Two Kir2.1 channel populations with different sensitivities to Mg2+ and polyamine block: a model for the cardiac strong inward rectifier K+ channel. J Physiol. 2005;563:725–744. doi: 10.1113/jphysiol.2004.079186. [DOI] [PMC free article] [PubMed] [Google Scholar]
- Yan DH, Nishimura K, Yoshida K, Nakahira K, Ehara T, Igarashi K, Ishihara K. Different intracellular polyamine concentrations underlie the difference in the inward rectifier K+ currents in atria and ventricles of the guinea-pig heart. J Physiol. 2005;563:713–724. doi: 10.1113/jphysiol.2004.077677. [DOI] [PMC free article] [PubMed] [Google Scholar]
- Yang J, Jan YN, Jan LY. Control of rectification and permeation by residues in two distinct domains in an inward rectifier K+ channel. Neuron. 1995;14:1047–1054. doi: 10.1016/0896-6273(95)90343-7. [DOI] [PubMed] [Google Scholar]
- Zaritsky J, Redell J, Tempel B, Schwarz T. The consequences of disrupting cardiac inwardly rectifying K+ current (IK1) as revealed by the targeted deletion of the murine Kir2.1 and Kir2.2 genes. J Physiol. 2001;533:697–710. doi: 10.1111/j.1469-7793.2001.t01-1-00697.x. [DOI] [PMC free article] [PubMed] [Google Scholar]
- Zobel C, Cho HC, Nguyen TT, Pekhletski R, Diaz RJ, Wilson GJ, Backx PH. Molecular dissection of the inward rectifier potassium current (IK1) in rabbit cardiomyocytes: evidence for heteromeric co-assembly of Kir2.1 and Kir2.2. J Physiol. 2003;550:365–372. doi: 10.1113/jphysiol.2002.036400. [DOI] [PMC free article] [PubMed] [Google Scholar]