

Abstract
The ATP hydrolysis rate and shortening velocity of muscle are load-dependent. At the molecular level, myosin generates force and motion by coupling ATP hydrolysis to lever arm rotation. When a laser trap was used to apply load to single heads of expressed smooth muscle myosin (S1), the ADP release kinetics accelerated with an assistive load and slowed with a resistive load; however, ATP binding was mostly unaffected. To investigate how load is communicated within the motor, a glycine located at the putative fulcrum of the lever arm was mutated to valine (G709V). In the absence of load, stopped-flow and laser trap studies showed that the mutation significantly slowed the rates of ADP release and ATP binding, accounting for the ∼270-fold decrease in actin sliding velocity. The load dependence of the mutant's ADP release rate was the same as that of wild-type S1 (WT) despite the slower rate. In contrast, load accelerated ATP binding by ∼20-fold, irrespective of loading direction. Imparting mechanical energy to the mutant motor partially reversed the slowed ATP binding by overcoming the elevated activation energy barrier. These results imply that conformational changes near the conserved G709 are critical for the transmission of mechanochemical information between myosin's active site and lever arm.
INTRODUCTION
Smooth muscle myosin II is a molecular motor that hydrolyzes ATP to generate force and motion as it cyclically interacts with actin. Because the rate of heat liberation (i.e., ATPase rate) in muscle is dependent on load (1), it is assumed that one or more steps in the actomyosin ATPase cycle are load-sensitive (Fig. 1 a). Myosin is weakly bound to actin when either ATP or the products of hydrolysis (ADP and Pi) are in the active site. Before or concomitant with Pi release, myosin converts to a strongly bound state, while undergoing its power stroke, which involves a rotation of its α-helical neck or lever arm. ADP is then released to form a “rigor” state. On ATP binding, myosin dissociates from actin, the power stroke is reprimed, and a new cycle begins. The focus of this study is to understand which of these transitions is modulated by load and the structural basis by which physical forces alter the kinetics of nucleotide transitions at the active site.
FIGURE 1.

Myosin mechanochemistry and structure. (a) A schematic representation of the actomyosin ATPase cycle as described in the text. (b) The position of the G709V mutation and key components for myosin structural and mechanical communication are shown. Gly709 (space filled) is positioned between the SH1 and SH2 helices (cyan) that abut the relay helix (yellow). Changes in the nucleotide state within the nucleotide binding pocket or active site cause structural changes in the relay helix that are transmitted to the converter domain, resulting in a swing of the lever arm. Gly709 may function as a fulcrum for this rotation.
Myosin's catalytic domain contains structural elements (switch I, switch II, P-loop) that respond to the state of the nucleotide at the active site (2). Movements of these elements during ATP hydrolysis (see Fig. 1 b) are amplified and transmitted to the ends of the molecule so that the motor's affinity for actin and its lever arm position are affected (3,4). For load applied to the end of the lever arm to have an effect on the rates of nucleotide transitions in the active site, a communication pathway must exist between these two domains. The SH1 and SH2 helices may provide this critical link by acting as a fulcrum about which the lever arm rotates (5,6). A number of biochemical, biophysical, and structural studies (6–11) suggest that a highly conserved glycine (G709 in smooth muscle numbering, G699 for skeletal) that separates the SH1 and SH2 helices may act as the hinge within this putative fulcrum. Therefore, we investigated the role of this residue in the transmission of load from the lever arm to the active site by mutating the glycine to valine (G709V) in an expressed single-headed smooth muscle myosin II (subfragment 1, S1).
The rates of ADP release, ATP binding, and actin translocation velocity are dramatically slowed for the G709V mutant compared with the wild type (WT). These results indicate that the mutant molecule, although functional, has severely impaired activities. To assess the role of this residue in coupling the active site to the lever arm, load was applied to single motor molecules using the laser trap. The kinetics of ADP release for both WT and mutant S1 were dependent on load, with resistive loads slowing and assistive loads accelerating ADP release. In the WT motor, the rate of ATP binding was minimally affected by load. In contrast, the mutant's slow ATP-binding rate was accelerated ∼20-fold by load regardless of the direction in which it was applied, resulting in a partial reversal of the mutant phenotype. The implications of these observations to our understanding of how molecular motions are linked to catalytic activity are discussed.
MATERIALS AND METHODS
Protein engineering, expression, and purification
A smooth muscle myosin S1–biotin construct was prepared by cloning an 88–amino acid sequence segment from the Escherichia coli biotin carboxyl carrier protein (12) after the N-terminal 855 amino acids of the smooth-muscle myosin heavy chain. The sequence of the joining region is QVTR-LEI-SMEA, where LEI is a linker. The construct also contained a C-terminal FLAG tag to facilitate purification. G709 of this construct was mutated to valine to produce S1-bio-G709V. During expression in Sf9 cells, the biotin carboxyl carrier protein is biotinylated at a lysine residue located 35 amino acids from the C-terminus of the fusion protein (12).
Recombinant baculoviruses encoding S1 fragments were prepared by conventional methods. Sf9 cells were coinfected with virus encoding the S1 heavy chain and a separate virus encoding for both the smooth muscle myosin essential and regulatory light chains (13). Sf9 cell growth medium was supplemented with 0.2 mg/ml biotin. Sf9 cells were harvested 3 days after infection and sonicated in a buffer containing 0.3 M NaCl, 1 mM EGTA, 10 mM sodium phosphate (pH 7.4), 5 mM MgCl2, 7% sucrose, and 1 mM NaN3. The lysate was then clarified with 2 mM MgATP present and applied to an anti-FLAG affinity column (M2 Antibody, Sigma-Aldrich Chemical, St. Louis, MO). Once washed, the protein was eluted using a large molar excess of FLAG peptide (0.1 mg/ml), and peak fractions were pooled.
Transient kinetics
Kinetic experiments were performed in 10 mM HEPES, pH 7.0, 0.1 M NaCl, 5 mM MgCl2, 1 mM EGTA, 1 mM NaN3, and 1 mM DTT and at 20°C unless noted otherwise. Nucleotide stocks were prepared with an equimolar amount of magnesium. The rate of ADP release from actoS1 was measured by mixing an actoS1·ADP complex (0.8 μM actin, 0.6 μM S1, 100 μM MgADP) with 2 mM MgATP in a Kin-Tek SF-2002 stopped-flow spectrophotometer. The rate of dissociation of actoS1 (0.7 μM actin, 0.5 μM S1) by MgATP was measured by mixing actoS1 with varying concentrations of MgATP. For both experiments, excitation was at 295 nm (10-nm slit width), and emission was monitored using a 295-nm interference filter. Data from at least four independent mixings were averaged together for each condition before the data were fitted to an exponential, using Kin-Tek software.
Standard laser trap assay buffers
The assay buffer used contained 25 mM KCl; 1 mM EGTA; 10 mM DTT; 4 mM MgCl2; 0.25 μg ml−1 glucose oxidase; 45 μg ml−1 catalase; 5.75 μg ml−1 glucose; and 25 mM imidazole, pH 7.4. The buffer was supplemented with ATP to the concentration stated in each experiment. All experiments were performed at ∼20°C.
Laser trap and actin velocity measurements
The laser trap assay was conducted using the experimental setup described previously (14). To construct the three-bead assay, silica beads (1 μm diameter, Bangs Laboratories, Fishers, IN) were coated with N-ethylmaleimide (NEM)-myosin by incubating overnight at room temperature in 1.4 mg/ml NEM-myosin solution. Flow cells were constructed as outlined previously (14,15). Solutions were added to the flow cell in the following order: 1), 20 μl of 10 mg ml−1 neutravidin (Invitrogen, Carlsbad, CA) for 1 min; 2), 20 μl S1-biotin-myosin (between 0.01 and 0.1μg ml−1 to ensure that only a single myosin molecule interacts with the actin filament) for 1 min; 3), 100 μl 0.5 mg ml−1 bovine serum albumin for >4 min; 4), 100 μl assay buffer; 5), 10 μl NEM-myosin-coated beads, tetramethylrhodamine isothiocyanate phalloidin-labeled actin in assay buffer. Two traps were created, and a single NEM-myosin coated silica bead was captured in each trap. With actin filaments floating in solution, the microscope stage was then maneuvered so that the free ends of the actin filament were attached to the beads within the traps. The actin was then pretensioned to at least 4 pN by adjusting the separation between traps. This bead-actin-bead assembly was lowered onto a bead that was fixed to the flow cell surface and sparsely coated with S1-biotin-myosin (Fig. 2 a).
FIGURE 2.

Application of load to myosin in the laser trap. (a) Rapid load-clamp experimental setup. Before myosin binding, the left trap is oscillated at 1 kHz, and the amplitude of the transmitted oscillation to the right bead through actin is monitored by an analog circuit. On myosin binding, the transmitted oscillation is reduced until a user-set threshold is crossed, at which point the computer imposes a constant load. (b) An example of a rapid load-clamp data trace: (i) baseline, actin filament is oscillated before myosin attachment; (ii) myosin attaches and displaces the actin filament; once detected, the left trap is no longer oscillated, and the load is applied after a user-defined delay; (iii) load is applied; (iv) myosin detaches from actin, with no resistance to the load clamp, and the bead-actin-bead assembly moves rapidly until a preset stop position is encountered. After 100 ms, the bead-actin-bead assembly is returned to its baseline position and the oscillations resumed (i). The upper trace represents the oscillation of the left trap and is shown with arbitrary units.
Displacement records were digitized at 4 kHz. Myosin strong binding interactions with actin caused a drop in bead position variance as a result of the addition of myosin stiffness to the system (16,17). This was used to mark the beginning and end of events from which the event durations, ton, and displacements, d, were extracted (18).
High-resolution actin filament velocity measurements were made in the laser trap using the three-bead assay described above but at saturating myosin surface density (100 μg ml−1) (19). In addition a load-clamp of 1 pN was applied to stabilize the feedback; this load was considered insignificant given its distribution over all of the attached myosin molecules (estimated to be ∼50 motors (20)). Actin filament velocity measured for WT used the conventional in vitro motility assay (21) at 1 mM ATP with 100 μg ml−1 WT S1 applied to the same surface coatings as described above for the laser trap assay.
Load clamp
To apply a constant load (i.e., load clamp) to the attached myosin molecule, we took advantage of the laser trap's spring-like characteristics and thus set and maintained the bead-actin-bead assembly at a fixed position relative to the right laser trap center. This was achieved through computer control of an acoustooptic deflector that set the laser beam position with microsecond resolution. The algorithm that created the load clamp required calibration of the quadrant photodiode position detector (QD) and trap stiffnesses. These calibrations were performed once the bead-actin-bead assembly was formed and lowered to a depth within the flow cell at which the experimental measurements were to occur. First, we determined the response of the QD to bead displacement. We then measured the combined stiffness of both traps, ktrap (nm/pN), which were linked through the taut bead-actin-bead assembly. From the equipartition relation, ktrap can be related to the bead position variance, σ2, as follows:
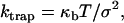 |
where κb is Boltzmann's constant and T is temperature in Kelvin. Working within the predetermined linear range of the QD, we applied a desired load to the attached myosin molecule by imposing a displacement offset to the right trap position. The size of the offset was given by
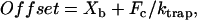 |
where Xb is the instantaneous bead position in nanometers and Fc is twice the desired load (pN). The offset was calculated every 50 μs, and the repositioning of the laser traps was completed within 100 μs.
Rapid event detection and load-clamp application
To assess the effects of load on the kinetics of nucleotide release and binding, we developed a technique for imposing a load clamp after the rapid detection of myosin binding to the actin filament. Therefore, an ∼50-nm 1-kHz oscillation was applied to the left bead of a bead-actin-bead assembly. To achieve these oscillations it was necessary to oscillate the laser trap with an amplitude of ∼200 nm at 1 kHz because the corner frequency of a trapped bead in solution is ∼300 Hz. This oscillation is then transmitted to the right bead through the actin filament (Fig. 2 a). On myosin attachment to actin, the amplitude of the right bead's oscillations decreased because of myosin shunting the transmission of the oscillation (Fig. 2 b). The output from the right QD was split: one output was recorded directly, and the second was modified using a custom-designed circuit before being passed to the control computer. The custom circuit used a band-pass filter for frequencies at 1 kHz ± 50 Hz and then rectified the output at this frequency with an RMS filter, creating a DC voltage output corresponding directly to the amplitude of the signal at 1 kHz. This signal was passed to the control computer, and when the RMS amplitude at 1 kHz dropped below a tunable threshold for >10 ms, the oscillations were turned off, and then the left bead moved toward the myosin (<250 nm), slacking any tension in the actin to the left of the cross-bridge. At this time the load clamp (described above) was engaged for the right bead unless deliberately delayed by a user input for experimental purposes (see below). In addition, the position of the left trap was “slaved” to that of the right so that any movement of the right trap was matched by the left. This maintained a slackened actin filament to the left of the attached cross-bridge.
When the myosin molecule detaches, there is no resistance offered to the load clamp, sending the bead-actin-bead assembly off to a predetermined stop within the linear range of the QD. At this point the software waits 100 ms before disengaging the load clamp, repositioning the bead-actin-bead assembly, and resuming the 1-kHz left trap oscillation.
Load-dependent myosin kinetics: protocol and analytical analysis
Based on previous studies (15,22), only two attached myosin states can be probed in the laser trap, one in which ADP is bound to the active site (AMD) and the ATP-free rigor state (AM) (Fig. 1 a). At saturating ATP concentrations, the smooth muscle myosin attached lifetime, which is rate-limited by ADP release, is ∼30–60 ms (see Results). Therefore, having the ability to apply a load within 10 ms of myosin's attachment to actin or to delay its application in a user-defined manner should allow us to probe the load-dependent kinetics of ADP release and ATP binding to the active site.
To characterize the effect of load on the ADP release rate, ideally one would work at saturating ATP concentrations to effectively eliminate the AM state. However, our actin-bead attachment strategy, using NEM-modified myosin, is labile at high ATP concentration and high forces. Therefore, we performed our studies at 10 μM ATP. However, at this ATP concentration both the AMD and AM states contribute almost equally to the attached lifetime (15). Therefore, we devised the following experimental and analytical approach to extract the load dependence of both the ADP-release and ATP-binding rates.
For ATP binding, we performed experiments at 1 μM ATP to prolong the lifetime of the AM state. Then, when the load clamp was applied 200 ms after detection of a myosin-binding event, there was >95% probability that ADP had been released from the active site so that the load was being applied only to the AM state (assuming an ADP-bound lifetime of 60 ms). This protocol resulted in detachment rate data (see Fig. 7 a, squares).
FIGURE 7.

Load affects the myosin detachment rate of both WT and G709V myosin. (a) Load applied to WT smooth muscle myosin 10 ms after detection of myosin binding in 10 μM ATP (triangles) or after 200 ms in 1 μM ATP (squares). Data are plotted as a function of positive (resistive) or negative (assistive) loads and fit to the modified Arrhenius/Eyring equation (Eq. 2) to yield the following parameters: for triangles δt = 1.3 nm, k0 = 9.8 s−1; for squares δt = 0.9 nm, k0 = 1.3 s−1. (b) Data in a were used to extract the load dependence of k−ADP (δt = 2.6 nm, k0 = 18 s−1; see Materials and Methods). (c) Load dependence for G709V mutant at 10 μM ATP with the load applied 10 ms after attachment (triangles). The data were fit as in a, yielding the following parameters: δt = 2.6 nm, k0 = 0.4 s−1. The data shown as open squares are predicted using the ADP-release and scaled ATP-binding rate data (see Results) obtained from Fig. 5 and the distance parameters, δt, for the WT load dependencies in panels a and b. The dotted line fit to these data from Eq. 2 yields δt = 1.2 nm, k0 = 0.03 s−1.
For the ADP-release rate, k−ADP, we collected lifetime data at 10 μM ATP with a 10-ms load-clamp delay (see Fig. 7 a, triangles). As described above, these data reflect both the rates of ADP release and ATP binding to the active site. To extract the load dependence of the ADP-release rate from these data, we effectively subtracted the effect of load on the ATP-binding rate. To do this, we increased the detachment rates at each load (see Fig. 7 a, squares) 10-fold to bring these ATP-binding rates obtained at 1 μM ATP to their expected values at 10 μM ATP (i.e., binding rate = [ATP] × second-order ATP-binding rate constant). We then converted these corrected ATP-binding rates to lifetimes (where lifetime = 1/rate) and subtracted these from the 10 μM ATP, 10-ms delay lifetime data (see Fig. 7 a, triangles). The resulting data were then converted back to rates (see Fig. 7 b) and should correspond to load dependence of k−ADP.
During these studies, load-clamp data were taken as pairs for each actin filament. Because of our experimental configuration, the force clamp was applied only to the bead in the right trap. Therefore, data were first collected with the actin filament in its initial orientation, and then the filament was lifted from the surface, rotated 180° about its center, and then reapplied to the same S1-myosin-coated bead or another bead on the surface. This resulted in loads being applied in both the assistive and resistive regimes relative to the direction of the myosin power stroke. We then assumed that the actin orientation that resulted in longer myosin attachment lifetimes represented an actin polarity for which the applied loads were resistive. To confirm the directionality of the applied load relative to the actin filament polarity, in a limited set of experiments we fluorescently labeled actin filaments at their minus-end with Alexa-660 (23) and determined that longer attached lifetimes were associated with resistive loads (data not shown).
RESULTS
G709V slows actin filament velocity
To understand the role of the SH helix region in the transmission of load, residue G709 that lies at the critical junction between the catalytic and mechanical domains of smooth muscle myosin was mutated to valine in an S1 backbone. This mutation appeared to abolish actin movement in the in vitro motility assay (data not shown), but when movements were assayed in the laser trap, extremely slow actin filament velocities were recorded (Vactin = 0.8 nm·s−1) (Fig. 3). This velocity is 270 times slower than the value obtained from the control WT S1 (0.21 ± 0.03 μm s−1).
FIGURE 3.

G709V translocates actin at an extremely slow velocity. A typical displacement trace is shown (upper trace) in which 100 μg/ml of G709V myosin was incubated on the surface with near saturating ATP (140 μM). To ensure that the myosin molecules did not experience increasing loads as the actin filament and beads are displaced in the laser trap, a small 1-pN resistive load was applied to the myosin population. As a control, a bead fixed to the flow cell surface was imaged (light gray trace); no appreciable movement over the same time scale was seen, indicating that the movement seen represents true myosin-induced motility and not a movement artifact of the microscope stage.
At the molecular level, Vactin ≈ d/ton, where d is the myosin power stroke displacement and 1/ton is myosin's detachment rate from actin after the power stroke. A reduction in d and/or 1/ton may account for the mutant's slow velocity. The unitary step size (d) measured in the laser trap was 4.4 ± 0.6 nm (n = 232 steps; Fig. 4 b), equal to that of WT (14), implying that the slowed Vactin results from a decreased detachment rate.
FIGURE 4.

G709V mutant binding events with actin. (a) Raw data traces at a number of ATP concentrations. These traces show the displacement of the actin filament as measured by the position of the right bead in Fig. 2 a. The noise caused by Brownian motion of the bead-actin-bead assembly significantly decreases when myosin attaches to actin. With decreasing ATP concentration, myosin attached lifetimes increase, visibly demonstrating the reduction in detachment rate at lower ATP concentration as plotted in Fig. 5 a. (b) A histogram of mean displacement for a number of data traces. Fitting these data to a single Gaussian relation (18) yields a mean step size of 4.4 ± 0.6 nm. Previous studies (15) indicate that step size is invariant with ATP concentration.
G709V exhibits slowed kinetics of ADP release and ATP binding
Myosin's detachment rate is comprised of two biochemical processes: the rate of ADP release (k−ADP) followed by the rate of ATP binding (k+ATP[ATP]) to the active site, where k+ATP is the second-order ATP-binding constant (Fig. 1 a) (22). To determine the mutant's k−ADP and k+ATP under unloaded conditions, we measured ton at several ATP concentrations (Figs. 4 a and 5). Low ATP concentration prolonged myosin's attachment to actin, whereas higher concentrations of ATP shortened ton until it was limited by k−ADP. We plotted myosin's detachment rate (i.e., 1/ton) as a function of ATP concentration and then fit the data to the following hyperbolic relation (Fig. 5):
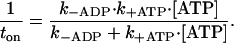 |
(1) |
FIGURE 5.

G709V myosin's detachment rate varies hyperbolically with ATP concentration. Average detachment rates (i.e., 1/ton) from many single-molecule interactions (n = 392) as shown in Fig. 4 a are plotted versus [ATP] to yield the hyperbolic relation shown in the top panel. These data are fit to an analytical solution of the scheme shown in Fig. 1 a (see main text) to derive values for ADP release (k−ADP) and the second-order ATP-binding (k+ATP) rates of 0.16 ± 0.02 s−1 and 4.4 ± 2.5 × 10³ M−1s−1, respectively. The lower panels show representative histograms of lifetimes for two ATP concentrations.
Based on the fit, we obtained estimates of k−ADP (0.16 ± 0.02 s−1) and k+ATP (4.4 ± 2.5 × 10³ M−1s−1), ∼100 times slower than WT heavy meromyosin (15). Values for ADP release (∼0.064 s−1) and for ATP binding (6.3 ± 0.3 × 10⁴ M−1s−1) for the mutant were also obtained in the stopped flow (Fig. 6). As with the laser trap data, these values are significantly slower than those obtained with WT S1 (ADP release ∼32 s−1 and ATP binding = 1.27 ± 0.02 × 10⁶ M−1s−1; Fig. 6). The values obtained by stopped-flow kinetics are not identical to those obtained in the laser trap, but they do follow the same trend. Discrepancies may be caused in part by the slight load imposed by the trap.
FIGURE 6.

Rate of ADP release and ATP binding to WT and G709V S1 determined by stopped-flow kinetics. (a) The release of ADP from actoS1 is plotted as a function of time. The traces shown were obtained at 30°C and normalized to their maximum fluorescence; the rates of ADP release were ∼0.17 s−1 for G709V and ∼100 s−1 for WT. For comparison with laser-trap data these data were also collected at 20°C, yielding the rates shown in the main text. (b) Observed binding rate constants plotted versus ATP concentration. Each point represents the average of multiple stopped-flow determinations for WT (open squares) and G709V (triangles); error bars are obscured by the data symbols. Apparent second-order ATP binding constants were determined by fitting the data to a linear regression (as shown), yielding values for the WT of 1.27 ± 0.02 × 10⁶ M−1s−1 and G709V 6.3 ± 0.3 × 10⁴ M−1s−1.
Load-dependent kinetics of WT smooth muscle S1
Because the G709V mutation may alter the manner in which load is transmitted and sensed by the active site, we devised an experimental/analytical approach (see Materials and Methods) to obtain the load dependence for both k−ADP and k+ATP. This approach involved applying load to a single motor at different times after the power stroke (10 or 200 ms) and at two different ATP concentrations (1 or 10 μM).
When load was applied to the WT construct in the AM state (i.e., 1 μM ATP, 200-ms delay), the ATP-induced detachment rate was only slightly affected, varying 2.5-fold over the ±2.5 pN range of loads (Fig. 7 a, squares). By contrast, when load was applied 10 ms after the power stroke in 10 μM ATP so that both the ADP-release and ATP-binding rates were probed, a greater load dependence was observed (Fig. 7 a, triangles). This increased sensitivity reflects the 30-fold modulation of k−ADP by which assistive loads accelerate and resistive loads slow the ADP release rate (Fig. 7 b).
The load dependences for both the ADP-release and ATP-binding rates (Figs. 7, a and b) were fitted to a modified Arrhenius/Eyring equation (24):
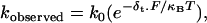 |
(2) |
where ko is the rate at zero load, δt is the distance to the transition state, F is load, κB is the Boltzmann constant, and T is temperature in Kelvin. For the ATP-binding rate at 1 μM ATP (Fig. 7 a, squares), this relation yields a ko = 1.3 s−1 and a δt = 0.9 nm. With this ko, a k+ATP of 1.3 × 10⁶ M−1s−1 is estimated, which is nearly identical to that obtained in the stopped flow (see above). For the load dependence of k−ADP (Fig. 7 b), ko = 18 s−1, and δt = 2.6 nm, confirming the results of a previous study (25). In addition, the ko for ADP release compares favorably, to within a factor of 2, of the unloaded k−ADP obtained in the stopped flow and that previously measured in the laser trap (15).
Load accelerates ATP binding to the G709V mutant S1
Because the G709V mutation significantly slows k−ADP and k+ATP, one might also anticipate potential changes to the load dependence for these kinetic processes. From Fig. 5 at 10 μM ATP, the mutant's unloaded detachment rate was 0.04 s−1 (i.e., 1/ton = 1/(27 s)). At this ATP concentration, the mutant spends most of its lifetime (∼23 s) in rigor waiting for ATP to bind (i.e., 1/(4.4 × 103 M−1s−1 × 10 μM ATP)). Therefore, the load dependence of the detachment rate should be dominated by the load dependence for ATP binding, as illustrated by the calculated data in Fig. 7 c (open squares). This relation was generated by assuming that the mutant possessed the same load dependencies as WT for k−ADP (δt = 2.6 nm) and k+ATP (δt = 0.9 nm) but that the unloaded ADP-release and ATP-binding rates were as measured for the mutant in the laser trap (Fig. 5; 0.16 s−1 and 4.4 × 10³ M−1s−1, respectively).
The actual experimental data (Fig. 7 c, triangles), however, resulted in detachment rates that were ∼10-fold faster than predicted and strongly load dependent. Interestingly, when fit to the Arrhenius/Eyring equation the 0.4 s−1 detachment rate at zero load, ko, is similar to the unloaded k−ADP value of 0.16 s−1 measured in the trap (Fig. 5). In addition, the sensitivity to load, characterized by the distance parameter, δt = 2.6 nm, is identical to that of WT k−ADP (see above). Thus, the mutant's load-dependent detachment rate may reflect the kinetics of ADP release rather than ATP binding. If this is true, then the applied load may have accelerated the ATP-binding rate of the mutant.
To confirm or refute this idea, we measured the detachment rate at 1 μM ATP, where the predicted detachment rate would be 0.004 s−1, once again dominated by k+ATP. For this experiment only the laser trap position oscillation, used to detect myosin-binding events, was imposed. The load presented by the oscillation (<1.5 pN) was sufficient to increase the detachment rate to 0.09 s−1 (Fig. 8), confirming that load accelerated the ATP-binding rate by ∼20-fold toward WT values.
FIGURE 8.

Histogram of attached lifetimes for the G709V mutant obtained in 1 μM ATP and with the oscillations applied to the left-hand trap. The detachment rate based on the exponential fit equals 0.09 ± 0.007 s−1.
DISCUSSION
The effect of the G709V mutation on myosin's kinetics
The myosin lever arm rotation is the result of structural rearrangements in the active site during ATP turnover (4,26). This rotation may occur about a fulcrum centered between the SH helices at the conserved glycine-709 (27,28) (Fig. 1 b). A smooth muscle G709V S1 construct was expressed to study the role of this residue in myosin's mechanochemical transduction.
The mutant G709V motor translocates actin (Vactin = 0.8 nm·s−1) two orders of magnitude more slowly than WT. Because Vactin ∼ d/ton and the measured d = 4.4 nm, similar to the WT, the detachment rate (1/ton) is estimated to be 0.18 s−1. This value agrees quite well with the value of k−ADP obtained both in the stopped flow and laser trap (0.06–0.16 s−1) and suggests that the slowed Vactin of the mutant is limited by a significantly slowed k−ADP. A similar conclusion was reached when the G709 residue was mutated to an Ala in both skeletal (7) and Dictyostelium myosin II (29). However, when the identical G709V mutation was introduced to the Dictyostelium myosin II, the slowed Vactin was assigned to a significantly slowed Pi release rate (9). The differential effects of a Gly-to-Val versus a Gly-to-Ala substitution in Dictyostelium myosin suggest that small environmental changes around the SH helix can have dramatic effects, which may account for the rate-limiting steps for Vactin in the G709V smooth muscle myosin mutant being different from that in Dictyostelium.
The rate of ATP binding to G709V S1 was also slowed by two orders of magnitude compared to WT, as determined in both the stopped flow and laser trap under nearly unloaded conditions. By hypothesizing that G709 lies within the communication pathway between the lever arm and active site, we then investigated how the sensitivity of k−ADP and k+ATP to load might be altered by the mutation.
Load dependence of k−ADP and k+ATP for smooth muscle myosin S1
For the WT myosin S1 construct, k−ADP was more sensitive to load than k+ATP (Fig. 7, a and b), in agreement with a similar study by Veigel et al. (25). k−ADP is accelerated when the applied load is in the direction of the myosin power stroke (i.e., assistive), whereas a resistive load slows this rate. This directional sensitivity can be interpreted as load affecting the height of the activation barrier for the transition between the AMD and AM states, with resistive loads increasing and assistive loads decreasing the height of the barrier. In addition, the fit of the load dependence for k−ADP to the modified Arrhenius/Eyring relation (Fig. 7 b; Eq. 2) defines a distance parameter δt of 2.6 nm, representing the distance myosin moves actin to reach the transition state during ADP release. Based on structural, biochemical, and biophysical measurements, ADP release in smooth muscle myosin is associated with an additional 2–3.5 nm displacement at the end of the lever arm (25,30,31). Because this additional displacement is equal to the δt reported here, it appears that smooth muscle myosin's ADP release involves a concomitant structural change within the active site that is transmitted to the lever arm. Additionally, the rate of this transition is sensitive to both the amplitude and the direction of the applied load, a phenomenon also observed in smooth muscle tissue (32).
The load dependence of k−ADP may provide both a molecular explanation for both the Fenn effect (1) and the hyperbolic dependence of shortening velocity on load (33). In both cases, resistive loads would slow myosin's ATPase rate and shortening velocity through the load-induced slowing of k−ADP. In addition, one of the earliest muscle models (34) proposed that myosin detachment kinetics depend on strain, such that a negatively strained myosin cross-bridge (i.e., one experiencing assistive forces) would rapidly detach. This effectively reduces the “drag” on a moving actin filament by attached heads that have undergone their power stroke and are no longer generating motion. This may be explained by the increased k−ADP associated with assistive loads (Fig. 7 b).
The load dependence of k−ADP is similar to that recently observed for myosin V (35), which may allow this processive double-headed motor to take multiple steps without diffusing away from its actin track. Intramolecular strain between the heads may keep them kinetically out of phase so that one head remains attached to the actin track at all times (35–42). This coordination between heads could result from the effects of load on the lead and trailing heads, such that assistive and resistive loads gate the release of ADP differentially from each head.
Load dependence of k−ADP for the G709V mutant
Although the G709V mutation slows k−ADP by two orders of magnitude under unloaded conditions compared to the WT (Fig. 5), the load sensitivity of this transition is unaffected; i.e., the distance parameter, δt = 2.6 nm, is equal to WT (Fig. 7, b versus c, triangles). Therefore, this residue is unlikely to be a force sensor. In fact, one can question whether a load sensor exists per se, or is the active site effectively coupled directly to the lever arm such that the entire communication pathway functions as a sensor? The significantly slowed k−ADP does suggest that the mutation by itself raises the activation barrier for ADP release. A Gly-to-Val mutation introduces a small branched side chain into a region previously occupied by a hydrogen atom, so that the side chain may sterically block the conformational transition required for ADP release. Furthermore, because valine cannot occupy regions of Ramachandran space that glycine can, the motion of this residue may be restricted. At a minimum, the mutant data suggest that a conformational rearrangement involving G709 is directly coupled to ADP release.
Load-dependent acceleration of ATP binding and kinetics of the G709V mutant
As with k−ADP, the G709V mutation slows k+ATP by two orders of magnitude under unloaded conditions, and with such a significant slowing of the ATP-binding rate, the load dependence of the mutant should have been dominated by this kinetic step. However, over the range of applied loads, the mutant's detachment rate was faster than predicted with an observed load dependence (δt = 2.6 nm) and detachment rate at zero force (0.4 s−1) reflecting the mutant's k−ADP (Fig. 7 c). To account for this acceleration, the ATP-binding rate must have been accelerated by at least 20-fold (Fig. 8). Thus, load partially reversed the mutant's phenotype associated with ATP binding but not ADP release. In a previous study, the Dictyostelium G709V mutant phenotype was found to be thermally reversible, such that a 17°C temperature increase partially restored the mutant's actin-activated ATPase toward WT (10). The thermal energy corresponding to this temperature change (0.2 pN·nm) is far less than the mechanical energy imparted by the laser trap in our study (i.e., (2 pN × 2.6 nm) = 5.2 pN·nm). Therefore, the observation that load partially restored the WT kinetics for ATP binding should not have come as a surprise.
Because the binding of ATP to the AM state occurs after ADP release, the slowed ATP-binding rate for the mutant and its acceleration by load suggest that a second conformational transition around Gly709 must occur after ADP release so that the active site is competent to bind ATP. This AM* state may normally exist, but its transition to the AM state (AM*→AM) may be so rapid that AM* is only transiently populated in the WT. However, for the mutant this state may be populated, and with its inability to bind ATP, k+ATP is effectively slowed. Apparently, mechanical energy in the form of an applied load can depopulate this putative AM* state in the mutant and partially reverse the mutant phenotype.
CONCLUSIONS
By introducing a point mutation at a key site in the communication pathway of smooth muscle myosin II, we have been able to assess mechanochemical coupling from a new vantage point. We describe an example of how externally applied force can reverse the effects of a mutation. This finding suggests that the energy landscape for the catalysis of an enzyme can be perturbed by both mutation and external force. Therefore, the conventional view of structure defining function is further emphasized because mechanically altering the structure can affect the function of the enzyme. In this study we have investigated the effect of load on ADP release and ATP binding for both the mutant and WT. In the mutant, despite a considerably greater activation barrier than WT for ADP release, the load dependence is unaffected, indicating that the structural transition associated with ADP release is unchanged. However, for ATP binding, load appears to reverse the effects of the mutation, suggesting that the mutant myosin reveals a nucleotide-free state not seen in the WT that is incapable of binding ATP.
Through understanding such physical/structural processes that underlie biochemical transitions within a protein, it may be possible to physically manipulate and thus modulate the kinetic properties of any enzyme, even those not normally associated with mechanical function.
Acknowledgments
We thank Guy Kennedy and Samantha Beck for technical support and Josh Baker for insightful discussions and suggestions.
This work was funded by grants from the National Institutes of Health HL38113 (K.M.T.), HL059408, HL085489 (D.M.W.), and AR47906 (K.M.T. and D.M.W.).
Abbreviations used: S1, myosin subfragment 1; WT, wild-type myosin subfragment 1; G709V, myosin subfragment 1 with a glycine for valine substitution at residue 709 (all primary sequences use smooth muscle numbering).
References
- 1.Fenn, W. O. 1923. A quantitative comparison between the energy liberated and the work performed by the isolated sartorius muscle of the frog. J. Physiol. 58:175–203. [DOI] [PMC free article] [PubMed] [Google Scholar]
- 2.Houdusse, A., A. G. Szent-Gyorgyi, and C. Cohen. 2000. Three conformational states of scallop myosin S1. Proc. Natl. Acad. Sci. USA. 97:11238–11243. [DOI] [PMC free article] [PubMed] [Google Scholar]
- 3.Holmes, K. C. 1997. The swinging lever-arm hypothesis of muscle contraction. Curr. Biol. 7:R112–R118. [DOI] [PubMed] [Google Scholar]
- 4.Rayment, I., W. R. Rypniewski, K. Schmidt-Base, R. Smith, D. R. Tomchick, M. M. Benning, D. A. Winkelmann, G. Wesenberg, and H. M. Holden. 1993. Three-dimensional structure of myosin subfragment-1: a molecular motor. Science. 261:50–58. [DOI] [PubMed] [Google Scholar]
- 5.Warshaw, D. M., W. H. Guilford, Y. Freyzon, E. Krementsova, K. A. Palmiter, M. J. Tyska, J. E. Baker, and K. M. Trybus. 2000. The light chain binding domain of expressed smooth muscle heavy meromyosin acts as a mechanical lever. J. Biol. Chem. 275:37167–37172. [DOI] [PubMed] [Google Scholar]
- 6.Ruff, C., M. Furch, B. Brenner, D. J. Manstein, and E. Meyhofer. 2001. Single-molecule tracking of myosins with genetically engineered amplifier domains. Nat. Struct. Biol. 8:226–229. [DOI] [PubMed] [Google Scholar]
- 7.Kinose, F., S. X. Wang, U. S. Kidambi, C. L. Moncman, and D. A. Winkelmann. 1996. Glycine 699 is pivotal for the motor activity of skeletal muscle myosin. J. Cell Biol. 134:895–909. [DOI] [PMC free article] [PubMed] [Google Scholar]
- 8.Patterson, B., and J. A. Spudich. 1996. Cold-sensitive mutations of Dictyostelium myosin heavy chain highlight functional domains of the myosin motor. Genetics. 143:801–810. [DOI] [PMC free article] [PubMed] [Google Scholar]
- 9.Uyeda, T. Q., K. Tokuraku, K. Kaseda, M. R. Webb, and B. Patterson. 2002. Evidence for a novel, strongly bound acto-S1 complex carrying ADP and phosphate stabilized in the G680V mutant of Dictyostelium myosin II. Biochemistry. 41:9525–9534. [DOI] [PubMed] [Google Scholar]
- 10.Patterson, B., K. M. Ruppel, Y. Wu, and J. A. Spudich. 1997. Cold-sensitive mutants G680V and G691C of Dictyostelium myosin II confer dramatically different biochemical defects. J. Biol. Chem. 272:27612–27617. [DOI] [PubMed] [Google Scholar]
- 11.Ohki, T., S. V. Mikhailenko, M. F. Morales, H. Onishi, and N. Mochizuki. 2004. Transmission of force and displacement within the myosin molecule. Biochemistry. 43:13707–13714. [DOI] [PubMed] [Google Scholar]
- 12.Cronan, J. E., Jr. 1990. Biotination of proteins in vivo. A post-translational modification to label, purify, and study proteins. J. Biol. Chem. 265:10327–10333. [PubMed] [Google Scholar]
- 13.Trybus, K. M. 2000. Biochemical studies of myosin. Methods. 22:327–335. [DOI] [PubMed] [Google Scholar]
- 14.Kad, N. M., A. S. Rovner, P. M. Fagnant, P. B. Joel, G. G. Kennedy, J. B. Patlak, D. M. Warshaw, and K. M. Trybus. 2003. A mutant heterodimeric myosin with one inactive head generates maximal displacement. J. Cell Biol. 162:481–488. [DOI] [PMC free article] [PubMed] [Google Scholar]
- 15.Lauzon, A. M., M. J. Tyska, A. S. Rovner, Y. Freyzon, D. M. Warshaw, and K. M. Trybus. 1998. A 7-amino-acid insert in the heavy chain nucleotide binding loop alters the kinetics of smooth muscle myosin in the laser trap. J. Muscle Res. Cell Motil. 19:825–837. [DOI] [PubMed] [Google Scholar]
- 16.Dupuis, D. E., W. H. Guilford, J. Wu, and D. M. Warshaw. 1997. Actin filament mechanics in the laser trap. J. Muscle Res. Cell Motil. 18:17–30. [DOI] [PubMed] [Google Scholar]
- 17.Veigel, C., M. L. Bartoo, D. C. White, J. C. Sparrow, and J. E. Molloy. 1998. The stiffness of rabbit skeletal actomyosin cross-bridges determined with an optical tweezers transducer. Biophys. J. 75:1424–1438. [DOI] [PMC free article] [PubMed] [Google Scholar]
- 18.Molloy, J. E., J. E. Burns, J. Kendrick-Jones, R. T. Tregear, and D. C. White. 1995. Movement and force produced by a single myosin head. Nature. 378:209–212. [DOI] [PubMed] [Google Scholar]
- 19.Harris, D. E., and D. M. Warshaw. 1993. Smooth and skeletal muscle myosin both exhibit low duty cycles at zero load in vitro. J. Biol. Chem. 268:14764–14768. [PubMed] [Google Scholar]
- 20.Debold, E. P., J. B. Patlak, and D. M. Warshaw. 2005. Slip sliding away: load-dependence of velocity generated by skeletal muscle myosin molecules in the laser trap. Biophys. J. 89:L34–L36. [DOI] [PMC free article] [PubMed] [Google Scholar]
- 21.Kron, S. J., and J. A. Spudich. 1986. Fluorescent actin filaments move on myosin fixed to a glass surface. Proc. Natl. Acad. Sci. USA. 83:6272–6276. [DOI] [PMC free article] [PubMed] [Google Scholar]
- 22.Baker, J. E., C. Brosseau, P. B. Joel, and D. M. Warshaw. 2002. The biochemical kinetics underlying actin movement generated by one and many skeletal muscle myosin molecules. Biophys. J. 82:2134–2147. [DOI] [PMC free article] [PubMed] [Google Scholar]
- 23.Homma, K., M. Yoshimura, J. Saito, R. Ikebe, and M. Ikebe. 2001. The core of the motor domain determines the direction of myosin movement. Nature. 412:831–834. [DOI] [PubMed] [Google Scholar]
- 24.Bell, G. I. 1978. Models for the specific adhesion of cells to cells. Science. 200:618–627. [DOI] [PubMed] [Google Scholar]
- 25.Veigel, C., J. E. Molloy, S. Schmitz, and J. Kendrick-Jones. 2003. Load-dependent kinetics of force production by smooth muscle myosin measured with optical tweezers. Nat. Cell Biol. 5:980–986. [DOI] [PubMed] [Google Scholar]
- 26.Geeves, M. A., and K. C. Holmes. 1999. Structural mechanism of muscle contraction. Annu. Rev. Biochem. 68:687–728. [DOI] [PubMed] [Google Scholar]
- 27.Houdusse, A., V. N. Kalabokis, D. Himmel, A. G. Szent-Gyorgyi, and C. Cohen. 1999. Atomic structure of scallop myosin subfragment S1 complexed with MgADP: a novel conformation of the myosin head. Cell. 97:459–470. [DOI] [PubMed] [Google Scholar]
- 28.Fischer, S., B. Windshugel, D. Horak, K. C. Holmes, and J. C. Smith. 2005. Structural mechanism of the recovery stroke in the myosin molecular motor. Proc. Natl. Acad. Sci. USA. 102:6873–6878. [DOI] [PMC free article] [PubMed] [Google Scholar]
- 29.Batra, R., M. A. Geeves, and D. J. Manstein. 1999. Kinetic analysis of Dictyostelium discoideum myosin motor domains with glycine-to-alanine mutations in the reactive thiol region. Biochemistry. 38:6126–6134. [DOI] [PubMed] [Google Scholar]
- 30.Whittaker, M., E. M. Wilson-Kubalek, J. E. Smith, L. Faust, R. A. Milligan, and H. L. Sweeney. 1995. A 35-A movement of smooth muscle myosin on ADP release. Nature. 378:748–751. [DOI] [PubMed] [Google Scholar]
- 31.Gollub, J., C. R. Cremo, and R. Cooke. 1996. ADP release produces a rotation of the neck region of smooth myosin but not skeletal myosin. Nat. Struct. Biol. 3:796–802. [DOI] [PubMed] [Google Scholar]
- 32.Khromov, A. S., M. R. Webb, M. A. Ferenczi, D. R. Trentham, A. P. Somlyo, and A. V. Somlyo. 2004. Myosin regulatory light chain phosphorylation and strain modulate adenosine diphosphate release from smooth muscle myosin. Biophys. J. 86:2318–2328. [DOI] [PMC free article] [PubMed] [Google Scholar]
- 33.Hill, A. V. 1938. The heat of shortening and the dynamic constants of muscle. Proc. R. Soc. Lond. B Biol. Sci. 126:136–195. [Google Scholar]
- 34.Huxley, A. F. 1957. Muscle structure and theories of contraction. Prog. Biophys. Biophys. Chem. 7:255–318. [PubMed] [Google Scholar]
- 35.Veigel, C., S. Schmitz, F. Wang, and J. R. Sellers. 2005. Load-dependent kinetics of myosin-V can explain its high processivity. Nat. Cell Biol. 7:861–869. [DOI] [PubMed] [Google Scholar]
- 36.Rief, M., R. S. Rock, A. D. Mehta, M. S. Mooseker, R. E. Cheney, and J. A. Spudich. 2000. Myosin-V stepping kinetics: a molecular model for processivity. Proc. Natl. Acad. Sci. USA. 97:9482–9486. [DOI] [PMC free article] [PubMed] [Google Scholar]
- 37.De La Cruz, E. M., A. L. Wells, S. S. Rosenfeld, E. M. Ostap, and H. L. Sweeney. 1999. The kinetic mechanism of myosin V. Proc. Natl. Acad. Sci. USA. 96:13726–13731. [DOI] [PMC free article] [PubMed] [Google Scholar]
- 38.Baker, J. E., E. B. Krementsova, G. G. Kennedy, A. Armstrong, K. M. Trybus, and D. M. Warshaw. 2004. Myosin V processivity: multiple kinetic pathways for head-to-head coordination. Proc. Natl. Acad. Sci. USA. 101:5542–5546. [DOI] [PMC free article] [PubMed] [Google Scholar]
- 39.Uemura, S., H. Higuchi, A. O. Olivares, E. M. De La Cruz, and S. Ishiwata. 2004. Mechanochemical coupling of two substeps in a single myosin V motor. Nat. Struct. Mol. Biol. 11:877–883. [DOI] [PubMed] [Google Scholar]
- 40.Veigel, C., F. Wang, M. L. Bartoo, J. R. Sellers, and J. E. Molloy. 2002. The gated gait of the processive molecular motor, myosin V. Nat. Cell Biol. 4:59–65. [DOI] [PubMed] [Google Scholar]
- 41.Rosenfeld, S. S., and H. L. Sweeney. 2004. A model of myosin V processivity. J. Biol. Chem. 279:40100–40111. [DOI] [PubMed] [Google Scholar]
- 42.Purcell, T. J., H. L. Sweeney, and J. A. Spudich. 2005. A force-dependent state controls the coordination of processive myosin V. Proc. Natl. Acad. Sci. USA. 102:13873–13878. [DOI] [PMC free article] [PubMed] [Google Scholar]