Abstract
Diabetic retinopathy is a leading cause of adult vision loss and blindness. Much of the retinal damage that characterizes the disease results from retinal vascular leakage and nonperfusion. This study shows that diabetic retinal vascular leakage and nonperfusion are temporally and spatially associated with retinal leukocyte stasis (leukostasis) in the rat model of streptozotocin-induced diabetes. Retinal leukostasis increases within days of developing diabetes and correlates with the increased expression of retinal intercellular adhesion molecule-1 (ICAM-1). ICAM-1 blockade with a mAb prevents diabetic retinal leukostasis and vascular leakage by 48.5% and 85.6%, respectively. These data identify the causal role of leukocytes in the pathogenesis of diabetic retinopathy and establish the potential utility of ICAM-1 inhibition as a therapeutic strategy for the prevention of diabetic retinopathy.
Although retinal vascular leakage and nonperfusion are recognized as two major complications of diabetes, their pathogenesis remains poorly understood. Leukocytes may be involved in the genesis of these complications. Diabetic retinopathy generally is not considered an inflammatory disease, but the retinal vasculature of humans (1) and rodents (2, 3) with diabetes mellitus contains increased numbers of leukocytes. Many of these leukocytes are static (2, 3). The causes and consequences of this phenomenon are largely unknown. Intercellular adhesion molecule-1 (ICAM-1) is a peptide known to mediate leukocyte adhesion and transmigration (4, 5). ICAM-1 may be operative in the stasis observed in diabetic retinopathy, because ICAM-1 immunoreactivity is increased in the diabetic retinal vasculature of humans (1). However, little is known about the direct pathogenetic role of ICAM-1 in diabetic retinopathy. This study investigated the mechanisms of diabetic retinal leukocyte stasis (leukostasis) and the role leukocytes play in the development of two sight-threatening complications, vascular leakage and capillary nonperfusion.
EXPERIMENTAL PROCEDURES
Animals and Experimental Diabetes.
All animal experiments followed the guidelines of the Association for Research in Vision and Ophthalmology and were approved by the Animal Care and Use Committees of the Children’s Hospital and Joslin Diabetes Center. Long–Evans rats weighing approximately 200 g received a single 60 mg/kg injection of streptozotocin (Sigma) in 10 mM citrate buffer (pH 4.5) after an overnight fast. Control nondiabetic animals received citrate buffer alone. Animals with blood glucose levels greater than 250 mg/dl 24 h later were considered diabetic. Blood pressure was measured by using a noninvasive cuff sensor and monitoring system (Ueda Electronics, Tokyo). Blood treated with the anticoagulant EDTA was drawn from the abdominal aorta of each rat after the experiment. The blood sample was analyzed with a hematology analyzer. The rats were fed on standard laboratory chow and were allowed free access to water in an air-conditioned room with a 12-h light/12-h dark cycle until they were used for the experiments.
Acridine Orange Leukocyte Fluorography (AOLF) and Fluorescein Angiography.
Leukocyte dynamics in the retina were studied with AOLF(3, 6, 7). Intravenous injection of acridine orange causes leukocytes and endothelial cells to fluoresce through the noncovalent binding of the molecule to double-stranded nucleic acid. When a scanning laser ophthalmoscope is used, retinal leukocytes within blood vessels can be visualized in vivo. Static leukocytes in the capillary bed can be observed 20 min after acridine-orange injection (3, 6). Immediately after observing and recording the static leukocytes, fluorescein angiography was performed to study the relationship between static leukocytes and retinal vasculature.
For the administration of acridine orange or sodium fluorescein dye, all rats had a heparin-lock catheter surgically implanted in the right jugular vein 24 h before AOLF and fluorescein angiography were performed. The catheter was externalized subcutaneously to the back of the neck. The rats were anesthetized for this procedure with xylazine hydrochloride (4 mg/kg; Phoenix Pharmaceutical, St. Joseph, MO) and ketamine hydrochloride (25 mg/kg; Parke-Davis). Immediately before AOLF, each rat was again anesthetized, and the pupil of the left eye was dilated with 1% tropicamide (Alcon Laboratories, Humancao, Puerto Rico) to observe leukocyte dynamics. A focused image of the peripapillary fundus of the left eye was obtained with a scanning laser ophthalmoscope (Rodenstock Instruments, Munich). Acridine orange (Sigma) was dissolved in sterile saline (1.0 mg/ml), and 3 mg/kg was injected through the jugular vein catheter at a rate of 1 ml/min. The fundus was observed with the scanning laser ophthalmoscope by using the argon blue laser as the illumination source and the standard fluorescein angiography filter in the 40° field setting for 1 min. After 20 min, the fundus was observed again to evaluate leukostasis in the retina. Immediately after evaluating retinal leukostasis, 20 μl of 1% sodium fluorescein dye was injected into the jugular vein catheter. The images were recorded on a videotape at the rate of 30 frames per second. The video recordings were analyzed on a computer equipped with a video digitizer (Radius, San Jose, CA) that digitizes the video image in real time (30 frames per second) to 640 × 480 pixels with an intensity resolution of 256 steps. For evaluating retinal leukostasis, an observation area around the optic disc measuring 10 disc diameters in diameter was determined by drawing a polygon surrounded by the adjacent major retinal vessels. The area was measured in pixels, and the density of trapped leukocytes was calculated by dividing the number of trapped leukocytes, which were recognized as fluorescent dots, by the area of the observation region. The densities of leukocytes were calculated generally in eight peripapillary observation areas, and an average density was obtained by averaging the eight density values.
Isotope Dilution Technique.
Vascular leakage was quantified by using an isotope dilution technique based on the injection of BSA labeled with two different iodine isotopes, 125I and 131I (8, 9). Briefly, purified monomer BSA (1 mg) was iodinated with 1 mCi of 131I or 125I by using the iodogen method. Polyethylene tubing (0.58-mm internal diameter) was used to cannulate the right jugular vein and the left or right iliac artery. The tubing was filled with heparinized saline. The right jugular vein cannula was used for tracer injection. The iliac artery cannula was connected to a 1-ml syringe attached to a Harvard Bioscience model PHD 2000 constant-withdrawal pump preset to withdraw at a constant rate of 0.055 ml/min. At time 0, [125I]BSA (50 million cpm in 0.3 ml of saline) was injected into the jugular vein, and the withdrawal pump was started. At the 8-min mark, 0.2 ml (50 million cpm) of [131I]BSA was injected. At the 10-min mark, the heart was excised; the withdrawal pump was stopped; and the retina was quickly dissected and sampled for γ-spectrometry. Tissue and arterial samples were weighed and counted in a γ-spectrometer (Beckman Instruments 5500). The data were corrected for background, and a quantitative index of [125I]BSA tissue clearance was calculated as described (8, 9) and expressed as micrograms of plasma per tissue wet weight−1 per minute−1. Briefly, [125I]BSA tissue activity was corrected for [125I]BSA contained within the tissue vasculature by multiplying [125I]BSA activity in the tissue by the ratio of [125I]BSA/[131I]BSA in the arterial plasma sample obtained at the end of the experiment. The vascular-corrected [125I]BSA activity was divided by the time-averaged [125I]BSA plasma activity (obtained from a well mixed sample of plasma taken from the withdrawal syringe) and by the tracer circulation time (10 min) and then normalized per gram of tissue wet weight.
Ribonuclease Protection Assay.
The retinas were excised gently, cut at the optic disc after enucleation, and frozen immediately in liquid nitrogen. Total RNA was isolated from rat retinas according to the acid guanidinium thiocyanate-phenol-chloroform extraction method. A 425-bp EcoRI–BamHI fragment of rat ICAM-1 cDNA was prepared by reverse transcription–PCR and cloned into pBluescript II KS(−) vector. A 472-nt antisense riboprobe was prepared by in vitro transcription (Promega) of linearized plasmid DNA with T7 RNA polymerase in the presence of [32P]dUTP. The sequence of the cloned cDNA was verified by DNA sequencing. Total cellular RNA (20 μg) was used for ribonuclease protection assays. All samples were simultaneously hybridized with an 18S riboprobe (Ambion, Austin, TX) to normalize for variations in loading and recovery of RNA. Protected fragments were separated on a gel of 5% acrylamide/8 M urea/1× Tris-borate-EDTA and quantified with a PhosphorImager (Molecular Dynamics).
ICAM-1 Blockade.
Confirmed diabetic animals received intraperitoneal injections of 3 mg/kg or 5 mg/kg rat ICAM-1 neutralizing antibody (1A29; R & D Systems) or 5 mg/kg normal mouse IgG1 (R & D Systems) in sterile PBS 24 h after streptozotocin injection. The animals were treated three times per week. Retinal leukostasis and vascular leakage were studied 1 week after diabetes induction.
Statistical Analysis.
All results are expressed as means ± SD. The data were compared by ANOVA with post hoc comparisons tested by using Fisher’s protected least significant difference procedure. Differences were considered statistically significant when P values were less than 0.05.
RESULTS AND DISCUSSION
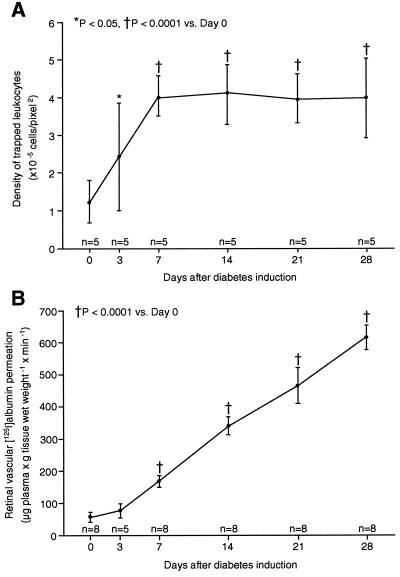
Time-Course Changes of Retinal Leukostasis and Vascular Leakage After Diabetes Induction. Retinal leukostasis was quantified in Long–Evans rats. Diabetic rats, like humans with diabetes, develop retinal nonperfusion and increased vascular permeability. By using AOLF, a time-course analysis showed that retinal leukostasis increased 1.9-fold as early as 3 days after diabetes induction (n = 5; P < 0.05; Fig. 1A). After 1 week of diabetes, retinal leukostasis was 3.2-fold higher than it was in nondiabetic controls (n = 5; P < 0.0001). This finding remained unchanged in degree for 3 additional weeks (n = 5; P < 0.0001; Fig. 1A). Reliable leukostasis quantitation beyond the 4-week time point was precluded by cataract formation.
Figure 1.
Time course of diabetic retinal leukostasis and vascular leakage. (A) Leukostasis was quantified serially by using AOLF. Nondiabetic animals (day 0) and animals with streptozotocin-induced diabetes of varying duration were studied. (B) Radioactive albumin permeation into retinal tissue was quantitated at the same time points by using the isotope dilution technique. All data show the means ± SD.
Leukocyte adhesion to endothelial cells can trigger the disorganization of endothelial cell adherens and tight junctions (10, 11) as well as vascular leakage (12). To determine whether diabetic retinal leukostasis was correlated with blood–retinal barrier breakdown, retinal albumin permeation was quantified (Fig. 1B). Retinal albumin permeation characterizes human and rodent diabetic retinopathy (8, 13) and can be quantified sensitively by using the isotope dilution technique (8, 9). A time-course analysis in diabetic rats revealed a 2.9-fold (n = 8; P < 0.0001) and 10.7-fold (n = 8; P < 0.0001) increase in albumin permeation after 1 and 4 weeks of diabetes (Fig. 1B). The breakdown of the blood–retinal barrier followed the onset of diabetes-associated retinal leukostasis.
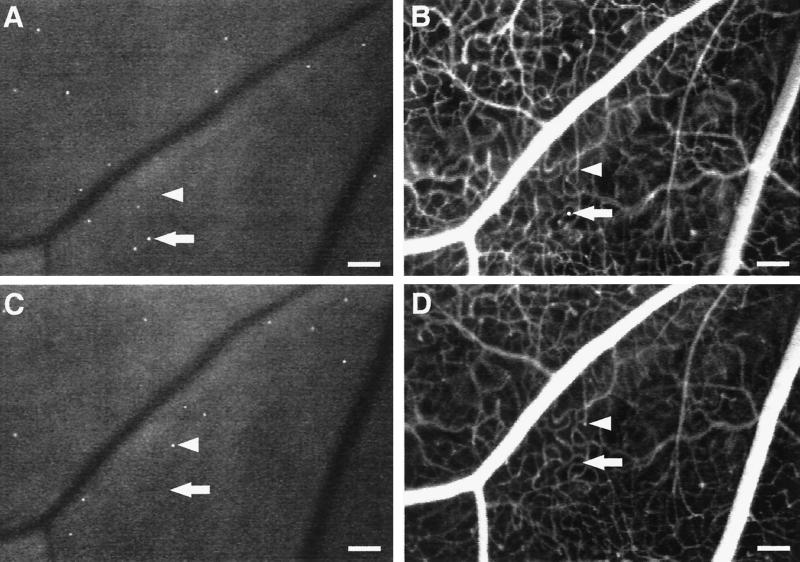
Leukocyte-Induced Nonperfusion and Reperfusion in Retinal Capillaries. To characterize the diabetic retinal leukostasis further, serial AOLF and fluorescein angiography studies were performed. These studies indicated that the individual leukocytes observed with AOLF are in flux, even though the overall degree of leukostasis is constant (Fig. 2). The static retinal leukocytes observed 7 days after the induction of diabetes are topographically distinct from those observed 24 h later. Furthermore, a fraction of the leukocytes are in the extravascular space, a result consistent with their rapid transmigration after dye labeling.
Figure 2.
Static leukocytes are in flux, block capillary flow, and transmigrate. Serial AOLF of static leukocytes in the same retinal area after 7 (A) and 8 (C) days of diabetes shows their complete replacement within a 24-h period. The arrows point to a static leukocyte (A and B) that seems to have transmigrated (B). After 1 day, AOLF and fluorescein angiography show that the leukocyte has disappeared (C and D). The arrowheads show a patent capillary (B) that subsequently becomes obstructed by a static leukocyte 24 h later (C and D). (Bars = 100 μm; 3.2 pixel = 1 μm.)
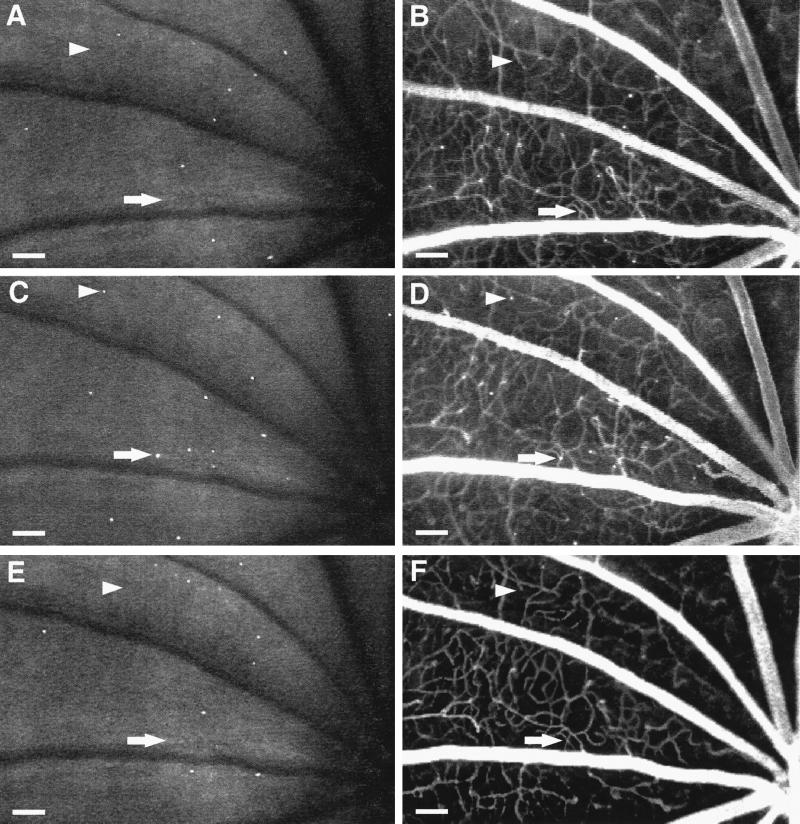
Fluorescein angiography and AOLF were also used to study retinal nonperfusion. These studies identified static leukocytes directly associated with areas of downstream nonperfusion (Figs. 2 and 3). The nonperfused capillaries were patent before the onset of the leukostasis, suggesting a causal relationship. As the leukocyte(s) disappeared, the capillaries either reperfused or remained closed (Fig. 3). Reperfusion has been observed in human diabetic retinopathy, but the mechanism has remained unexplained (14–16). These observations suggest the phenomenon may result, in part, from retinal leukostasis.
Figure 3.
Leukocyte-induced nonperfusion and reperfusion. Serial studies were completed 1 (A and B), 2 (C and D), and 4 (E and F) weeks after diabetes induction by using both AOLF (A, C, and E) and fluorescein angiography (B, D, and F). The arrows show a patent capillary (B) that subsequently becomes occluded downstream from a static leukocyte (C and D) and then opens up when the leukocyte disappears (E and F). The arrowheads show a patent capillary (B) that becomes occluded downstream from a static leukocyte (C and D) and then remains closed after the leukocyte has disappeared (E and F). (Bars = 100 μm; 3.2 pixel = 1 μm.)
ICAM-1 Gene Expression in Diabetic Retina.
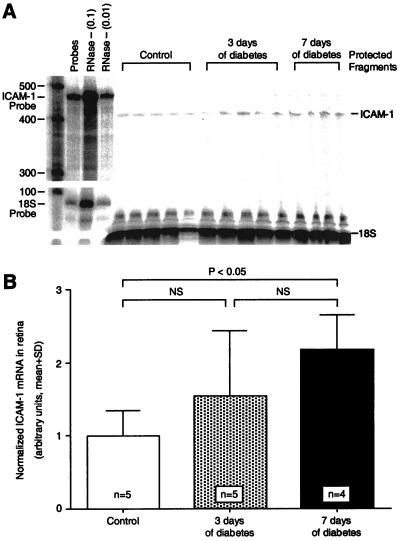
To determine whether retinal ICAM-1 expression increases in association with diabetic retinal leukostasis, ICAM-1 mRNA levels were quantified by using the ribonuclease protection assay. Retinas analyzed 3 days after diabetes induction had ICAM-1 mRNA levels that were 1.5-fold higher than in nondiabetic controls, but this increase was not statistically significant (n = 5; P > 0.05; Fig. 4). After 1 week of diabetes, the retinal ICAM-1 levels were 2.2-fold greater, a significant increase when compared with nondiabetic controls (n = 4; P < 0.05). The ICAM-1 increase coincided temporally with the development of diabetic retinal leukostasis and blood–retinal barrier breakdown.
Figure 4.
ICAM-1 gene expression in diabetic retina. (A) The ribonuclease protection assay shows that retinal ICAM-1 levels were increased significantly 7 days after diabetes induction. Each lane shows the signal from the two retinas of a single animal. The lane labeled “Probes” shows a 100-fold dilution of the full-length ICAM-1 and 18S riboprobes. The lanes labeled “RNase - (0.1)” and “RNase - (0.01)” show the 10-fold and 100-fold dilutions, respectively, of the full-length riboprobes without sample or RNase. (B) When normalized to 18S RNA, the retinal ICAM-1 levels after 7 days of diabetes were 2.2-fold higher (n = 4; P < 0.05) than in the nondiabetic controls. NS = not significant.
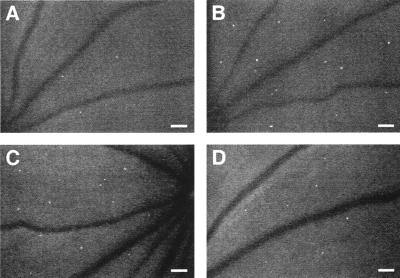
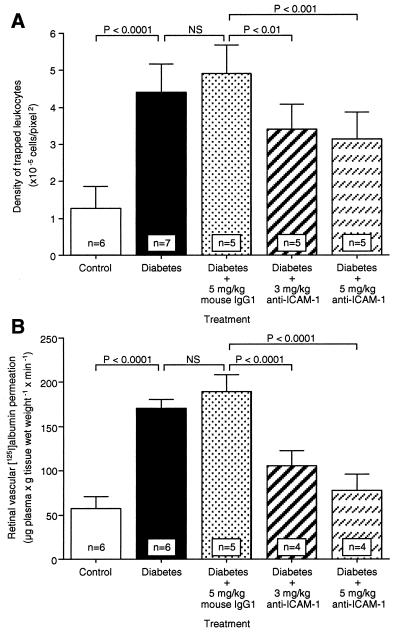
An Anti-ICAM-1 mAb Prevents Leukostasis and Vascular Leakage in Diabetic Retina. To assess whether ICAM-1 mediates diabetic retinal leukostasis, a well characterized ICAM-1 neutralizing antibody (1A29; ref. 17–19) was used for in vivo adhesion blockade experiments. Animals received either 3 or 5 mg/kg intraperitoneal injections of the ICAM-1 antibody three times weekly. Control diabetic animals received an equivalent amount of a nonimmune isotype control antibody. All animals were analyzed 1 week after diabetes induction. The results showed that the ICAM-1 antibody blocked diabetes-induced leukostasis by 40.9% (3 mg/kg; n = 5; P < 0.01) and 48.5% (5 mg/kg; n = 5; P < 0.001; Figs. 5 and 6A). The peripheral leukocyte counts at 1 week increased by 40% (5 mg/kg; n = 5; P < 0.05) compared with the control antibody-treated animals, a result consistent with successful systemic ICAM-1 blockade (Table 1). Body weight, plasma glucose, and blood pressure were unchanged in all diabetic groups (Table 1).
Figure 5.
In vivo retinal leukostasis inhibition. Representative retinal leukostasis observed with AOLF in nondiabetic (A), diabetic (B), diabetic + 5 mg/kg mouse control IgG1 (C), and diabetic + 5 mg/kg anti-ICAM-1 mAb-treated animals (D). (Bars = 100 μm; 3.2 pixel = 1 μm.)
Figure 6.
Effect of anti-ICAM-1 mAb on leukostasis and vascular leakage in diabetic retina. When ICAM-1 bioactivity was inhibited via systemic administration of the ICAM-1 neutralizing antibody, retinal leukostasis (A) and albumin permeation (B) were decreased 48.5% (5 mg/kg; n = 5; P < 0.001) and 85.6% (5 mg/kg; n = 4; P < 0.0001), respectively. NS = not significant.
Table 1.
Characteristics of control, diabetic, mouse IgG1-treated diabetic, and anti-ICAM-1 mAb-treated diabetic rats
| Characteristic | Control | Diabetes | Diabetes + 5 mg/kg mouse IgG1 | Diabetes + anti-ICAM-1 mAb
|
|
|---|---|---|---|---|---|
| 3 mg/kg | 5 mg/kg | ||||
| Number | 6 | 7 | 5 | 5 | 5 |
| Body weight, g | 271 ± 12 | 240 ± 12* | 235 ± 9* | 238 ± 6* | 239 ± 12* |
| Plasma glucose, mg/dl | 123 ± 19 | 332 ± 35* | 316 ± 61* | 351 ± 83* | 373 ± 68* |
| Blood pressure, mmHg | 111 ± 6 | 104 ± 12 | 109 ± 14 | 105 ± 9 | 105 ± 10 |
| Leukocyte count, ×103/μl | 6.1 ± 1.6 | 5.0 ± 1.5† | 5.3 ± 0.8† | 6.9 ± 1.4 | 7.4 ± 2.3 |
Values are means ± SD; 1 mmHg = 133 Pa.
P < 0.0001 vs. control rats;
P < 0.05 vs. 5 mg/kg anti-ICAM-1 mAb-treated diabetic rats.
The effect of the ICAM-1 inhibition on blood–retinal barrier breakdown was tested by using the same antibody. Animals receiving 3 and 5 mg/kg of the anti-ICAM-1 antibody had 63.5% (3 mg/kg; n = 4; P < 0.0001) and 85.6% (5 mg/kg; n = 4; P < 0.0001) less retinal albumin permeation at 1 week (Fig. 6B). The results suggest that the ICAM-1-dependent component of the leukostasis is largely responsible for the blood–retinal barrier breakdown.
Conclusions.
These data indicate that retinal leukostasis is a very early event in diabetic retinopathy with important functional consequences. Both retinal vascular leakage and nonperfusion seem to follow its development. The inhibition of ICAM-1 bioactivity blocks diabetic retinal leukostasis and potently prevents blood–retinal barrier breakdown. Although not directly tested here, leukostasis seems to be associated with the development of vascular nonperfusion, and thus its inhibition may also prevent capillary dropout. Indeed, activated leukocytes are increased in diabetes (20) and leukocytes have been associated with capillary loss in the diabetic choroid (21). The inciting stimulus for ICAM-1 up-regulation remains unknown; however, it is not likely to be endothelial cell death, because ICAM-1 inhibition largely maintains the blood–retinal barrier. Taken together, our data show that ICAM-1-mediated leukostasis is increased in the retinal vasculature very early in diabetes and accounts for the majority of diabetes-associated retinal vascular leakage. Thus, these data implicate ICAM-1 as a potential therapeutic target for the prevention of many of the sight-threatening retinal abnormalities associated with diabetes.
Acknowledgments
We thank Drs. Ming Lu and Steven Stechshulte for their critical review of the manuscript. This work was supported by the Roberta W. Siegel Fund, the American Diabetes Association, the Juvenile Diabetes Foundation, the McClintock Fund, and the Massachusetts Lions.
ABBREVIATIONS
- ICAM-1
intercellular adhesion molecule-1
- AOLF
acridine orange leukocyte fluorography
Footnotes
This paper was submitted directly (Track II) to the Proceedings Office.
References
- 1.McLeod D S, Lefer D J, Merges C, Lutty G A. Am J Pathol. 1995;147:642–653. [PMC free article] [PubMed] [Google Scholar]
- 2.Schröder S, Palinski W, Schmid-Schönbein G W. Am J Pathol. 1991;139:81–100. [PMC free article] [PubMed] [Google Scholar]
- 3.Miyamoto K, Hiroshiba N, Tsujikawa A, Ogura Y. Invest Ophthalmol Visual Sci. 1998;39:2190–2194. [PubMed] [Google Scholar]
- 4.Springer T A. Nature (London) 1990;346:425–434. doi: 10.1038/346425a0. [DOI] [PubMed] [Google Scholar]
- 5.Luscinskas F W, Cybulsky M I, Kiely J M, Peckins C S, Davis V M, Gimbrone M A. J Immunol. 1991;146:1617–1625. [PubMed] [Google Scholar]
- 6.Nishiwaki H, Ogura Y, Kimura H, Kiryu J, Miyamoto K, Matsuda N. Invest Ophthalmol Visual Sci. 1996;37:1341–1347. [PubMed] [Google Scholar]
- 7.Miyamoto K, Ogura Y, Hamada M, Nishiwaki H, Hiroshiba N, Honda Y. Invest Ophthalmol Visual Sci. 1996;37:2708–2715. [PubMed] [Google Scholar]
- 8.Tilton R G, Chang K, Hasan K S, Smith S R, Petrash J M, Misko T P, Moore W M, Currie M G, Corbett J A, McDaniel M L, et al. Diabetes. 1993;42:221–232. doi: 10.2337/diab.42.2.221. [DOI] [PubMed] [Google Scholar]
- 9.Tilton R G, Kawamura T, Chang K C, Ido Y, Bjercke R J, Stephan C C, Brock T A, Williamson J R. J Clin Invest. 1997;99:2192–2202. doi: 10.1172/JCI119392. [DOI] [PMC free article] [PubMed] [Google Scholar]
- 10.Del Maschio A, Zanetti A, Corada M, Rival Y, Ruco L, Lampugnani M G, Dejana E. J Cell Biol. 1996;135:497–510. doi: 10.1083/jcb.135.2.497. [DOI] [PMC free article] [PubMed] [Google Scholar]
- 11.Bolton S J, Anthony D C, Perry V H. Neuroscience. 1998;86:1245–1257. doi: 10.1016/s0306-4522(98)00058-x. [DOI] [PubMed] [Google Scholar]
- 12.Kurose I, Anderson D C, Miyasaka M, Tamatani T, Paulson J C, Todd R F, Rusche J R, Granger D N. Circ Res. 1994;74:336–343. doi: 10.1161/01.res.74.2.336. [DOI] [PubMed] [Google Scholar]
- 13.Vinores S A, Gadegbeku C, Campochiaro P A, Green W R. Am J Pathol. 1989;134:231–235. [PMC free article] [PubMed] [Google Scholar]
- 14.Yamana Y, Oka Y, Ohnishi Y, Ishibashi T, Inoguchi T. Br J Ophthalmol. 1988;72:660–665. doi: 10.1136/bjo.72.9.660. [DOI] [PMC free article] [PubMed] [Google Scholar]
- 15.Bandello F, Gass J D, Lattanzio R, Brancato R. Am J Ophthalmol. 1996;122:494–501. doi: 10.1016/s0002-9394(14)72108-7. [DOI] [PubMed] [Google Scholar]
- 16.Takahashi K, Kishi S, Muraoka K, Shimizu K. Am J Ophthalmol. 1998;126:791–797. doi: 10.1016/s0002-9394(98)00242-6. [DOI] [PubMed] [Google Scholar]
- 17.Tamatani T, Miyasaka M. Int Immunol. 1990;2:165–171. doi: 10.1093/intimm/2.2.165. [DOI] [PubMed] [Google Scholar]
- 18.Kawasaki K, Yaoita E, Yamamoto T, Tamatani T, Miyasaka M, Kihara I. J Immunol. 1993;150:1074–1083. [PubMed] [Google Scholar]
- 19.Kelly K J, Williams W W, Jr, Colvin R B, Bonventre J V. Proc Natl Acad Sci USA. 1994;91:812–816. doi: 10.1073/pnas.91.2.812. [DOI] [PMC free article] [PubMed] [Google Scholar]
- 20.Wierusz-Wysocka B, Wysocki H, Siekierka H, Wykretowicz A, Szczepanik A, Klimas R. J Leukocyte Biol. 1987;42:519–523. doi: 10.1002/jlb.42.5.519. [DOI] [PubMed] [Google Scholar]
- 21.Lutty G A, Cao J, McLeod D S. Am J Pathol. 1997;151:707–714. [PMC free article] [PubMed] [Google Scholar]


