

Abstract
A new approach, termed whole-community RNA amplification (WCRA), was developed to provide sufficient amounts of mRNAs from environmental samples for microarray analysis. This method employs fusion primers (six to nine random nucleotides with an attached T7 promoter) for the first-strand synthesis. The shortest primer (T7N6S) gave the best results in terms of the yield and representativeness of amplification. About 1,200- to 1,800-fold amplification was obtained with amounts of the RNA templates ranging from 10 to 100 ng, and very representative detection was obtained with 50 to 100 ng total RNA. Evaluation with a Shewanella oneidensis Δfur strain revealed that the amplification method which we developed could preserve the original abundance relationships of mRNAs. In addition, to determine whether representative detection of RNAs can be achieved with mixed community samples, amplification biases were evaluated with a mixture containing equal quantities of RNAs (100 ng each) from four bacterial species, and representative amplification was also obtained. Finally, the method which we developed was applied to the active microbial populations in a denitrifying fluidized bed reactor used for denitrification of contaminated groundwater and ethanol-stimulated groundwater samples for uranium reduction. The genes expressed were consistent with the expected functions of the bioreactor and groundwater system, suggesting that this approach is useful for analyzing the functional activities of microbial communities. This is one of the first demonstrations that microarray-based technology can be used to successfully detect the activities of microbial communities from real environmental samples in a high-throughput fashion.
Microarray-based genomic technology is a powerful tool for viewing the expression of thousands of genes simultaneously in a single experiment (13). While this technology was initially designed for transcriptional profiling of a single species, its applications have been dramatically extended to environmental applications in recent years (1, 3, 4, 7, 8, 20, 23, 30, 32, 33, 46, 47, 48). One of the greatest challenges in using microarrays for analyzing environmental samples is the low detection sensitivity of microarray-based hybridization in combination with the low biomass often present in samples from environmental settings. We previously developed a DNA-based microarray detection approach coupled with whole-community genome amplification, and we utilized this technique to analyze microbial community structure and demonstrated that it can be used for low-biomass groundwater microbial communities (41). However, this approach could not be directly adapted and used for mRNA-based activity analyses.
A practical problem in detecting mRNAs from environmental samples by microarray hybridization is obtaining a sufficient amount of mRNAs for analysis. Some type of signal amplification prior to hybridization is needed. However, random PCR-based amplification is not an appropriate choice due to amplification bias and thus the loss of quantitative information (27, 38). Additionally, the gene-by-gene nature of conventional PCR (while potentially useful for rRNAs) severely restricts the throughput advantages of microarray analyses for functional genes. T7 polymerase-based linear amplification is an attractive alternative because of its ability to preserve the quantitative information for various mRNA species, and this approach has been widely used in eukaryotic studies (2, 11, 28, 37, 43, 45). In eukaryotic studies, a T7 RNA promoter sequence is attached to poly(dT) oligonucleotides, which are then used for reverse transcription of mRNAs to synthesize cDNAs. The synthesized cDNAs are in turn used as templates for mRNA amplification with T7 RNA polymerase. Generally, 1,000-fold amplification can be obtained by a single round of amplification, and a 105-fold increase can be obtained by two rounds of amplification (39). However, these approaches cannot be used for directly amplifying prokaryotic mRNAs because of the lack of a poly(A) tail in the mRNAs.
In this study, a new method, termed whole-community RNA amplification (WCRA), was developed for randomly amplifying whole-community RNAs. In this approach, a T7 RNA promoter sequence is attached to a random hexamer, which is then used for reverse transcription of RNAs. The cDNAs synthesized are in turn used as templates for linear RNA amplification with T7 RNA polymerase. This method was optimized with primers of various sizes and was evaluated using an in-frame deletion mutant of Shewanella oneidensis with a mutation in a regulatory gene, artificial mixed communities, and real environmental samples from a bioreactor and a groundwater remediation site. Our results indicate that the method which we developed can preserve the original abundance relationships of mRNAs and is useful for analyzing functional activities of microbial communities.
MATERIALS AND METHODS
Bacterial strains and growth conditions.
All biological samples used in this study are listed in Table 1. Most of the strains were grown in Luria-Bertani broth; the exceptions were Nitrosomonas europaea and Rhodopseudomonas palustris, which were grown under the conditions described previously by Ensign et al. and Kawasaki et al., respectively (9, 19).
TABLE 1.
Bacterial strains, samples, and microarrays used in this study
| Material | Relevant characteristics | Source or reference |
|---|---|---|
| Bacteria and samples | ||
| S. oneidensis MR-1 | Wild type | Lab stock |
| S. oneidensis Δfur | In-frame fur deletion mutant derived from MR-1 | Lab stock |
| D. radiodurans | Strain DEIRA | Lab stock |
| R. palustris | Strain CGA009 | Lab stock |
| N. europaea | Strain ATCC 19718 | Lab stock |
| FBR | Samples from FRC site | 41 |
| FW029 | Well 29 of FRC site | 41 |
| Microarrays | ||
| S. oneidensis | Whole-genome cDNA array | 12 |
| D. radiodurans | Whole-genome cDNA array | 21 |
| R. palustris | Whole-genome cDNA array | 41 |
| N. europaea | Whole-genome cDNA array | 40 |
| FGA | Functional gene array for environmental samples | 41 |
Microarray construction and specifications.
Whole-genome microarrays for S. oneidensis MR-1 (∼4.9 Mb), a metal-reducing bacterium, Deinococcus radiodurans (∼3.2 Mb), a radiation-resistant bacterium, R. palustris (∼4.8 Mb), a photosynthetic bacterium, and N. europaea, an ammonium-oxidizing bacterium (∼2.7 Mb), were constructed as described previously (Table 1) (12, 21, 40). The numbers of genes of S. oneidensis, D. radiodurans, R. palustris, and N. europaea spotted on slides were 4,648, 2,976, 4,752 and 2,318, respectively. Functional gene arrays (FGAs) were also constructed as previously described (30, 41). The FGAs contained probes for various groups of genes involved in carbon, nitrogen, and sulfur cycling along with genes involved in organic contaminant degradation and metal resistance and reduction. Each FGA contained 2,006 oligonucleotide probes printed in duplicate along with 10 eukaryotic gene probes (6 probes for human genes and 4 probes for plant genes) and two highly conserved 16S rRNA gene probes as negative and positive controls.
Sampling and RNA extraction.
Cells growing logarithmically under aerobic conditions were harvested by centrifugation at the maximum speed with a 5415R centrifuge (Eppendorf, Germany) for 10 s, and the pellets were then placed in liquid nitrogen. Altogether, three parallel identical experiments were performed and treated as biological replicates.
Environmental samples were obtained from the Field Research Center (FRC) site of the DOE Environmental Remediation Science Program at the Oak Ridge Reservation in Oak Ridge, TN. Detailed descriptions of the FRC are available online at http://www.esd.ornl.gov/nabirfrc/. Two types of samples were collected from the FRC site. One type was from a denitrifying fluidized bed reactor (FBR), which contained a granular activated carbon matrix. This FBR was used for removing nitrate from groundwater (41). The FBR samples were frozen in liquid nitrogen immediately after collection and transported to the laboratory on dry ice for storage until RNA extraction. Groundwater was also collected from a heavily contaminated well (FW029) in FRC Area 1, which was repeatedly biostimulated with ethanol to increase microbial activity for uranium reduction (17). Two liters of groundwater was collected in glass bottles and transported to the laboratory on ice. Microbial biomass was then harvested onto 0.2-μm Nuclepore polycarbonate filters (Whatman, Clifton, NJ) using vacuum filtration. Cell pellets were either processed immediately for RNA or stored at −80°C.
Total RNA from laboratory-grown bacterial cells was extracted using the Trizol reagent according to manufacturer's instructions (Invitrogen, Carlsbad, CA). For R. palustris the cells were thawed in 100 μl of denaturing solution (4 M guanidine isothiocyonate, 10 mM Tris [pH 7.4], 1 mM EDTA, 0.5% mercaptoethanol). The samples were then subjected to grinding and three freeze-thaw cycles before 1 ml of the Trizol reagent was added. For the environmental samples, both RNA and DNA were extracted by using a previously described procedure and separated with a QIAGEN RNA/DNA mini kit (14). The resulting crude RNA was treated with DNase I (Ambion, Austin, TX) and then purified with an RNeasy mini kit (QIAGEN, Valencia, CA) used according to the manufacturer's instructions. The quantity and quality of RNA were assessed using a NanoDrop ND-1000 spectrophotometer (NanoDrop Technology, Rockland, DE) and agarose gel electrophoresis.
RNA amplification.
All reagents used for RNA amplification were obtained from Invitrogen unless indicated otherwise. For first-strand synthesis we employed a 20-μl reverse transcription reaction mixture containing 200 U SuperScript III, 1 μl of linear acrylamide (100 μg/ml; Ambion, Austin, TX), and 1 μg of a primer (see Fig. 2A) in 1× first-strand buffer with 5 to 500 ng of total RNA, which was incubated at 50°C for 3 h. Second-strand synthesis was carried out in a 150-μl mixture containing 40 U of Escherichia coli DNA polymerase I, 2 U of E. coli RNase H, and 10 U of E. coli DNA ligase in 1× second-strand buffer, which was incubated at 16°C for 2 h. The double-stranded cDNA was polished by adding 20 U of T4 DNA polymerase and incubating the preparation at 16°C for 5 min. The reaction was stopped by adding 10 μl of 0.5 M EDTA and then adding 10 μl of 1 M NaOH, and the mixture was then incubated at 65°C for 10 min. The cDNA mixture was neutralized with 25 μl of 1 M Tris-HCl (pH 7.5), and an equal volume of phenol-chloroform-isoamyl alcohol (25:24:1) was added. The entire mixture was transferred to a Phase Lock gel (Bio-Rad, Hercules, CA) and separated by centrifugation. To the aqueous phase, 1 μl of linear acrylamide was added, followed by 0.5 volume of 7.5 M ammonium acetate and 2.5 volumes of 100% ethanol prior to storage at −20°C overnight. The cDNA was then pelleted by centrifugation for 20 min, air dried, and resuspended in 16 μl of water. The in vitro transcription reaction was carried out in a 40-μl mixture using a MEGAscript T7 kit (Ambion) according to the manufacturer's instructions at 37°C in a Problot24 hybridization oven (Labnet, Edison, NJ) for 16 h. Amplified antisense RNA was purified using either an RNeasy MinElute cleanup kit or an RNeasy mini kit (QIAGEN, Valencia, CA). The resulting antisense RNA was quantified by determining the absorbance at 260 nm with the NanoDrop ND-1000 spectrophotometer and/or by determining the fluorescence using Ribogreen dye (Molecular Probes, Eugene, OR).
FIG. 2.

Evaluation of amplification biases using whole-genome S. oneidensis cDNA microarrays. (A) Primers tested in this study. N indicates a random nucleotide. (B) Ratios (amplified/unamplified) were plotted against the order of the genes in the genome, from SO0001 to SOA0173. In the unamplified panel, hybridization was carried out with the same unamplified RNA labeled with Cy3 and Cy5. In all other panels, 500 ng of RNA was amplified using WCRA with the primers indicated, labeled with Cy5, and hybridized with unamplified RNA (Cy3).
RNA labeling and hybridization.
Aliquots (5 μg) of total RNA or amplified RNA were fluorescently labeled using random primers, SuperScript III (Invitrogen), and Cy3 or Cy5 dye (Amersham) to generate cDNA according to the manufacturer's instructions. Hybridization and posthybridization procedures were performed as previously described (12, 21, 41). All microarray experiments were carried out in triplicate.
Microarray scanning and data processing.
A ScanArray Express scanner (Perkin-Elmer, Wellesley, MA) was used for scanning microarray slides according to the manufacturer's instructions. Scanned images were then processed with ImaGene (Biodiscovery, Los Angeles, CA). Positive hybridization spots were determined based on the signal-to-noise ratio (SNR), which was calculated using the following formula (35): SNR = (signal intensity − background)/standard deviation of background. Spots with an SNR greater than or equal to 3 were considered positive hybridization spots (PHS). Data processing procedures, such as outlier removal, poor spot removal, and normalization, were carried out as described previously (41). Various statistical analyses of gene expression data obtained with whole-genome microarrays were carried out using GeneSpring as described previously (12). The FGA data from the environmental samples were analyzed as described previously (41).
Data analysis.
Further statistical analysis was performed for all hybridizations using methods developed in our laboratory (41). In brief, three indexes were used for evaluating amplification representativeness. The first index is representional bias (Dtotal).
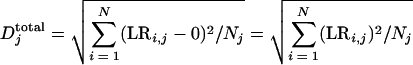 |
where LRij is the log ratio of the signal intensity with amplified RNA to the signal intensity with unamplified RNA for the ith gene in the jth experiment, Nj is the number of genes detected in unamplified RNA in the jth experiment, and Djtotal is the overall average representational bias for the jth experiment. The smaller the Djtotal, the smaller the bias. However, there is no upper limit for the value of Djtotal. Thus, Djtotal is more meaningful for relative comparisons. The second index is the percentage of significantly different genes (%SDG) in amplified RNA and unamplified RNA at a P value of 0.01; this index describes the proportion of the genes in an amplified sample that are significantly different from the genes in an unamplified RNA. The smaller the value, the less bias is introduced by amplification. The third index is the percentage of genes having a change in the ratio of amplified RNA to unamplified RNA greater than 1.5-fold, 2.0-fold, 3.0-fold, or 4.0-fold.
RESULTS
Primer design and evaluation.
The WCRA approach described here consists of reverse transcription with random oligonucleotide primers bearing a T7 promoter and in vitro transcription of the resulting cDNA with T7 RNA polymerase (Fig. 1). The primers were designed to contain the full-length T7 RNA polymerase promoter (5′-AAA CGA CGG CCA GTG AAT TGT AAT ACG ACT CAC TAT AGG CGC-3′) and six, seven, or nine random oligonucleotides (34).
FIG. 1.

Outline of the WCRA method. Gray type, RNA; black type, DNA. The primers used and other details are described in the text.
To select optimal primers for amplification, experiments were carried out with one of the primers shown in Fig. 2A using 500 ng of total RNA from S. oneidensis MR-1 as described in Materials and Methods. The amplified products were labeled with Cy5 and mixed with Cy3-labeled unamplified control RNAs. The RNA mixture was hybridized with S. oneidensis whole-genome microarray slides. A reference control experiment was also carried out by hybridizing two cDNA samples labeled separately with Cy3 or Cy5 dye from the same unamplified total RNA pool. The hybridization results revealed that the PHS covered approximately 70% of the spotted genes on slides. The results also demonstrated that about 99% of the signals were within a 1.5-fold change, and a plot of Cy3/Cy5 ratios showed data points aligned along the line corresponding to ratios close to 1:1 (Fig. 2B, upper left panel) (Table 2).
TABLE 2.
Representativeness of amplifications with the primers tested using an S. oneidensis microarray
| Primer | No. of PHS | Dtotal | SDG0.01 | % of genes having a change in the ratio of amplified RNA to unamplified RNA greater than:
|
|||
|---|---|---|---|---|---|---|---|
| 1.5-Fold | 2.0-Fold | 3.0-Fold | 4.0-Fold | ||||
| Unamplified | 3,243 ± 62 | 0.076 | 1.4 | 1.2 | 0.8 | 0.2 | 0 |
| T7N6 | 3,301 ± 87 | 0.101 | 2.9 | 2.5 | 1.8 | 1.0 | 0.3 |
| T7N7 | 3,255 ± 121 | 0.102 | 3.1 | 2.6 | 1.9 | 1.1 | 0.3 |
| T7N9 | 3,311 ± 159 | 0.125 | 3.8 | 3.3 | 2.2 | 1.6 | 0.8 |
| T7N6S | 3,365 ± 74 | 0.083 | 1.7 | 1.4 | 1.0 | 0.3 | 0.1 |
| T7T7N6S | 3,170 ± 233 | 0.178 | 9.9 | 8.7 | 4.5 | 2.3 | 1.5 |
In the amplified-RNA experiments with different primers, the overall amplification yields (data not shown) and percentages of PHS with primers T7N6, T7N7, and T7N9 were virtually the same (Table 2), but the representational bias increased noticeably with the length of primer (Fig. 2B and Table 2). Based on the observation that the longer primers resulted in more scattered ratios and greater representational biases, we designed a new primer to reduce the length. This primer (T7N6S) was derived from T7N6 but had only the five bases immediately upstream of the T7 promoter. As expected, a plot of the amplified RNA/unamplified RNA ratios obtained with T7N6S showed even tighter alignment along the 1:1 ratio line than the T7N6 plot showed (Fig. 2B, upper right and middle panels). In addition, to explore the possibility of double amplification, we tested primer T7T7N6S, which was derived from T7N6S and was composed of two T7 promoter sequences in opposite orientations. However, no significant increase in amplification yields was obtained. Instead, a much greater representational bias was observed (Fig. 2B).
The proportions of the genes whose hybridization signal ratios (experimental RNA/control RNA) were significantly different from 1 at a P value of 0.01 (SDG0.01) (more than 1.5-fold, 2.0-fold, 3.0-fold, or 4.0-fold different) were calculated (Table 2). While these indexes were not dramatically different for different treatments with different primers, the indexes obtained with T7N6S were the closest to the indexes obtained with unamplified RNA. Based on these observations, we used T7N6S for all subsequent amplification reactions.
Amplification sensitivity and representational bias.
In an experiment to determine the minimum amount of total RNA required for WCRA, we performed an amplification reaction with as little as 5 ng of S. oneidensis total RNA as the starting material, and more than 20 μg of amplified products was obtained (data not shown). This sensitivity is slightly lower than that obtained with eukaryotic total RNA (2).
In order to use WCRA for monitoring gene expression and functional activity, it is desirable that the relative mRNA abundance in the original samples is retained after amplification. To determine the minimum amount of total RNA required for WCRA while the original abundance was maintained, various amounts of RNA (10, 50, 100, and 500 ng) from S. oneidensis were used for amplification, and the amplified products were labeled and hybridized with microarrays. As mentioned above, the number of PHS in the reference experiment was 3,243 ± 62 (Table 3), representing approximately 70% of the genes spotted on the array. The representational bias for the reference experiment was 0.076 (Table 3), which is comparable to the values obtained by multiple displacement amplification with DNA as the template (41).
TABLE 3.
Representativeness of amplifications with different amounts of template and the T7N6S primer using an S. oneidensis microarray
| Amt of template (ng) | No. of PHS | Dtotal | SDG0.01 | % of genes having a change in the ratio of amplified RNA to unamplified RNA greater than:
|
|||
|---|---|---|---|---|---|---|---|
| 1.5-Fold | 2.0-Fold | 3.0-Fold | 4.0-Fold | ||||
| Unamplified | 3,243 ± 62 | 0.076 | 1.4 | 1.2 | 0.8 | 0.2 | 0 |
| 10 | 2,265 ± 328 | 0.385 | 19 | 14 | 5 | 2 | 0.8 |
| 50 | 3,159 ± 173 | 0.122 | 5.7 | 4.1 | 2 | 0.9 | 0.3 |
| 100 | 3,241 ± 119 | 0.098 | 3.6 | 3.0 | 2 | 0.7 | 0.2 |
| 500 | 3,365 ± 74 | 0.083 | 1.7 | 1.4 | 0.8 | 0.1 | 0.1 |
The amount of template RNA had significant effects on the overall average representational bias. The representational bias obtained with 500 ng of template RNA was similar to that obtained with the unamplified RNA (Table 3). The overall average representational bias was approximately fivefold greater with 10 ng of template RNA than with 500 ng of RNA template (Table 3). While the overall average representational biases with 50 and 100 ng of template RNA were slightly greater than that with 500 ng of template RNA, they were three- to fourfold less than that with 10 ng of RNA. In addition, SDG0.01 increased as the amount of template RNA decreased (Table 3). With 10 ng of template RNA, SDG0.01 was 20% of the open reading frames (ORFs), but SDG0.01 was less than 6% of the ORFs with amounts of RNA template ranging from 50 to 500 ng (Table 3). Furthermore, only a small portion of the ORFs (≤2%) showed more than a twofold difference when 50 ng or more of the template RNA was used. These results suggest that very good representative amplification can be achieved with as little as 50 ng of RNA. They also indicated that amplification with even smaller amounts of template RNA (i.e., 10 ng) can still provide representative information for most of the genes examined.
Detecting differences in gene expression between wild-type and mutant strains.
Besides representational bias, compression of expression differences between RNA samples has been a major concern in RNA amplification studies (2). To determine whether WCRA-based microarray hybridization is able to reflect expression differences between samples, experiments were carried out with RNAs from S. oneidensis wild-type and Δfur mutant strains. Both the mutant and wild-type strains were grown under aerobic conditions and sampled as described in Materials and Methods. Fifty or 100 ng of total RNA from the mutant was amplified, labeled with Cy5, and cohybridized with Cy3-labeled unamplified wild-type RNA on S. oneidensis microarrays. A reference experiment was performed with unamplified RNAs from both the mutant and wild-type strains.
The overall expression profiles for these hybridizations showed that there were significant similarities (Fig. 3A, B, and C). To quantify differences among these profiles, expression ratios obtained with amplified template RNA of the mutant (amplified mutant RNA/unamplified wild-type RNA) were plotted against expression ratios obtained with unamplified template RNA of the mutant (unamplified mutant RNA/unamplified wild-type RNA) (Fig. 3D). The results clearly showed that the gene expression profiles for amplified products were significantly correlated (r = 0.955 for 100 ng of RNA and r = 0.931 for 50 ng of RNA) (data not shown) with the gene expression profiles for the reference unamplified RNA (Fig. 3D), suggesting that the WCRA-based amplification largely retained the abundance relationships characteristic of the starting materials.
FIG. 3.

Scatter plots of genes from replicate hybridizations and replicate amplification reactions. (A to C) Scatter plots comparing the expression profiles of unamplified RNA from the wild-type strain (wt) with the expression profiles of unamplified RNA (A), 100 ng amplified starting RNA (B), or 50 ng amplified starting RNA (C) from the Δfur strain. (D) Quantitative analysis of relationships for expression ratios of all genes (Δfur RNA/wild-type RNA) between the amplified RNA (100 ng) and the unamplified RNA.
To determine whether the WCRA-based amplification significantly altered the differences in expression of highly induced or repressed genes, we selected 30 genes known to be greatly affected by a fur mutation for further analysis (36). While the levels of expression of these genes differed slightly among the hybridizations, none of the genes showed a contradictory response (Fig. 4A). The differences in expression of these genes were then quantitatively accessed by plotting the expression ratios for the amplified RNA (amplified mutant RNA/unamplified wild-type RNA) against the expression ratios obtained for the unamplified RNA (Fig. 4B). Strong linear relationships were observed (for 100 ng RNA, r = 0.912; for 50 ng RNA, r = 0.895). These results indicated that WCRA with 50 ng or more of starting RNA is able to largely preserve the original abundance relationships.
FIG. 4.

Amplification bias analysis by expression ratio comparison. All 30 genes examined have been reported to be highly affected by the fur mutation (36). (A) Expression ratios (Δfur RNA/wild-type RNA) for the genes obtained with unamplified RNA and 50 and 100 ng of the starting RNA. (B) Quantitative analysis of relationships for expression ratios of the 30 genes (Δfur RNA/wild-type RNA) between the amplified RNA and the unamplified RNA.
Representational amplification with artificial communities of mixed species.
To determine whether representative detection of RNAs can be achieved with mixed community samples, equal quantities of RNAs (100 ng) from S. oneidensis, D. radiodurans, R. palustris, and N. europaea were mixed, amplified, and subjected to hybridization. A mixture containing 2.5 μg unamplified RNA from each species was used as a control. For all four genomes examined, similar numbers of PHS were detected using the amplified and unamplified products of each individual bacterium from these hybridizations (Table 4).
TABLE 4.
Representativeness of amplifications with mixed samples using the T7N6S primer
| Species | Sample | PHS | Dtotal | SDG0.01 | % of genes having a change in the ratio of amplified RNA to unamplified RNA greater than:
|
|||
|---|---|---|---|---|---|---|---|---|
| 1.5-Fold | 2.0-Fold | 3.0-Fold | 4.0-Fold | |||||
| S. oneidensis | Unamplified | 3,704 ± 73 | 0.111 | 3.8 | 3 | 1.4 | 0.4 | 0.1 |
| WCRA | 3,631 ± 103 | 0.135 | 5.1 | 4.1 | 2.9 | 0.5 | 0.2 | |
| D. radiodurans | Unamplified | 2,388 ± 90 | 0.094 | 3 | 2.3 | 1.2 | 0.4 | 0.2 |
| WCRA | 2,293 ± 83 | 0.087 | 2.8 | 2.2 | 1.8 | 0.3 | 0.1 | |
| N. europaea | Unamplified | 1,969 ± 65 | 0.12 | 3.9 | 3 | 1.3 | 0.3 | 0.1 |
| WCRA | 1,901 ± 92 | 0.143 | 4.5 | 3.4 | 2.6 | 0.5 | 0.1 | |
| R. palustris | Unamplified | 3,673 ± 174 | 0.197 | 6.4 | 5.1 | 2.8 | 0.7 | 0.2 |
| WCRA | 3,512 ± 227 | 0.216 | 7.3 | 5.6 | 3.6 | 0.9 | 0.2 | |
Also, the overall representational biases between the amplified treatment samples and unamplified reference samples were more or less comparable for all genomes examined. While about 7 to 18% greater representational biases for the amplified treatment samples were observed for S. oneidensis, N. europaea, and R. palustris, the representational bias of the amplified treatment sample was about 7% less than the representational bias of the unamplified reference sample for D. radiodurans. In addition, the proportions of the genes whose hybridization ratios were significantly different from the reference point at a P value of 0.01 were less than 7% for all of the genomes examined (Table 4). Only a small portion of the ORFs (4%) exhibited a >2-fold difference across all genomes (Table 4). These results suggest that very good representative detection can be obtained with mixed RNA templates.
Application to environmental samples.
To further test the representative nature of WCRA, experiments were carried out with environmental samples containing microbial communities that were more complex than the artificial mixtures used in the experiments described above. Two different types of samples from the Environmental Remediation Science Program FRC site were tested by the WCRA procedure. The FBR samples were obtained from a continuously operated, ethanol-stimulated, fluidized bed reactor which actively denitrified and contained large amounts of biomass. The bacterial community in these samples has been examined previously using a 16S rRNA gene clonal library (15). Only three unique operational taxonomic units were found, including bacteria exhibiting at least 97% sequence identity to Zoogloea ramigera, Rhodobacter, and an uncultivated Azoarcus (83%), suggesting that the biological diversity in these samples was extremely low. WCRA was carried out with 5 μg of amplified RNA that originated from 100 ng of starting total RNA and was hybridized to FGA slides along with 5 μg of unamplified total RNA as a control. While eight genes were detected with unamplified RNA, an additional seven genes were found with amplified RNAs (data not shown). The genes that were detected were mostly involved in the reduction of nitrate, nitrite, and sulfite, as well as contaminant degradation, which is consistent with the functions of the bioreactor (15). On the basis of the fact that more genes were detected in the amplified RNAs, this WCRA-based method appears to have advantages over conventional microarray hybridization for dissection of the bacterial community.
We also used WCRA with groundwater samples collected from well FW029 at the FRC. The FRC is contaminated with a variety of organic solvents and hydrocarbons in addition to nitrate and uranium, and many wells have been repeatedly biostimulated with ethanol for uranium reduction (17, 42). A few recent studies revealed that the microbial community is much more complex than the FBR community (17, 41). In this experiment, 5 μg of labeled amplified products from 100 ng of community RNA was hybridized on FGA slides, and a total of 39 PHS were observed (Table 5). The genes that were detected were mainly genes from members of common genera, such as Pseudomonas, Rhodococcus, Burkholderia, and Streptomyces. Some of the representative genes included bmoC (benzene monooxygenase ferredoxin) from Pseudomonas aeruginosa, pcaG (protocatechuate dioxygenase alpha subunit) and clcD (dienelactone hydrolase) from Rhodococcus opacus, ppk (polyphosphate kinase) from Vibrio cholerae, estF1 (lactone-specific esterase) from Pseudomonas fluorescens, pcaG (protocatechuate 3,4-dioxygenase alpha subunit) and pcaF (beta-ketoadipyl-coenzyme A thiolase) from Streptomyces sp. strain 2065, pcaH (protocatechuate 3,4-dioxygenase beta subunit) from alphaproteobacterial strain Y3F, amnA (2-aminophenol 1,6-dioxygenase alpha subunit) from Pseudomonas sp., boxA (reductase) from Azoarcus evansii, dsr (dissimilatory sulfite reductase subunit B) from an uncultured bacterium, and an unknown gene from Ralstonia eutropha. In addition to genes involved in nitrate and sulfate reduction, most of these genes encode enzymes which degrade various organic chemicals. This is in agreement with the nature of well FW029 at the FRC, where compounds such as organic solvents and hydrocarbons probably are some of the prominent sources of carbon in this otherwise highly oligotrophic environment.
TABLE 5.
Genes identified in an FW029 sample by WCRA using amplified RNA
| Gene no. | Gene | Product | Source | SNR |
|---|---|---|---|---|
| 151578 | tcbD | Cycloisomerase II | Pseudomonas sp. strain AP-3 | 10.30 ± 3.70 |
| 1754625a | bmoC | Benzene monooxygenase ferredoxin | Pseudomonas aeruginosa | 6.73 ± 2.67 |
| 2588986 | phdK | 2-Carboxybenzaldehyde dehydrogenase | Nocardioides sp. strain KP7 | 4.05 ± 0.82 |
| 2645418 | xynD | Xylanase | Caldicellulosiruptor saccharolyticus | 13.51 ± 4.30 |
| 2935025a | pcaG | Protocatechuate dioxygenase alpha subunit | Rhodococcus opacus | 3.03 ± 0.97 |
| 2935027 | pcaL | 3-Oxoadipate enol-lactone hydrolase/ 4-carboxymuconolactone decarboxylase | Rhodococcus opacus | 6.44 ± 2.69 |
| 2935034a | clcD | Dienelactone hydrolase | Rhodococcus opacus | 3.63 ± 0.48 |
| 3059198 | bphC6 | 2,3-Dihydroxybiphenyl 1,2-dioxygenase | Rhodococcus erythropolis | 7.22 ± 1.74 |
| 3372191 | nifH | Dinitrogenase reductase | Unidentified bacterium | 6.62 ± 3.04 |
| 3452465a | ppk | Polyphosphate kinase | Vibrio cholerae | 3.08 ± 0.18 |
| 3641341a | estF1 | Lactone-specific esterase | Pseudomonas fluorescens | 3.06 ± 0.27 |
| 3659633 | ureC | Urease alpha subunit | Synechococcus sp. strain WH7805 | 8.76 ± 2.08 |
| 3758885 | nirK | Nitrite reductase | Sinorhizobium meliloti | 3.05 ± 1.12 |
| 4160661a | pcaG | Protocatechuate 3,4-dioxygenase alpha subunit | Streptomyces sp. strain 2065 | 5.25 ± 1.34 |
| 4530443a | pcaF | Beta-ketoadipyl-coenzyme A thiolase | Streptomyces sp. strain 2065 | 4.50 ± 1.01 |
| 4633082 | msmD | Reductase component of methanesulfonate | Methylosulfonomonas methylovora | 9.24 ± 3.93 |
| 6048988 | phnG1 | 2-Hydroxymuconic semialdehyde dehydrogenase | Burkholderia sp. strain RP007 | 3.44 ± 0.36 |
| 6049281 | xenA | Xenobiotic reductase A | Pseudomonas putida | 16.65 ± 3.91 |
| 6540593 | fcbC | 4-Hydroxybenzoyl coenzyme A thioesterase | Pseudomonas sp. strain DJ-12 | 3.52 ± 1.16 |
| 7619816 | phdA | Iron-sulfur protein large subunit | Nocardioides sp. strain KP7 | 12.08 ± 2.05 |
| 7649293a | pcaH | Protocatechuate 3,4-dioxygenase beta subunit | Alphaproteobacterial strain Y3F | 3.05 ± 0.23 |
| 8926385 | ohpB | 3-(2-Hydroxyphenyl)propionic acid monooxygenase | Rhodococcus sp. strain M5 | 7.97 ± 3.41 |
| 8978311 | bphD2 | 2-Hydroxy-6-oxo-6-phenylhexa-2,4-dienoate hydrolase | Rhodococcus sp. strain RHA1 | 5.97 ± 1.64 |
| 9651045a | amnA | AmnA (2-aminophenol metabolism) | Pseudomonas sp. strain AP-3 | 3.44 ± 0.63 |
| 10956967 | bphA2b | Large subunit of aromatic oxygenase | Novosphingobium aromaticivorans | 8.32 ± 2.74 |
| 11967273a | Putative type II GTP-cyclohydrolase | Ralstonia eutropha | 9.53 ± 0.94 | |
| 12655804 | boxB | BoxB (component of a putative benzoyl-coenzyme A oxygenase) | Azoarcus evansii | 8.51 ± 0.57 |
| 12655805a | boxA | BoxA (component of a putative benzoyl-coenzyme A oxygenase) | Azoarcus evansii | 3.07 ± 0.37 |
| 12697568 | cbdS | Transcriptional activator | Burkholderia sp. strain TH2 | 10.22 ± 0.81 |
| 12697571 | cbdC | NADH acceptor reductase | Burkholderia sp. strain TH2 | 5.41 ± 1.77 |
| 13249547a | dsr | Dissimilatory sulfite reductase subunit B | Uncultured bacterium | 6.00 ± 1.61 |
| 15787976 | dsrB | Dissimilatory sulfite reductase beta subunit | Desulfitobacterium dehalogenans | 8.98 ± 1.83 |
| 16304107 | ppk | Polyphosphate kinase | Nodularia spumigena | 3.02 ± 0.83 |
| 16506222 | nasA | Assimilatory nitrate reductase | Uncultured bacterium | 7.23 ± 2.86 |
| 17385085 | narG | Putative nitrate reductase | Bacillus sp. strain Lgg5.2 | 3.82 ± 0.58 |
| 20502011 | dsrA | Dissimilatory sulfite reductase subunit A | Uncultured bacterium | 3.61 ± 2.14 |
| M305054 | nirk | Nitrite reductase | Lab clone (accession no. AY195834) | 10.62 ± 5.11 |
| W306677A | dsr | Dissimilatory sulfite reductase | Lab clone | 6.84 ± 1.22 |
| E08-16-129 | nirK | Nitrite reductase | Lab clone | 6.05 ± 1.10 |
Gene detected by microarray hybridization of both amplified RNA (WCRA) and DNA (whole-community genome amplification).
It is worth noting that a few sets of genes whose products participate in the same metabolic pathways were revealed by hybridizations with amplified RNAs. The largest group contained five genes, pcaG and pcaL (3-oxoadipate enol-lactone hydrolase/4-carboxymuconolactone decarboxylase) from R. opacus, pcaG and pcaF from Streptomyces sp. strain 2065, and pcaH from alphaproteobacterial strain Y3F. All of these genes are involved in aromatic compound degradation via the catechol or protocatechuate branch of the 3-oxoadipate pathway (6, 10, 18). Except for pcaL, all of these genes were detected in our previous study using genomic DNA hybridization (41).
Other sets included cbdS (transcriptional activator) and cbdC (NADH acceptor reductase) from Burkholderia sp. strain TH2 and boxA and boxB of A. evansii. While cbdC is a member of the cbdABC operon, whose products function in the halobenzoate metabolic pathway, CbdS is the regulatory protein controlling the operon (31). The boxA and boxB genes belong to the same operon in A. evansii. Physiologically, BoxBA act as a benzoyl-coenzyme A dioxygenase/reductase which also plays a role in aromatic metabolism (44). However, only boxA was identified in hybridizations with genomic DNA. Unfortunately, only a few such genes from the same operons were represented on the FGA, but these types of genes appear to be useful for testing the reliability of amplification methods.
DISCUSSION
Recently, several RNA amplification approaches have been developed to generate the microgram quantities of RNA required to perform microarray hybridizations. The method most commonly used is derived from a protocol first described by Eberwine's group, which utilizes DNA-dependent phage (T7) RNA polymerase because of its extremely high specificity for its cognate promoter sequence (34). After modification, the method has been successfully used for microarray studies when too little RNA was available to perform the analysis using conventional labeling protocols (2, 22, 25). Furthermore, use of additional rounds of amplification with much smaller amounts of RNA has been shown to give reproducible results for a single RNA sample (24, 37). However, the approaches using T7 RNA polymerase developed so far do have one major limitation: they are all designed for eukaryotic mRNA using poly(T) primers and therefore cannot be used for prokaryotic systems. One attempt to overcome this limitation has been described, and in this attempt additional steps that added a poly(A) tail to total RNA from prokaryotic or environmental samples were used (5). This method requires up to 2 μg of gel-purified RNA for the poly(A) tailing reaction, and amplification is achieved by PCR, which tends to distort abundance relationships. Theoretically, this technique is applicable to mRNA and therefore to transcriptomic analyses of environmental samples. However, the feasibility of the method was established with the 16S rRNA gene. It is not known whether the sensitivity of the method is sufficient for mRNA-based microarray analysis. In addition, an attempt by Moreno-Paz and Parro to use random-primed reverse transcription coupled to in vitro transcription has been reported recently (26). In this approach the workers employed the same strategy that we used in this study for amplification of a small quantity of bacterial RNA. The primer used for first-strand cDNA synthesis by Moreno-Paz and Parro was T7N9, with which we have performed amplification successfully. However, our systematic analysis revealed that T7N9 introduced a higher level of representational bias in amplified products than T7N6 and T7N7 introduced. Based on the observation that the longer the primers are, the higher the levels of representational bias are, we designed a new primer, T7N6S. The representational biases of amplification with T7N6S were significantly reduced. Although different primers were used in these two studies, a common conclusion was drawn, that random-primer-based RNA amplification is reliable and powerful enough to allow workers to perform microarray analyses with environmental samples.
In the present study, we developed a technique (WCRA) capable of amplifying small amounts of environmental prokaryotic RNA without significantly distorting the abundance relationships among different mRNA species. Our results indicated that primer lengths have significant effects on amplification representativeness. The shorter primer (T7N6S) had significant advantages in terms of amplification evenness. In addition, our results demonstrated that the amplification bias increased as the amount of template RNA decreased, suggesting that the amount of starting material is critical for WCRA reproducibility. With this approach, representational amplification can be achieved with 50 ng or more of prokaryotic RNA, although amplification was successfully carried out with 5 ng of RNA. Compared to eukaryotic mRNA amplification using a poly(dT) primer, this method requires significantly more starting material for representational amplification (2).
One of the main applications of microarray analysis is identification of transcripts whose abundance is different in different samples. It has been reported that the differences decrease when less starting RNA is used for amplification (11, 16, 24, 29, 37). An examination of transcriptional profiles for S. oneidensis wild-type and fur mutant strains revealed that WCRA with 50 ng or more of RNA as the starting material was able to largely preserve the expression differences identified by microarray analysis of unamplified RNA. The compression effects of the method reported here are in good agreement with those reported previously (11, 16, 28, 29).
One of our main goals is to use microarray technology to monitor functional activities of microbial communities in natural settings. However, it is difficult to assess microbial communities in many natural samples because of the extremely low biomass or because of difficulty in extracting sufficient quantities of high-quality nucleic acids for microarray analysis. Functional gene microarrays and DNA-based amplification protocols have been developed to detect microorganisms in environmental samples (41). Thus, approaches for amplifying prokaryotic RNAs, followed by microarray hybridization, are needed. As a confirmative step for analysis of real environmental samples, we examined whether representative amplification can be obtained using this approach with mixed mRNAs from four known species. Our results indicated that good representative detection can be obtained with mixed RNA templates.
Although some noticeable amplification biases were introduced by other bacterial RNAs, WCRA with mixed RNAs remained largely representative. Moreover, the effects in WCRA appeared to be species independent since the biases were consistent for profiles of all four bacteria in the mixture. Thus, WCRA is able to dissect the differences among genomes and should be applicable to environmental samples, although further tests with artificial communities having more complex structures may be needed.
A direct examination of the applicability of WCRA for the FBR samples revealed a significant difference between the number of genes identified in the amplified RNA and the number of genes in unamplified RNA. Fifteen genes were identified using WCRA, eight of which were also detected in the unamplified control sample, suggesting that WCRA provides higher detection sensitivity. The most likely reason for the increased sensitivity is the possible interference of residual contaminants with reverse transcription in the unamplified RNAs isolated from environmental samples. It is known that residual levels of contaminants can still be present in the nucleic acids purified from environmental samples by many commonly used purification methods. In this case, the residual level of contaminants, if they were present, would have been 50 times higher in the unamplified RNA samples than in the amplified samples because 50 times more original RNA was used. It is also likely that the mRNA levels of the additional seven genes in the unamplified sample were below the detection threshold and that amplification increased the levels to levels greater than the limit of detection.
A significant difference in the number of genes identified from an FW029 groundwater sample using unamplified genomic DNA (61 genes) (41) and amplified RNA (39 genes) was also observed. This difference was most likely due to the fact that many populations may not have been active and thus were not detected by mRNA-based microarray hybridization. Moreover, only a small proportion of these genes overlapped. The genes detected by RNA hybridization but not by DNA hybridization could have represented genes from minor populations (whose levels of DNA were below the detection limit of the FGA) that were detectable due to the highly upregulated levels of expression of the genes.
In summary, WCRA proved to be a reproducible and reliable method for amplification of prokaryotic RNA from pure cultures for differential gene expression. Use of this approach to detect the community activities in an ethanol-stimulated groundwater sample demonstrated that it is useful for analyzing functional activities of microbial communities. This is one of the first demonstrations that the microarray-based technology can be used to successfully detect the activities of microbial communities from real environmental samples in a high-throughput fashion. It is expected that such a technology should be particularly useful when microbial samples are limited. While further improvements in data comparison and analysis are needed, broad applications to environmental samples under different conditions to address ecological and environmental questions are critical to realize the full potential of this new approach for microbial ecology studies.
Acknowledgments
This research was supported by the United States Department of Energy under the Environmental Remediation Science Program, Genomics:GTL program, through the Virtual Institute of Microbial Stress and Survival (http://vimss.lbl.gov). Oak Ridge National Laboratory is managed by University of Tennessee UT-Battelle LLC for the Department of Energy under contract DE-AC05-00OR22725.
Footnotes
Published ahead of print on 10 November 2006.
REFERENCES
- 1.Adamczyk, J., M. Hesselsoe, N. Iversen, M. Horn, A. Lehner, P. H. Nielsen, M. Schloter, P. Roslev, and M. Wagner. 2003. The isotope array, a new tool that employs substrate-mediated labeling of rRNA for determination of microbial community structure and function. Appl. Environ. Microbiol. 69:6875-6887. [DOI] [PMC free article] [PubMed] [Google Scholar]
- 2.Baugh, L. R., A. A. Hill, E. L. Brown, and C. P. Hunter. 2001. Quantitative analysis of mRNA amplification by in vitro transcription. Nucleic Acids Res. 29:E29. [DOI] [PMC free article] [PubMed] [Google Scholar]
- 3.Bodrossy, L., N. Stralis-Pavese, M. Konrad-Koszler, A. Weilharter, T. G. Reichenauer, D. Schofer, and A. Sessitsch. 2006. mRNA-based parallel detection of active methanotroph populations by use of a diagnostic microarray. Appl. Environ. Microbiol. 72:1672-1676. [DOI] [PMC free article] [PubMed] [Google Scholar]
- 4.Bodrossy, L., N. Stralis-Pavese, J. C. Murrell, S. Radajewski, A. Weilharter, and A. Sessitsch. 2003. Development and validation of a diagnostic microbial microarray for methanotrophs. Environ. Microbiol. 5:566-582. [DOI] [PubMed] [Google Scholar]
- 5.Botero, L. M., S. D'Imperio, M. Burr, T. R. McDermott, M. Young, and D. J. Hassett. 2005. Poly(A) polymerase modification and reverse transcriptase PCR amplification of environmental RNA. Appl. Environ. Microbiol. 71:1267-1275. [DOI] [PMC free article] [PubMed] [Google Scholar]
- 6.Buchan, A., L. S. Collier, E. L. Neidle, and M. A. Moran. 2000. Key aromatic-ring-cleaving enzyme, protocatechuate 3,4-dioxygenase, in the ecologically important marine Roseobacter lineage. Appl. Environ. Microbiol. 66:4662-4672. [DOI] [PMC free article] [PubMed] [Google Scholar]
- 7.Chandler, D. P., G. J. Newton, J. A. Small, and D. S. Daly. 2003. Sequence versus structure for the direct detection of 16S rRNA on planar oligonucleotide microarrays. Appl. Environ. Microbiol. 69:2950-2958. [DOI] [PMC free article] [PubMed] [Google Scholar]
- 8.El Fantroussi, S., H. Urakawa, A. E. Bernhard, J. J. Kelly, P. A. Noble, H. Smidt, G. M. Yershov, and D. A. Stahl. 2003. Direct profiling of environmental microbial populations by thermal dissociation analysis of native rRNAs hybridized to oligonucleotide microarrays. Appl. Environ. Microbiol. 69:2377-2382. [DOI] [PMC free article] [PubMed] [Google Scholar]
- 9.Ensign, S., M. Hyman, and D. Arp. 1993. In vitro activation of ammonia monooxygenase from Nitrosomonas europaea by copper. J. Bacteriol. 175:1971-1980. [DOI] [PMC free article] [PubMed] [Google Scholar]
- 10.Eulberg, D., S. Lakner, L. A. Golovleva, and M. Schlomann. 1998. Characterization of a protocatechuate catabolic gene cluster from Rhodococcus opacus 1CP: evidence for a merged enzyme with 4-carboxymuconolactone-decarboxylating and 3-oxoadipate enol-lactone-hydrolyzing activity. J. Bacteriol. 180:1072-1081. [DOI] [PMC free article] [PubMed] [Google Scholar]
- 11.Feldman, A. L., N. G. Costouros, E. Wang, M. Qian, F. M. Marincola, H. R. Alexander, and S. K. Libutti. 2002. Advantages of mRNA amplification for microarray analysis. BioTechniques 33:906-912. [DOI] [PubMed] [Google Scholar]
- 12.Gao, H., Y. Wang, X. Liu, T. Yan, L. Wu, E. Alm, A. Arkin, D. K. Thompson, and J. Zhou. 2004. Global transcriptome analysis of the heat shock response of Shewanella oneidensis. J. Bacteriol. 186:7796-7803. [DOI] [PMC free article] [PubMed] [Google Scholar]
- 13.Hoheisel, J. D. 2006. Microarray technology: beyond transcript profiling and genotype analysis. Nat. Rev. Genet. 7:200-210. [DOI] [PubMed] [Google Scholar]
- 14.Hurt, R. A., X. Qiu, L. Wu, Y. Roh, A. V. Palumbo, J. M. Tiedje, and J. Zhou. 2001. Simultaneous recovery of RNA and DNA from soils and sediments. Appl. Environ. Microbiol. 67:4495-4503. [DOI] [PMC free article] [PubMed] [Google Scholar]
- 15.Hwang, C., W. Wu, T. J. Gentry, J. Carley, S. L. Carroll, C. Schadt, D. Watson, P. M. Jardine, J. Zhou, R. F. Hickey, C. S. Criddle, and M. W. Fields. 2006. Changes in bacterial community structure correlate with initial operating conditions of a field-scale denitrifying fluidized bed reactor. Appl. Microbiol. Biotechnol. 71:748-760. [DOI] [PubMed] [Google Scholar]
- 16.Iscove, N. N., M. Barbara, M. Gu, M. Gibson, C. Modi, and N. Winegarden. 2002. Representation is faithfully preserved in global cDNA amplified exponentially from sub-picogram quantities of mRNA. Nat. Biotechnol. 20:940-943. [DOI] [PubMed] [Google Scholar]
- 17.Istok, J. D., J. M. Senko, L. R. Krumholz, D. Watson, M. A. Bogle, A. Peacock, Y. J. Chang, and D. C. White. 2004. In situ bioreduction of technetium and uranium in a nitrate-contaminated aquifer. Environ. Sci. Technol. 38:468-475. [DOI] [PubMed] [Google Scholar]
- 18.Iwagami, S. G., K. Yang, and J. Davies. 2000. Characterization of the protocatechuic acid catabolic gene cluster from Streptomyces sp. strain 2065. Appl. Environ. Microbiol. 66:1499-1508. [DOI] [PMC free article] [PubMed] [Google Scholar]
- 19.Kawasaki, H., Y. Hoshino, and K. Yamasato. 1993. Phylogenetic diversity of phototrophic purple non-sulfur bacteria in the Proteobacteria α group. FEMS Microbiol. Lett. 112:61-66. [Google Scholar]
- 20.Li, L., J. Roden, B. E. Shapiro, B. J. Wold, S. Bhatia, S. J. Forman, and R. Bhatia. 2005. Reproducibility, fidelity, and discriminant validity of mRNA amplification for microarray analysis from primary hematopoietic cells. J. Mol. Diagn. 7:48-56. [DOI] [PMC free article] [PubMed] [Google Scholar]
- 21.Liu, Y., J. Zhou, M. V. Omelchenko, A. S. Beliaev, A. Venkateswaran, J. Stair, L. Wu, D. K. Thompson, D. Xu, I. B. Rogozin, E. K. Gaidamakova, M. Zhai, K. S. Makarova, E. V. Koonin, and M. J. Daly. 2003. Transcriptome dynamics of Deinococcus radiodurans recovering from ionizing radiation. Proc. Natl. Acad. Sci. USA 100:4191-4196. [DOI] [PMC free article] [PubMed] [Google Scholar]
- 22.Lockhart, D. J., and E. A. Winzeler. 2000. Genomics, gene expression and DNA arrays. Nature 405:827-836. [DOI] [PubMed] [Google Scholar]
- 23.Loy, A., K. Kusel, A. Lehner, H. L. Drake, and M. Wagner. 2004. Microarray and functional gene analyses of sulfate-reducing prokaryotes in low-sulfate, acidic fens reveal cooccurrence of recognized genera and novel lineages. Appl. Environ. Microbiol. 70:6998-7009. [DOI] [PMC free article] [PubMed] [Google Scholar]
- 24.Luo, L., R. C. Salunga, H. Q. Guo, A. Bittner, K. C. Joy, J. E. Galindo, H. N. Xiao, K. E. Rogers, J. S. Wan, M. R. Jackson, and M. G. Erlander. 1999. Gene expression profiles of laser-captured adjacent neuronal subtypes. Nat. Med. 5:117-122. [DOI] [PubMed] [Google Scholar]
- 25.Mahadevappa, M., and J. A. Warrington. 1999. A high-density probe array sample preparation method using 10- to 100-fold fewer cells. Nat. Biotechnol. 17:1134-1136. [DOI] [PubMed] [Google Scholar]
- 26.Moreno-Paz, M., and V. Parro. 2006. Amplification of low quantity bacterial RNA for microarray studies: time-course analysis of Leptospirillum ferrooxidans under nitrogen-fixing conditions. Environ. Microbiol. 53:729-737. [DOI] [PubMed] [Google Scholar]
- 27.Nygaard, V., and E. Hovig. 2006. Options available for profiling small samples: a review of sample amplification technology when combined with microarray profiling. Nucleic Acids Res. 34:996-1014. [DOI] [PMC free article] [PubMed] [Google Scholar]
- 28.Petalidis, L., S. Bhattacharyya, G. A. Morris, V. P. Collins, T. C. Freeman, and P. A. Lyons. 2003. Global amplification of mRNA by template-switching PCR: linearity and application to microarray analysis. Nucleic Acids Res. 31:e142. [DOI] [PMC free article] [PubMed] [Google Scholar]
- 29.Puskas, L. G., A. Zvara, L. Hackler, and P. Van Hummelen. 2002. RNA amplification results in reproducible microarray data with slight ratio bias. BioTechniques 32:1330-1334. [DOI] [PubMed] [Google Scholar]
- 30.Rhee, S.-K., X. Liu, L. Wu, S. C. Chong, X. Wan, and J. Zhou. 2004. Detection of genes involved in biodegradation and biotransformation in microbial communities by using 50-mer oligonucleotide microarrays. Appl. Environ. Microbiol. 70:4303-4317. [DOI] [PMC free article] [PubMed] [Google Scholar]
- 31.Suzuki, K., N. Ogawa, and K. Miyashita. 2001. Expression of 2-halobenzoate dioxygenase genes (cbdSABC) involved in the degradation of benzoate and 2-halobenzoate in Burkholderia sp. TH2. Gene 262:137-145. [DOI] [PubMed] [Google Scholar]
- 32.Taroncher-Oldenburg, G., E. M. Griner, C. A. Francis, and B. B. Ward. 2003. Oligonucleotide microarray for the study of functional gene diversity in the nitrogen cycle in the environment. Appl. Environ. Microbiol. 69:1159-1171. [DOI] [PMC free article] [PubMed] [Google Scholar]
- 33.Tiquia, S. M., L. Wu, S. C. Chong, S. Passovets, D. Xu, Y. Xu, and J. Zhou. 2004. Evaluation of 50-mer oligonucleotide arrays for detecting microbial populations in environmental samples. BioTechniques 36:664-675. [DOI] [PubMed] [Google Scholar]
- 34.Van Gelder, R., M. von Zastrow, A. Yool, W. Dement, J. Barchas, and J. Eberwine. 1990. Amplified RNA synthesized from limited quantities of heterogeneous cDNA. Proc. Natl. Acad. Sci. USA 87:1663-1667. [DOI] [PMC free article] [PubMed] [Google Scholar]
- 35.Verdick, D., S. Handran, and S. Pickett. 2002. Key considerations for accurate microarray scanning and image analysis, p 83-98. In G. Kamberova (ed.), DNA image analysis: nuts and bolts. DNA Press LLC, Salem, MA.
- 36.Wan, X. F., N. C. VerBerkmoes, L. A. McCue, D. Stanek, H. Connelly, L. J. Hauser, L. Wu, X. Liu, T. Yan, A. Leaphart, R. L. Hettich, J. Zhou, and D. K. Thompson. 2004. Transcriptomic and proteomic characterization of the Fur modulon in the metal-reducing bacterium Shewanella oneidensis. J. Bacteriol. 186:8385-8400. [DOI] [PMC free article] [PubMed] [Google Scholar]
- 37.Wang, E., L. D. Miller, G. A. Ohnmacht, E. T. Liu, and F. M. Marincola. 2000. High-fidelity mRNA amplification for gene profiling. Nat. Biotechnol. 18:457-459. [DOI] [PubMed] [Google Scholar]
- 38.Wang, E. 2005. RNA amplification for successful gene profiling analysis. J. Transl. Med. 3:28. [DOI] [PMC free article] [PubMed] [Google Scholar]
- 39.Wang, J., L. Hu, S. R. Hamilton, K. R. Coombes, and W. Zhang. 2003. RNA amplification strategies for cDNA microarray experiments. BioTechniques 34:394-400. [DOI] [PubMed] [Google Scholar]
- 40.Wei, X., T. Yan, N. G. Hommes, X. Liu, L. Wu, C. McAlvin, M. G. Klotz, L. A. Sayavedra-Soto, J. Zhou, and D. J. Arp. 2006. Transcript profiles of Nitrosomonas europaea during growth and upon deprivation of ammonia and carbonate. FEMS Microbiol. Lett. 257:76-83. [DOI] [PubMed] [Google Scholar]
- 41.Wu, L., X. Liu, C. W. Schadt, and J. Zhou. 2006. Microarray-based analysis of subnanogram quantities of microbial community DNAs using whole-community genome amplification. Appl. Environ. Microbiol. 72:4931-4941. [DOI] [PMC free article] [PubMed] [Google Scholar]
- 42.Wu, L., D. K. Thompson, X. Liu, M. W. Fields, C. E. Bagwell, J. M. Tiedje, and J. Zhou. 2004. Development and evaluation of microarray-based whole-genome hybridization for detection of microorganisms within the context of environmental applications. Environ. Sci. Technol. 38:6775-6782. [DOI] [PubMed] [Google Scholar]
- 43.Xiang, C. C., M. Chen, L. Ma, Q. N. Phan, J. M. Inman, O. A. Kozhich, and M. J. Brownstein. 2003. A new strategy to amplify degraded RNA from small tissue samples for microarray studies. Nucleic Acids Res. 31:e53. [DOI] [PMC free article] [PubMed] [Google Scholar]
- 44.Zaar, A., J. Gescher, W. Eisenreich, A. Bacher, and G. Fuchs. 2004. New enzymes involved in aerobic benzoate metabolism in Azoarcus evansii. Mol. Microbiol. 54:223-238. [DOI] [PubMed] [Google Scholar]
- 45.Zhao, H., T. Hastie, M. Whitfield, A. L. Borresen-Dale, and S. Jeffrey. 2002. Optimization and evaluation of T7 based RNA linear amplification protocols for cDNA microarray analysis. BMC Genomics 3:31. [DOI] [PMC free article] [PubMed] [Google Scholar]
- 46.Zhou, J., and D. K. Thompson. 2002. Challenges in applying microarrays to environmental studies. Curr. Opin. Biotechnol. 13:204-207. [DOI] [PubMed] [Google Scholar]
- 47.Zhou, J. 2003. Microarrays for bacterial detection and microbial community analysis. Curr. Opin. Microbiol. 6:288-294. [DOI] [PubMed] [Google Scholar]
- 48.Zhou, J., and D. K. Thompson. 2004. Microarray technology and applications in environmental microbiology. Adv. Agron. 82:183-270. [Google Scholar]