

Abstract
Treatment with a cocktail of CD4 and CD8-specific monoclonal antibodies (mAb) induces long-term transplantation tolerance and regulatory CD4+ T cells that induce tolerance in non-tolerant T cells. In contrast, treatment with a CD4-specific mAb alone fails to induce long-term tolerance. The current study was designed to test the hypothesis that CD8 blockade plays a role in promoting the development of CD4+ regulatory T cells.
Using the DO11.10 CD4+ TCR transgenic mouse model we show that treatment with a CD4/CD8-specific mAb cocktail induces antigen-specific tolerance to OVA, measured by a significant decrease in OVA-specific IgG, on challenge with antigen. Although treatment with OVA and the CD4-specific mAb alone also induces a significant decrease in OVA-specific antibody, the number of DO11.10 cells is significantly greater in mice treated with the CD4/CD8-specific mAb cocktail, and this is associated with a significant increase in proliferation of DO11.10 cells in response to specific antigen. DO11.10 cells sorted from mice made tolerant to OVA with the CD4/CD8-specific mAb cocktail promote an OVA-specific IgG1 (Th2-type) response but not an OVA-specific IgG3 (Th1-type) response on transfer into new syngeneic recipients, suggesting their ability to regulate the type of antigen-specific immune response that ensues after priming with antigen. In addition, DO11.10 cells from tolerant mice express markers that are characteristic of CD4+ regulatory cells, including FOXP3, GITR and CTLA4, but not CD25. Taken as a whole, these data suggest that CD8 blockade promotes CD4+ FOXP3+ regulatory CD4+ T cells by promoting their proliferation in tolerant mice.
Keywords: Monoclonal antibody, Regulatory T cells, CD8 blockade, Tolerance, TCR transgenic, Ovalbumin (OVA)
1. Introduction
The primary role of regulatory T cells is to inhibit undesirable self-reactive immune responses [1,2]. Regulatory T cells can be divided into subsets on the basis of their development (natural or acquired), cell surface phenotype, secreted proteins and function. Acquired Tregs express FOXP3 [3,4] and, like natural Tregs, are dependent on cell contact (acquired Tregs). They are anergic and secrete very little or no IL-2 [5]. The Tr1 regulatory cell subset, secretes IL-10 [6] but not IL-4 [7], they are independent of cell contact [8,9] but dependent on IL-10 for their regulatory function [7,10]. Unlike Tregs, Tr1 cells express very little or undetectable FOXP3 [11,12], although it can be induced [13].
CD4+ regulatory T cells can also express CD38, a high density of CD62L (CD62Lhigh) and a low density of CD45RB (CD45RBlow). Thus, CD38 [14], CD62Lhigh [15-19] and CD45RBlow [14,20,21] have all been shown to inhibit autoimmunity and cells that express CD45RBlow [22,23],CD38 [24] and CD25 (summarized in Ref. [25]), have also been shown by us [22] and by others [23-25] to inhibit transplantation rejection. However, all of these markers are also used to identify cell subsets that are not necessarily regulatory in function. Thus, activated CD4+ T cells express CD25 [26] and CD38 [27],naïve CD4+ T cells express a high density of CD62L [28,29] while memory CD4+ T cells express a low density of CD45RB [30-32]. Memory cells also express a high density of CD44 [28,29]. Therefore, although there is currently no cell surface phenotype that can distinguish a regulatory cell subset from a cell subset that does not have regulatory function, these markers have been used to characterize regulatory cells once their function has been established. The study and characterization of regulatory cells has been somewhat hampered by the difficulty in expanding these cells in vitro. The possibility that CD8 blockade might play a role in the development of CD4+ regulatory T cells might lead to a new approach for the expansion and isolation of regulatory cells in vivo.
Monoclonal antibody-induced antigen-specific transplantation tolerance and immune regulation can be induced by co-stimulation and accessory molecule blockade with mAbs to CD40L [33] or CD28 [34] or CD4 [35]. However, tolerance induced with these mAbs is limited. Long-term survival can be achieved in all of these systems by including a co-treatment that also targets CD8+ cells [36-39]. Such long-term survival involves immune regulation [36], and the presence of CD4+ T cells [36,38]. The authors of these studies have suggested that this is because effector CD8+ T cell function is less affected by CD40–CD40L, CD28-B7 and CD4 blockade than CD4+ T cell function [36-38,40]. In light of the data presented here we would like to suggest an additional explanation: blockade of CD8 promotes CD4+ T cell-mediated immune regulation by promoting proliferation of antigen-specific CD4+ regulatory T cells. These two explanations are not mutually exclusive. A beneficial effect of CD8+ cell depletion has also been described in non-rodent transplantation systems. Thus, in a dog renal allograft model, allograft survival is enhanced if CD4-specific mAb is used in conjunction with CD8+ cell depletion [41]. Moreover, a beneficial effect of CD8+ cell depletion in anti-rejection protocols in the clinic has also been reported. Thus, the incidence and severity of graft versus host disease (GVHD) is significantly reduced by depletion of donor CD8+ T cells [42,43] and CD8+ T cell-depletion is associated with an increase in CD4+ T cell recovery [42]. Here we test the hypothesis that CD8+ cell depletion is also associated with CD4+ regulatory T cell recovery.
In this study tolerance is induced with the well-characterized non-depleting CD4-specific monoclonal antibody (mAb) YTS 177, and the CD8-specific mAb, YTS 105. These mAbs have been shown to induce antigen-specific tolerance to skin [44,45], bone marrow [35] and cardiac allografts [46] by promoting CD4+ regulatory cells that are capable of preventing (suppres-sing) non-tolerant cells from rejecting the allograft [40,47]. The regulatory CD4+ T cells induced require the Th2-type cytokine, IL-4, to suppress transplantation rejection [48], suggesting the possibility that the regulatory cells are in fact Th2 cells [49-51]. Since the dominant cytokines present in an acutely rejecting allograft are the Th1-type cytokines, IFN-γ and IL-2 [52-54], and a critical role for IFN-γ [55] and IL-2 [56,57] in acute rejection has been clearly implicated, and since IL-4 can down regulate Th1-type responses [49-51],it is reasonable to hypothesize that IL-4-dependent regulatory CD4+ T cells induced with the YTS 177/YTS 105 cocktail, inhibit transplant rejection by down-regulating the transplant rejection Th1-type response.
We have used OVA as a model antigen system to determine whether CD8-specific mAb affects the development of CD4+ T cell-mediated immune regulation following treatment with CD4-specific mAb.
2. Materials and methods
2.1. Mice
Female BALB/cJ (BALB/c) and BALB/c DO11.10 TCR transgenic (DO11.10) mice were purchased from the Jackson Laboratory and used at eight to twelve weeks of age.
2.2. Transgenic mouse model system
The BALB/c DO11.10 mouse strain is transgenic for a T cell receptor (TCR) that recognizes a peptide derived from OVA [58]. The majority of CD4+ T cells in the resulting BALB/c DO11.10 TCR transgenic mouse carry the transgenic TCR and can be identified by FACS with the clonotypic mAb, KJ1-26 [59]. This tool allows us to determine the effect of antigen and the CD4-and CD8-specific mAbs on the proliferation, apoptosis, phenotype and function of the antigen-specific KJ1-26+ CD4+ T cell response. In order to study transgenic T cells within a more physiological environment with respect to the presence of non-transgenic T cells we have adopted the Jenkins method of transferring small numbers of splenocytes containing a defined number of transgenic CD4+ T cells from DO11.10 mice to BALB/c recipients [60,61]. Tolerance is induced in these mice by priming with antigen, OVA, in the presence of the tolerizing anti-CD4/anti-CD8 mAb cocktail, and antigen-specific tolerance defined as the lack of an antibody response to OVA, but not irrelevant antigen, β-galactosidase (β-gal), as a result of a previous encounter with OVA.
The presence of regulatory cells was determined by transferring highly purified DO11.10 cells from tolerant mice into a new cohort of BALB/c mice that were primed on the same day with OVA. In light of the fact that we have shown previously that regulatory cells generated using the anti-CD4/anti-CD8 mAb cocktail inhibit transplantation rejection using an IL-4-dependent mechanism [48], we have chosen to test the ability of the transferred tolerant DO11.10 cells to exert regulatory activity by determining their ability to alter the isotype of the antibody response to OVA. Thus, IL-4 promotes the isotype switch to IgG1 [62] and IgE [63,64], whereas IFN-γ promotes the isotype switch to IgG3 [65] and IgG2a [65,66]. TGF-β promotes the switch to IgA [67], and IL-10 promotes the switch to IgG1 and IgG3 [68]. Isotype switch indicates a maturation of the response and is associated with a decrease in secreted IgM, the isotype secreted early during the B cell response [69]. An effect by the transferred tolerant CD4+ T cells on the OVA-specific Ig isotype switch, compared to non-tolerant cells will indicate whether, and how, these cells regulate the response to antigen.
2.3. Antibodies
In vivo treatment
The CD4-specific hybridoma, YTS 177.9.6.1 [45], and the CD8-specific hybridoma, YTS 105.18.10 [45] were a generous gift from Herman Waldmann (Oxford, UK). The rat IgG2a isotype control HB-189 hybridoma was purchased from ATCC. 50 mg of each mAb per kg body weight was injected into mice on the same day as antigen treatment by intraperitoneal injection. Additional doses were administered on days 2, 4 and 7 post-antigen treatment.
In vitro
Biotinylated KJ1-26 mAb was purchased from Caltag Laboratories, Burlingame, CA. APC-labeled CD4 (RM4-5)-specific mAb, FITC-labeled CD44(IM7)-, CD45RB (IGA)-, CD62L(MEL-14)-, CD25(7D4)-, GITR(TNFRSF18)-specific mAbs and phycoerythrin (PE)-labeled CTLA4(UC10-4F10-11)-specific mAb were purchased from Becton Dickinson Biosciences Pharmingen, La Jolla, CA. FITC-labeled FOXP3(FJK-IGS)-specific mAb was purchased from eBioscience, San Diego, CA. PE-labeled and FITC-labeled streptavidin and isotype control mAbs were purchased from Becton Dickinson Biosciences Pharmingen, La Jolla, CA. All reagents were used as instructed.
2.4. Antigen preparation
The antigens, ovalbumin (OVA, Sigma Aldrich, St. Louis, MO) and β-gal (Sigma Aldrich, St. Louis, MO) were aggregated using a modification of a method described by Weigle [70]. Briefly, either OVA or β-gal were heated for 25 min at 63 °C at a concentration of 10 mg/ml. After heating the antigen was placed on ice overnight and stored at −20 °C.
2.5. The transgenic mouse model
Splenocytes were isolated from DO11.10 mice and an aliquot of 2 × 10⁵ cells were incubated with APC-labeled anti-CD4 and either biotinylated KJ1-26 mAb (mouse IgG2a specific for the transgenic TCR), or mouse IgG2a isotype control, followed by PE-labeled streptavidin. After washing, the percent transgenic CD4+ KJ1-26+ cells was determined by FACS. Using this information, BALB/c mice were injected with DO11.10 splenocytes containing 2.5 × 10⁶ transgenic CD4+ KJ1-26+ cells. For the remainder of this manuscript, DO11.10 cells will be termed CD4+ KJ1-26+ cells.
2.6. Antigen priming and boosting
On the same day as mice were injected with CD4+ KJ1-26+ cells the mice were injected intravenously with either 25 mg/kg aggregated OVA, or with 2.5 mg/kg aggregated β-gal. Mice were boosted at six weeks post-priming and then, in some experiments, again ten weeks post-priming, with the same dose of antigen as used for priming but boosting antigen was administered intraperitoneally. This protocol has been shown previously to induce immunity and not tolerance [71,72].
2.7. OVA- and β-gal-specific IgG measurements
Mice were bled from the tail vein at the times indicated for each experiment. Serum was isolated and stored at −20 °C. Sera were diluted at 1:100 in blocking buffer and serum OVA and β-gal-specific antibodies were measured by ELISA. Briefly, plates were coated with either 20 μg/ml OVA, or 20 μg/ml β-gal for 2 h at 37 °C. After blocking, sera were added, and the plates were incubated overnight at 4 °C. After washing, biotinylated goat anti-mouse IgG (Sigma Aldrich, St. Louis, MO) was added followed by extravidin peroxidase (Sigma Aldrich, St. Louis, MO). O-phenylenediamine dihydrochloride (OPD)/urea hydrogen peroxidase (UPO) detection reagents Sigma Aldrich, St. Louis, MO) were measured at 490 nm. Standard control anti-OVA and anti-β-gal antibody was made by priming and boosting mice at six and ten weeks post-priming, as described above. Mice were bled and serum isolated ten days after the last boost. For the purpose of these experiments, standard serum at 1:500 dilution contained 500 U/ml anti-OVA or anti-β-gal antibody.
2.8. OVA-specific Ig isotype testing
The standard ELISA described above was modified to measure OVA-specific Ig isotopes as follows: ELISA plates were coated with 20 μg/ml OVA (Sigma Aldrich, St. Louis, MO) for 2 h at 37 °C, followed by experimental serum samples overnight at 4 °C. After washing, isotype-specific antibody (rat anti-mouse IgG1, IgG2a, IgG2b, IgG3, IgM, IgA, and IgE, Becton Dickinson Biosciences Pharmingen, La Jolla, CA) was added, then biotinylated goat anti-rat IgG (Sigma Aldrich, St. Louis, MO), followed by extravidin peroxidase (Sigma Aldrich, St. Louis, MO), and finally o-phenylenediamine dihydrochloride (OPD)/urea hydrogen peroxidase (UPO) reagents Sigma Aldrich, St. Louis, MO) that were detected at 490 nm. The standard anti-OVA serum described above was used to generate the standard curves for each of the anti-OVA Ig isotypes.
2.9. Phenotype determination
Splenocytes were isolated and incubated with CD4-specific mAb and KJ1-26, followed by mAbs specific for either CD44, CD45RB, CD62L, CD25, GITR cell surface proteins, or CTLA4 and FOXP3 intracellular proteins, as indicated for each experiment. Isotype controls were included for each cell surface and intracellular stain. 2-5000 CD4+ KJ1-26+ cells were acquired using a FACSCalibur (Becton Dickinson, La Jolla, CA) and data analyzed using CELLQuest software version 3.2 (Becton Dickinson, La Jolla, CA). Samples were gated on the CD4+ KJ1-26+ cells to determine the expression of the third marker. Proliferation and apoptosis of CD4+ KJ1-26+ cells was determined using a FITC BrdU Flow Kit for proliferation (Becton Dickinson Biosciences Pharmingen, La Jolla, CA), and Annexin V-FITC Apoptosis Detection Kit for apoptosis (Becton Dickinson Biosciences Pharmingen, La Jolla, CA) after cell surface staining with CD4-specific mAb and KJ1-26.
2.10. Cell sorting and cell transfer
Splenocytes were isolated and incubated with APC-labeled CD4-specific mAb and biotinylated KJ1-26 followed by PE-streptavidin. CD4+ KJ1-26+ cells were purified by sorting using a FACSAria cell sorter (Becton Dickinson, La Jolla, CA). The purity of the sorted cells is determined using a FACSCalibur. The sorted cell population consistently contained greater than 99% CD4+ KJ1-26+ cells. The cells were washed once in PBS and 1 × 10⁵ sorted cells were immediately infused into donors by ip. injection.
2.11. Statistical analysis
The statistical significance of data shown was assessed using the Mann–Whitney test [73], and the Fisher's Exact test [74] as indicated for each experiment. All experiments that include an analysis of splenocytes were also performed on lymph node cells (pooled cervical, axillary, brachial, mesenteric, inguinal). Data is not shown for lymph node cells since the effect of the various treatments on lymph node cells was found to be the same as that shown for splenocytes.
3. Results
3.1. The anti-CD4/anti-CD8 mAb cocktail induces antigen-specific tolerance in the DO11.10 CD4+ TCR transgenic mouse model system
Mice were immunized with either OVA or β-gal. Half of the mice in each group were also treated with either the anti-CD4/anti-CD8 mAb cocktail or left without further treatment. After 21 days all mice were bled and OVA and β-gal specific antibody was measured in the serum. Mice treated with OVA alone made significantly more anti-OVA antibody than mice treated with OVA and anti-CD4/anti-CD8 mAb (Fig. 1a) but did not make anti-β-gal antibody (Fig. 1b), whereas mice treated with β-gal alone made significantly more β-gal-specific antibody (Fig. 1b) than mice treated with β-gal and anti-CD4/anti-CD8 mAb but not anti-OVA antibody (Fig. 1a). Tolerance can be measured at six weeks post-mAb injection since residual mAb is not detected by this time post-treatment [35,44]. Thus, six weeks after priming, half of the mice that were treated with OVA and the anti-CD4/anti-CD8 mAb cocktail and half of those treated with β-gal and the anti-CD4/anti-CD8 mAb cocktail were boosted with OVA while the other half were boosted with β-gal. Mice primed with OVA were boosted with OVA and those primed with β-gal were boosted with β-gal. The latter two groups served as positive controls for the OVA and β-gal-specific antibody responses. After a further ten days all mice were bled again and OVA- and β-gal-specific antibodies measured. As expected mice primed with OVA and boosted with OVA made significantly more anti-OVA antibody than mice primed with OVA in combination with the anti-CD4/anti-CD8 mAb cocktail and then boosted with OVA (Fig. 1c). Similarly, mice primed and boosted with β-gal made significantly more β-gal-specific antibody than mice primed with β-gal in combination with anti-CD4/anti-CD8 mAb and boosted with β-gal indicating that the mice were tolerant to β-gal (Fig. 1d). However, mice that were treated with OVA and the anti-CD4/anti-CD8 mAb cocktail but boosted with β-gal made anti-β-gal antibody to a level indistinguishable from mice made primed and boosted with β-gal (Fig. 1d), while mice treated with β-gal and the anti-CD4/anti-CD8 mAb cocktail but boosted with OVA made an equivalent level of OVA-specific antibody as mice primed and boosted with OVA (Fig. 1c). The data indicate that the anti-CD4/anti-CD8 mAb cocktail induces antigen-specific tolerance in the DO11.10 TCR transgenic mouse model.
Fig. 1.

The anti-CD4/anti-CD8 mAb cocktail induce antigen-specific tolerance in the DO11.10 CD4+ TCR transgenic mouse model. BALB/c mice were treated with 2.5 × 10⁶ CD4+ KJ1-26+ cells isolated from BALB/c DO11.10 mice. On the same day they were immunized with either OVA, or β-gal, or no antigen, in combination with either the anti-CD4/anti-CD8 mAb cocktail or with no mAb, as indicated in panels a through d. All mice were bled on day 21 and OVA-specific (panel a) and β-gal-specific (panel b) antibody was measured in the serum by ELISA. On day 42 post-antigen-treatment, mice were boosted with either OVA or β-gal as indicated in panels c and d. 10 days after boosting OVA (panel c) and β-gal (panel d) specific antibodies were measured again. Data shown is mean ± SD and represents 2 experiments. ** indicates statistical significance to 0.001-0.009 and *** indicates statistical significance between 0.0001 - 0.0009. The Mann-Whitney test was used to determine statistical significance. n = 3 per group.
3.2. Anti-CD4 mAb alone induces equivalent OVA unresponsiveness as the anti-CD4/anti-CD8 mAb cocktail
Mice were treated with OVA and either the anti-CD4/anti-CD8 mAb cocktail, or anti-CD4 mAb plus isotype control, or with OVA alone. Twenty-one days later mice were bled and OVA-specific antibody measured. Six weeks after priming, all mice were boosted with OVA. After a further 10 days mice were bled and OVA-specific antibody measured again. Pretreatment with OVA and anti-CD4 mAb plus isotype control inhibited the OVA-specific response to the same extent as pretreatment with OVA and the anti-CD4/anti-CD8 mAb cocktail both in the primary (Fig. 2a) and the secondary (Fig. 2b) response, indicating that anti-CD8 mAb is not required to inhibit the anti-OVA antibody response.
Fig. 2.
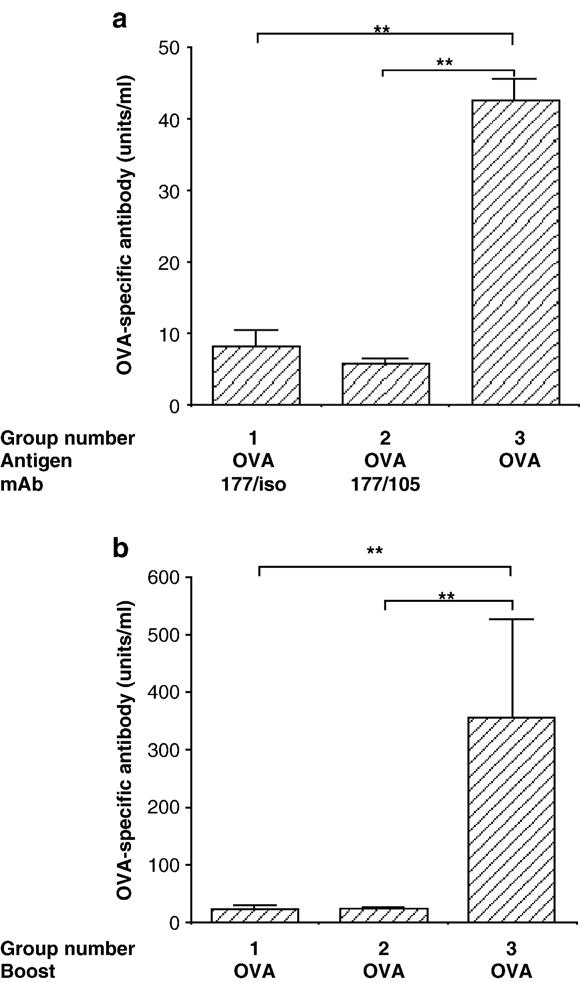
Anti-CD4 mAb alone induce equivalent OVA unresponsiveness as the anti-CD4/anti-CD8 mAb cocktail. BALB/c mice were treated with 2.5 × 10⁶ CD4+ KJ1-26+ cells isolated from BALB/c DO11.10 mice and either OVA and anti-CD4 plus rat IgG2a isotype control (Group 1), or OVA and the anti-CD4/anti-CD8 mAb cocktail (Group 2), or with OVA alone (Group 3). Twenty one days later all mice were bled and OVA-specific antibody measured (panel a). Six weeks after OVA and mAb treatment all mice were boosted with OVA and 10 days later OVA-specific antibody was measured in the serum by ELISA (panel b). Data shown are mean ± SEM and are representative of 3 experiments. ** indicates statistical significance to 0.001–0.009. The Mann–Whitney test was used to determine statistical significance. n = 6 per group.
3.3. Treatment with OVA and anti-CD4 mAb causes a significant loss of OVA-specific CD4+ transgenic T cells by six days post-mAb treatment whereas this loss is significantly reduced by co-treatment with the anti-CD8 mAb
Mice were treated with OVA and either the anti-CD4/anti-CD8 mAb cocktail, anti-CD4 mAb and isotype control, or no mAb. A fourth group remained untreated. Six days later all mice were sacrificed and number of CD4+ KJ1-26+ cells in the spleens determined by FACS. The total number of CD4+ KJ1-26+ cells was significantly less in the anti-CD4/isotype control treated group compared to all other groups (Fig. 3). The data suggest that anti-CD4 mAb promotes a loss of CD4+ KJ1-26+ cells in the spleens of OVA-treated mice, compared to mice treated with OVA alone, whereas the addition of anti-CD8 mAb in the treatment protocol, at least partially, inhibits that loss. The loss of CD4+ KJ1-26+ cells was not due to coating or modulation of cell surface CD4 since the sum of CD4+ and CD8+ T cells was equal to the sum of CD3+ cells in these mice (data not shown). In addition, in the experiment described here we have used the transgenic TCR-specific mAb KJ1-26 to detect the transgenic cells as well as CD4, and the TCR is not modulated by the anti-CD4 and anti-CD8 mAbs.
Fig. 3.

Treatment with OVA and anti-CD4 mAb causes a significant loss of OVA-specific CD4+ transgenic T cells by six days post-mAb treatment whereas this loss is significantly reduced by co-treatment with the anti-CD8 mAb. BALB/c mice were injected with 2.5 × 10⁶ CD4+ KJ1-26+ cells isolated from BALB/c DO11.10 mice and, on the same day, either left without further treatment or, treated with either OVA alone or, OVA and anti-CD4 mAb plus isotype control or, with OVA and anti-CD4/anti-CD8 mAb cocktail. On day 6 after OVA and mAb treatment splenocytes were isolated from all mice and the total number of CD4+ KJ1-26+ was determined for each mouse by FACS. Data shown are mean ± SEM for each group and are representative of 2 experiments. * indicates statistical significance to 0.01–0.05. *** indicates statistical significance to 0.0001–0.0009. The Student t test was used to determine statistical significance. n = 3 per group.
3.4. Anti-CD8 mAb promotes the proliferation of CD4+ KJ1-26+ cells
Possible explanations for the increase in CD4+ KJ1-26+ cells in the spleens of mice treated with the anti-CD4/anti-CD8 mAb cocktail compared to mice treated with anti-CD4 mAb alone include, protection from apoptosis, an increase in proliferation, and, export from the spleen to other lymphoid tissues (not addressed experimentally here). To determine whether the increase in CD4+ KJ1-26+ cell number corresponded to protection from apoptosis or an increase in proliferation BALB/c mice were injected with CD4+ KJ1-26+ cells in the usual way and on the same day they were treated with either OVA alone, OVA and the anti-CD4/anti-CD8 mAb cocktail, or OVA and anti-CD4 mAb plus isotype control. Half of the mice in each group were sacrificed on day three and the other half on day six after treatment and the total number of transgenic cells that had undergone proliferation or apoptosis was determined by FACS.
By day three post-treatment, all groups of mice that received OVA showed a significant increase in proliferation compared to the untreated group with the greatest proliferation seen in the OVA only treated group (Fig. 4a). Proliferation peaked before day six and by this time point significant proliferation was only seen in the OVA only treated group. These data indicate that the anti-CD4 mAb/isotype control cocktail and the anti-CD4/anti-CD8 mAb cocktail inhibit proliferation of antigen-specific cells. In addition, proliferation is significantly greater in CD4+ KJ1-26+ cells from mice treated with the anti-CD4/anti-CD8 mAb cocktail compared to cells from mice treated with the anti-CD4 mAb/isotype control cocktail in the first three days post-treatment suggesting that co-treatment with anti-CD8 promotes proliferation. This increase was not evident in the second three days (days 3–6) post-treatment. Protection from apoptosis in the groups that received the anti-CD4/anti-CD8 mAb cocktail was not detected (data not shown).
Fig. 4.

Anti-CD8 mAb promotes the proliferation of CD4+ KJ1-26+ cells. BALB/c mice were injected with 2.5 × 10⁶ CD4+ KJ1-26+ cells and, on the same day, treated with either OVA alone or, OVA and anti-CD4 mAb plus isotype control or, with OVA and the anti-CD4/anti-CD8 mAb cocktail. An additional group was left without further treatment. From day 0 through day 3 post-treatment, three mice from each group were fed BrdU in the drinking water. An additional three mice from each group were fed BrdU from day 3 through 6 post-treatment. After three days of BrdU treatment splenocytes were isolated from all mice and the total number of CD4+ KJ1-26+ cells that were BrdU+ (panel a) was determined for each mouse by FACS. Data shown are mean ± SEM for each group and are representative of 2 experiments. * indicates statistical significance to 0.01–0.05. *** indicates statistical significance to 0.0001–0.0009. The Student t test was used to determine statistical significance. n = 3 per group. Panels b through e show the FACS profiles of CD4+ KJ1-26+ cells from the groups that were primed with OVA alone for three days or left untreated. Panel b shows the dot plot of splenocytes labeled with anti-CD4 mAb plus KJ1-26. The CD4+ KJ1-26+ cells are those indicated in the upper right hand box. Panels c through e show histograms of CD4+ KJ1-26+ cells only from untreated (panel c) and treated (panels d and e) mice co-labeled for either the presence of BrdU (panels c and d), or isotype control for BrdU (panel e), and the percentage of CD4+ KJ1-26+ cells expressing BrdU determined by FACS. Data shown are mean ± SEM for each group and are representative of 2 experiments. n = 3 per group.
Fig. 4, panels b through e, shows the strategy used to analyze proliferation in transgenic CD4+ KJ1-26+ T cells. Fig. 4b shows a dot plot of splenocytes from primed mice stained for the presence of CD4 and KJ1-26. Panels c through e show histograms gated on CD4+ KJ1-26+ cells only. Proliferation of transgenic CD4+ Tcells is clearly evident in splenocytes from both treated (panel d) and untreated mice (panel c) compared to isotype control (panel e). However, proliferation is significantly greater in OVA-treated (panel d) splenocytes than it is in untreated (panel c) splenocytes (12.3±0.9% versus 77±3.1%).
On the whole the data suggest that CD4-specific mAb inhibits proliferation of TCR transgenic cells in response to OVA in a primary response, while co-treatment with CD8 blockade permits proliferation to a small, but significant, extent.
3.5. Anti-CD8 mAb treatment results in an increase in the number of CD4+ KJ1-26+ cells in tolerant mice
BALB/c mice were injected with CD4+ KJ1-26+ cells as usual in combination with either, OVA and the anti-CD4/anti-CD8 mAb cocktail, or OVA and the anti-CD4 mAb/isotype control cocktail, or with OVA alone. Six weeks post-priming half of the mice in each group were boosted with OVA and the remainder left without further treatment. Half of the boosted group and half of the non-boosted group were sacrificed three days later (Fig. 5a) and half were sacrificed six days later (Fig. 5b). Additional boosted mice that were treated with either, OVA and the anti-CD4/anti-CD8 mAb cocktail, or OVA and the anti-CD4 mAb/isotype control cocktail were boosted again ten weeks post-priming with either OVA or β-gal (Fig. 5c). The total number of CD4+ KJ1-26+ cells in the spleens of each group was determined by FACS. A significant increase in total number of CD4+ KJ1-26+ cells was seen in the group that received OVA and the anti-CD4/anti-CD8 mAb cocktail in response to boosting with OVA both three (Fig. 5a) and six (Fig. 5b) days after boosting. In contrast, no significant increase was seen in either of the other two groups in response to boosting with OVA. In addition, a significant increase was seen in the number of CD4+ KJ1-26+ cells in mice treated with OVA and the anti-CD4/anti-CD8 mAb cocktail in response to OVA boosting ten weeks post-priming compared to the mice from the same group challenged with irrelevant antigen, β-gal, or mice treated with OVA and the anti-CD4 mAb/isotype control cocktail and boosted with OVA (Fig. 5c). Moreover, the total number of CD4+ KJ1-26+ cells in the spleens of mice treated with OVA and the anti-CD4/anti-CD8 mAb cocktail and then boosted ten weeks after priming and analyzed three days after boosting, was in the order of four fold greater than the total number of CD4+ KJ1-26+ cells in the spleens of mice in the same treatment group boosted six weeks after priming and analyzed three days after boosting (Fig. 5 panels a versus c). The data suggest that CD4+ KJ1-26+ cells continue to expand in response to antigen over time.
Fig. 5.

Anti-CD8 mAb treatment promotes an increase in the number of CD4+ KJ1-26+ cells in tolerant mice. BALB/c mice were injected with 2.5 × 10⁶ CD4+ KJ1-26+ cells isolated from BALB/c DO11.10 mice and, on the same day, treated with either OVA alone or, OVA and anti-CD4 mAb plus isotype control or, with OVA and anti-CD4/anti-CD8 mAb cocktail. On day 42 after OVA and mAb treatment mice from each group were either boosted with OVA or left without a boost. Splenocytes were isolated from mice in each group at 3 (panel a) and 6 (panel b) days post-boost and the total number of CD4+ KJ1-26+ cells was determined for each mouse by FACS. Additional mice from the groups of mice that were treated with either OVA and the anti-CD4/anti-CD4 mAb plus isotype control and boosted on day 42 were boosted again on day 72 with either OVA or β-gal. After a further 3 days splenocytes were isolated from each group and the number of CD4+ KJ1-26+ cells determined. Data shown are mean±SEM for each group and are representative of 2 experiments. * indicates statistical significance to 0.01–0.05. ** indicates statistical significance to 0.001–0.009. The student t test was used to determined statistical significance. n = 3 per group.
3.6. Anti-CD8 mAb promotes susceptibility to proliferation in tolerant antigen-specific CD4+ T cells
The experiment described above in Fig. 5a and b was repeated but the mice were fed BrdU in the drinking water for three days after boosting and prior to sacrificing. Proliferation of CD4+ KJ1-26+ cells in the spleens of all mice was determined by FACS. CD4+ KJ1-26+ cells proliferated in response to boosting in all three groups (Fig. 6). However, proliferation of CD4+ KJ1-26+ cells after boosting was significantly greater in the splenocytes of mice treated with the anti-CD4/anti-CD8 mAb cocktail compared to splenocytes treated with either anti-CD4 mAb in the absence of anti-CD8 mAb, or without mAb. In addition, significant proliferation in response to boosting was still evident between days 3 and 6 in the groups treated with either, OVA and anti-CD4/anti-CD8 mAb, or OVA alone, but not in the group treated with OVA and the anti-CD4 mAb/isotype control cocktail. While the peak proliferation for the groups treated with anti-CD4/anti-CD8 mAb cocktail and the anti-CD4 mAb/isotype control was between days 0 and 3 post-boosting, for mice primed with OVA alone the peak proliferation was later, between days 3 and 6. The significantly greater number of CD4+ KJ1-26+ cells in OVA primed mice compared to either group that received mAb seen in the first six days post-priming was not maintained over time.
Fig. 6.

Anti-CD8 mAb promotes susceptibility to proliferation in tolerant antigen-specific CD4+ T cells. BALB/c mice were treated with either, OVA plus the anti-CD4/anti-CD8 mAb cocktail, or OVA and anti-CD4 mAb plus isotype control, or with OVA alone. On day 42 after OVA and mAb treatment mice from each group were boosted with or without OVA. Three mice from each of the boosted groups and three from each of the non-boosted groups were fed BrdU either on days 0–3, or on days 3–6. Mice that were fed BrdU on days 0–3 were sacrificed on day 3, while those that were fed BrdU on days 3–6 were sacrificed on day 6 post-boosting. The splenocytes were isolated and the total number of CD4+KJ1-26+cells that were BrdU+ were determined by FACS. Data generated from the non-boosted mice fed BrdU on days 0–3 and 3–6 has been pooled and is indicated in the figure as no boost (n = 6). Data shown in each case are mean ± SEM and are representative of 2 experiments. * indicates statistical significance to 0.01–0.05. ** indicates statistical significance to 0.001–0.009. *** indicates statistical significance to 0.0001–0.0009. The Student t test was used to determine statistical significance. n = 3 per group.
3.7. Spleens from tolerant (OVA plus anti-CD4/anti-CD8 mAb cocktail-treated) mice show a significant increase in CD4+ KJ1-26+ cells with a memory regulatory cell phenotype compared to spleens from untreated mice
To determine the phenotype of CD4+ KJ1-26+ cells from tolerant mice, splenocytes from tolerant mice and DO11.10 mice were labeled with KJ1-26 and CD4-specific antibody in addition to antibody specific for either CD44, or CD45RB, or CD62L, or CD25, or GITR, or CTLA4, or FOXP3. Thus, BALB/c mice were injected with CD4+ KJ1-26+ splenocytes, primed with OVA and treated with the anti-CD4/anti-CD8 mAb cocktail in the usual way. Six weeks post-priming all OVA and anti-CD4/anti-CD8 mAb treated mice were boosted with OVA. As shown in Fig. 5, the total number of CD4+ KJ1-26+ cells in spleens of mice given an additional antigen boost ten weeks post-priming is greater than in mice given a single boost six weeks post-priming. Therefore, in order to determine whether the phenotype of CD4+ KJ1-26+ cells is changed by antigen challenge given ten weeks post-priming, half of the tolerant mice were given an additional antigen boost ten weeks post-priming (second boost at ten weeks post-priming), while the remaining mice were left without the additional boost (single boost at six weeks post-priming). Three days later all mice were sacrificed and the expression of each marker on CD4+ cells from both tolerant groups was determined and compared to the phenotype of CD4+ KJ1-26+ cells from untreated DO11.10 mice. Fig. 7 shows the expression of each marker compared to isotype control on CD4+ KJ1-26+ cells from spleens of tolerant mice that received the additional OVA boost ten weeks post-priming. The data show that the majority of CD4+ KJ1-26+ cells from such tolerant mice express a high density of CD44, and a low density of both CD45RB and CD62L, suggesting a memory phenotype. In addition, the majority of cells do not express CD25, while they do express other regulatory-type markers including FOXP3, GITR and CTLA4.
Fig. 7.

CD4+ KJ1-26+ cells from tolerant mice have the phenotype of memory regulatory cells. On day 0 BALB/c mice were injected with 2.5 × 10⁶ CD4+ KJ1-26+ cells and, on the same day, treated with OVA and anti-CD4/anti-CD8 mAb. Mice were boosted six and ten weeks post-priming. Three days after the last boost mice were sacrificed and spleens were removed, labeled with CD4-specific mAb and KJ1-26 (panel a), and either, CD44-(panel b), CD45RB-(panel c), CD62L-(panel d), CD25-(panel e), GITR-(panel f), CTLA4-(panel g) and FOXP3-(panel h) specific mAb. Panel a is a representative dot plot of splenocytes labeled with CD4-specific mAb and KJ1-26. The top rectangle contains all CD4+ cells including the CD4+ KJ1-26+ cells (double positive). Samples shown in panels b–h are gated on total CD4+ cells (upper rectangle in panel a) and show the expression of each marker on CD4+ KJ1-26− (left of the vertical line) and CD4+ KJ1-26+ (right of the vertical line). The horizontal line marks the fluorescence intensity of the isotype control for each specific mAb.
CD44
The percentage of CD4+ KJ1-26+ cells that express a high density of CD44 is not significantly different between tolerant mice that received a single boost six weeks after priming compared to CD4+ KJ1-26+ cells in untreated DO11.10 mice (Fig. 8). However, the second boost stimulated a highly significant increase in the percentage of CD4+ KJ1-26+ cells that expressed a high density of CD44 compared to CD4+ KJ1-26+ cells from mice that received one antigen boost, suggesting that multiple boosts with antigen were required to promote a CD4+ KJ1-26+ memory cell population.
Fig. 8.
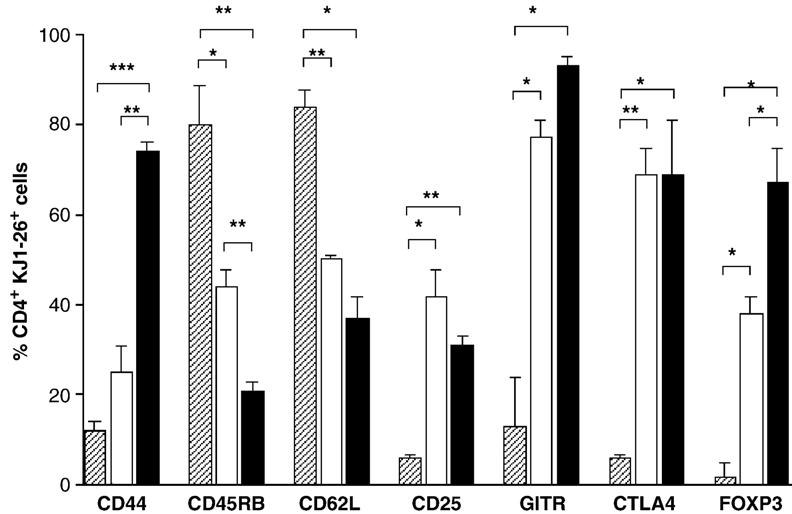
Antigen stimulation promotes an increase in the percentage of CD4+ KJ1-26+ cells that have a memory regulatory cell phenotype in tolerant mice. On day 0 BALB/c mice were injected with 2.5 × 10⁶ CD4+ KJ1-26+ cells and, on the same day, treated with OVA and the anti-CD4/anti-CD8 mAb cocktail. Mice were boosted six weeks after priming. Ten weeks post-priming, half of the mice were boosted again with OVA (closed bars, n=3) while the remaining mice were left without an additional boost (open bars, n=3). On day 75 mice were sacrificed and spleens were removed, labeled with CD4-specific mAb and KJ1-26, and either, CD44-, CD45RB-, CD62L-, CD25-, GITR-, CTLA4- and FOXP3-specific mAb. CD4+ KJ1-26+ splenocytes from untreated DO11.10 mice were also labeled with the same panel of mAbs (hatched bars, n=3). Data shows the mean ± SEM for the % CD4+ KJ1-26+ cells that express the indicated marker (panel a) and are representative of 4 experiments. * indicates statistical significance to 0.01–0.05. ** indicates statistical significance to 0.001–0.009. *** indicates statistical significance to 0.001–0.0009. The Student t test was used to determine statistical significance.
CD45RB and CD62L
The percentage of CD4+ KJ1-26+ cells that express CD45RB and CD62L was significantly decreased in tolerant mice that received a single boost with antigen compared to CD4+ KJ1-26+ cells from untreated DO11.10 mice. For CD45RB expression, but not CD62L expression, the second boost with antigen induced a further significant reduction in expression (Fig. 8), again suggesting that multiple boosts with antigen promote tolerant memory CD4+ KJ1-26+ cells.
CD25, GITR and CTLA4
The percentage of CD4+ KJ1-26+ cells that express either CD25, or GITR, or CTLA4 was significantly increased in tolerant mice that received a single antigen boost compared to CD4+ KJ1-26+ cells from untreated DO11.10 mice. However, the second antigen boost did not have an additional effect any of these cell surface markers (Fig. 8).
FOXP3
The percentage of CD4+ KJ1-26+ cells that express FOXP3 was significantly increased in the spleens of tolerant mice that received a single antigen boost compared to CD4+ KJ1-26+ cells from untreated DO11.10 mice. In addition, the second boost with antigen had a significant additional effect on increasing the percentage of CD4+ KJ1-26+ cells that expressed FOXP3 (Fig. 8), suggesting that the percentage of CD4+ KJ1-26+ that are regulatory cells is increased in response to antigen challenge.
3.8. CD4+ KJ1-26+T cells from tolerant mice can promote an OVA-specific IgG1, but not an OVA-specific IgG3 primary response, on transfer into new recipients
In order to determine whether the CD4+ KJ1-26+ cells in tolerant mice were capable of immune regulation they were purified by sorting from either untreated mice (non-tolerant DO11.10 cells), or from mice previously made tolerant to OVA with the anti-CD4/anti-CD8 mAb cocktail (tolerant transgenic CD4 cells). Untreated BALB/c mice were infused with either 1 × 10⁵ non-tolerant CD4+ KJ1-26+ cells (not tolerant) or with an equal number of tolerant transgenic CD4 cells (tolerant), or with no cells (untreated). On the same day all of the mice were primed with OVA. All mice were bled on day twenty one post-cell transfer and OVA-specific IgG, IgG1, IgG2a, IgG2b, IgG3, IgA, IgM, and IgE antibody in the serum measured by ELISA. The mice that received non-tolerant CD4+ KJ1-26+ cells made significantly more anti-OVA IgG antibody than the mice that received no cells (Fig. 9a). The mice that received the tolerant CD4+ KJ1-26+ cells also made more anti-OVA IgG than the group that did not receive a cell infusion, although this difference was not significant. The infused tolerant cells promoted a significant increase in OVA-specific IgG1 antibody compared to the mice that did not receive a cell infusion, consistent with an upregulation of IL-4 (Fig. 9b). In addition, tolerant CD4+ KJ1-26+ cells did not promote OVA-specific IgG3 compared to the mice that did not receive a cell infusion, whereas non-tolerant CD4+ KJ1-26+ cells did (Fig. 9c). Mice that received either tolerant or non-tolerant CD4+ KJ1-26+ cells made significantly less OVA-specific IgM than mice that received no cells (Fig. 9d). There was no significant difference between the group that received tolerant CD4+ KJ1-26+ cells and either of the other two groups in the levels of IgG2a, IgG2b, IgA and IgE (data not shown).
Fig. 9.
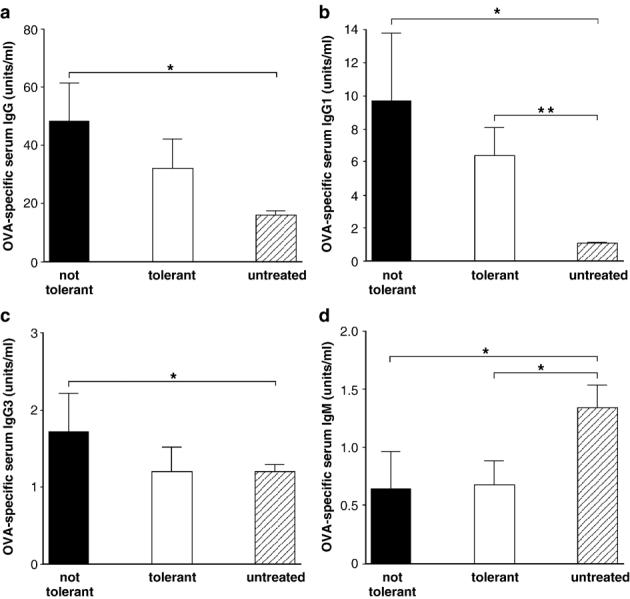
Recipients of tolerant CD4+KJ1-26+cells promote OVA-specific IgG1 but not IgG3. On day 0 BALB/c mice were injected with 2.5 × 10⁶ CD4+ KJ1-26+ cells and, on the same day, treated with OVA and the anti-CD4/anti-CD8 mAb cocktail. All mice were boosted six and ten weeks post-priming. Three days after the last boost mice were sacrificed and spleens were removed, labeled with CD4-specific mAb and KJ1-26 and sorted to obtain a highly purified CD4+ KJ1-26+ cell population (tolerant CD4+ KJ1-26+ cells). CD4+ KJ1-26+ T cells were also sorted from untreated age and sex matched DO11.10 mice on the same day (non-tolerant CD4+ KJ1-26+ cells). A new cohort of BALB/c mice were injected with either 1 × 10⁵ sorted tolerant CD4+ KJ1-26+ cells (n = 3) or, an equal number of non-tolerant CD4+ KJ1-26+ cells (n = 4). The level of OVA-specific IgG, IgG1, IgG2a, IgG2b, IgG3, IgM, IgA and IgE in the serum was measured in each mouse on day 21 post-cell transfer. Data shown is the mean±SEM OVA-specific antibody at each time point and is representative of 3 experiments. * indicates statistical significance to 0.01–0.05. ** indicates statistical significance to 0.001–0.009. The Student t test was used to determine statistical significance.
4. Discussion
An association between CD8 blockade and a more robust tolerance has been described previously in a number of transplant systems. However, the mechanism for the beneficial effect of CD8 blockade has not been resolved. It has been suggested that the improved survival of allografts in transplant recipients treated with either CD40L [33], or CD28 [34], or CD4 [35] in combination with a co-treatment that also targets CD8+ cells [36-39] is due to resistance of CD8+ effector T cells to CD40-CD40L, CD28-B7 blockade [36-38,40]. However, such long-term survival involves immune regulation [36], and the presence of CD4+ Tcells [36,38]. In addition, the incidence and severity of graft versus host disease (GVHD) is significantly reduced by depletion of donor CD8+ T cells [42,43] and CD8+ cell-depletion is associated with an increase in CD4+ cell recovery [42]. Based on these findings the study described here was set up to test the hypothesis that CD8 blockade promotes CD4+ T cell-mediated immune regulation by either inhibiting deletion and/or by promoting proliferation of antigen-specific CD4+ regulatory T cells.
Tolerance in this study is defined as the lack of a response to antigen as a result of previous encounter with that antigen. The effect of the CD4-specific mAb on OVA-specific tolerance induction was shown by the lack of OVA-specific antibody response in the serum of mice previously treated with OVA and the CD4-specific mAb, in combination with CD8-specific mAb. These data are consistent with previous studies in which the same anti-CD4 mAb, YTS 177, was shown to inhibit an antibody response to rat Ig [75]. In those studies the mechanism of tolerance induction was not shown. However, in transplantation tolerance studies, the induction of antigen-specific tolerance induced by the YTS 177 mAb in combination with the CD8-specific mAb, YTS 105, was clearly shown to involve CD4+ regulatory T cells [40,48].
The current study confirms and extends previous studies using the anti-CD4/anti-CD8 mAb cocktail to induce tolerance by including antigen-specific CD4+ TCR transgenic cells that can be identified using an anti-clonotypic mAb, KJ1-26. This transgenic tool allows us to determine the effect of treatment on survival, proliferation, apoptosis and phenotype of antigen-specific tolerant cells induced by the mAb cocktail. Using this model we show that antigen-specific proliferation of CD4+ KJ1-26+ cells in response to OVA is significant in the first week post-immunization, compared to proliferation in untreated mice. However, treatment with anti-CD4 mAb/isotype control at the same time as OVA immunization almost completely inhibited this proliferation, possibly by either blocking the interaction of CD4 accessory molecule with MHC Class II on the antigen presenting cell during the critical first interaction of the CD4+ KJ1-26+ cells with cognate antigen [76], or by providing a negative intracellular signal to the CD4+ KJ1-26+ cells resulting in refraction to proliferation [77,78]. Since we do not see evidence of coating or modulation of the CD4 molecule during this early time period, we believe that the latter is the more likely explanation. Anti-CD4 mAb-induced inhibition of CD4+ KJ1-26+ cell proliferation was partially prevented by co-treatment with anti-CD4/anti-CD8 mAb, although it is not clear whether the CD4+ KJ1-26+ cells that proliferate in this group have the same function and phenotype as the cells that proliferate in the OVA only treated group, or whether they represent a subset of CD4+ KJ1-26+ cells that are less/not sensitive to anti-CD4 mAb-induced inhibition.
The longer-term data shows that the CD4+ KJ1-26+ cells in mice treated with OVA and the anti-CD4/anti-CD8 mAb cocktail have different characteristics with respect to survival and proliferation than those in OVA only treated mice. Thus, the total number of CD4+ KJ1-26+ cells in the spleens (and lymph nodes, data not shown) of the OVA only treated group is significantly greater (5–6 fold greater) than CD4+ KJ1-26+ cells in the anti-CD4/anti-CD8 mAb treated group six days after treatment, whereas by six weeks post-treatment the number of CD4+ KJ1-26+ cells in the spleens (and lymph nodes, data not shown) between the two groups is not different, and by ten weeks post-treatment, CD4+ KJ1-26+ cells in the OVA only treated group are significantly fewer than in the anti-CD4/anti-CD8 treated group (data not shown). In addition, the number of CD4+ KJ1-26+ cells in the group treated with OVA and the anti-CD4 mAb alone was consistently lower than in the group that received co-treatment with the anti-CD8 mAb. These data suggest a survival advantage of the CD4+ KJ1-26+ cells in mice co-treated with the anti-CD8 mAb compared to mice immunized with either OVA alone, or with the anti-CD4 mAb in the absence of anti-CD8 mAb. In addition, the kinetics of proliferation, in response to challenge with OVA, between the groups at six weeks post-treatment is also different with CD4+ KJ1-26+ cells proliferating earlier and to a greater extent in the anti-CD4/anti-CD8 mAb treated group. These data confirm that the mechanism of tolerance induced by the anti-CD4/anti-CD8 mAb cocktail in this model does not involve deletion of antigen-reactive CD4+ cells, neither does it involve anergy, but rather that CD8 blockade is critical for the survival and proliferation of antigen-specific regulatory CD4+ T cells. It will be interesting to determine whether anti-CD8 mAb, in the absence of anti-CD4 mAb can also promote the survival and proliferation of antigen-specific primed cells in OVA treated mice, or whether this effect is restricted to regulatory CD4+ T cells.
The presence and proliferation of antigen-specific CD4+ cells in tolerant mice does not in itself indicate that the antigen-specific cells have regulatory function. However, the ability of CD4+ KJ1-26+ cells sorted from mice made tolerant to OVA with the anti-CD4/anti-CD8 mAb cocktail to deviate the OVA-specific Ig response towards OVA-specific IgG1 is consistent with the presence of IL-4 since IL-4 can promote the Ig switch to IgG1 [62]. In addition, the absence of IgG3 also suggests a role for IL-4 since IL-4 can inhibit the Ig switch to IgG3 [62,65]. These data are consistent with our previously published data that showed that CD4+ regulatory T cells induced by the anti-CD4/anti-CD8 mAb cocktail were able to inhibit transplantation rejection on transfer into new mice [48], and that this protective effect required the presence of IL-4 [48]. These data might suggest that the CD4+ KJ1-26+ cells that proliferate in response to antigen in tolerant mice include either Th2-type cells, or IL-4 secreting Tregs [79].
The cytokine IL-10 also induces the switch to IgG1 [68]. However, in contrast to IL-4, IL-10 also promotes the Ig switch to IgG3 [68]. The effect of CD4+ KJ1-26+ cells from tolerant mice on promoting IgG1 but not IgG3 suggests a Th2-type cell rather than a Tr1-type regulatory cell. However, cultured splenocytes from tolerant mice secrete IL-10 on stimulation with OVA (manuscript in preparation), and therefore, we cannot rule out the possibility that the lack of IgG3 in mice that received tolerant CD4+ KJ1-26+ cells might be due to competition between the positive effects of IL-10 secreted by Tr1 cells and the inhibitory effects of Th2-type IL-4. The lack of a switch to IgA suggests that Th3-type cells are not involved in this model [67].
The effect of the anti-CD4/anti-CD8 mAb cocktail is to dramatically inhibit the OVA-specific IgG response in the primary recipient. However, sorted CD4+ KJ1-26+ cells from tolerant mice do not significantly inhibit the OVA-specific IgG response, in fact, the trend is that they promote the OVA-specific IgG response. Moreover, IgM is significantly inhibited by both tolerant and non-tolerant CD4+ KJ1-26+ cells on transfer into secondary recipients indicating the ability of both cell subsets to promote the maturation of the Ig response. These data suggest that whereas the anti-CD4/anti-CD8 mAb cocktail induces antigen-specific tolerance, the CD4+ KJ1-26+ cells from tolerant mice do not themselves induce tolerance, but instead they induce deviation from one type of response to another. To explain why the CD4+ KJ1-26+ cells do not promote OVA-specific IgG1 within the primary recipient we suggest that either, the mAb treatment has an effect on the B cells that is not reversible and this results in the lack of an OVA-specific antibody response when the mice are challenged with antigen, or, that the environment in the secondary host is not conducive to allowing the regulatory cells to inhibit the anti-OVA antibody response, possibly due to the presence of CD8+ T cells, or, that additional regulatory cell subsets exist that actively inhibit the OVA-specific antibody response in the primary recipient. All of these possibilities can be tested experimentally.
Regulatory cell subsets are defined by their phenotype as well as their function. The majority of the CD4+ KJ1-26+ cells from tolerant mice that received multiple boosts with antigen are CD44high (greater than 70%), CD45RBlow (80%), CD62Llow (around 65%), suggesting that the majority of the tolerant CD4+ KJ1-26+ cells are memory cells. It is interesting to note that the percentage of CD4+ KJ1-26+ cells from tolerant mice that express CD44high, the memory cell marker, is not significantly greater than on CD4+ KJ1-26+ cells from non-tolerant mice unless the tolerant mice receive a second antigen boost. In addition, the down-regulation of CD45RB is also significantly increased after multiple antigen boosts. These data suggests that multiple boosts with antigen are required to generate memory regulatory CD4+ Tcells.
FOXP3 expression also continues to upregulate after re-stimulation with antigen, while others (GITR, CTLA4 and CD25) appear to be stably expressed after a single antigen boost. These data indicate a preferential expansion of regulatory CD4+ memory T cells that are defined on the basis of FOXP3 expression but not CD25, GITR and CTLA4, suggesting that the CD4+ KJ1-26+ cells that expand in response to antigen simulation in this study are not Tregs. However, we cannot rule out the possibility that the minority CD4+ KJ1-26+ cell population that do express CD25 are FOXP3+ Tregs. It will be important to determine whether the increase in frequency of FOXP3 cells after antigen boosting is due to a proliferation advantage of existing FOXP3 cells compared to non-FOXP3 expressing cells, or due to the induction of FOXP3 in cells that previously did not express FOXP3.
Although Tr1 cells express FOXP3 at only a low or undetectable level they can be induced to express high levels of FOXP3 [13] as is seen here in the augmentation of FOXP3 by antigen stimulation. Therefore, it remains a possibility that, at least a proportion of the tolerant CD4+ KJ1-26+ FOXP3+ cells are Tr1 regulatory cells. Th2 cells themselves do not normally express FOXP3 and therefore it is also possible that the CD4+ KJ1-26+ cells that do not express FOXP3 are Th2 cells. However, Th2 cells can be stimulated to express FOXP3 [80] and the expression of FOXP3 by Th2 cells is associated diminished pathogenic activity [80]. In addition, IL-4 can promote FOXP3 expression in naïve CD4+ cells suggesting a possible interplay between Th2 cells and regulatory cells [81]. If we assume that the current literature describes all regulatory cell subsets we might conclude that the tolerant CD4+ KJ1-26+ regulatory cell population contains a mixture of cell subsets including Tr1 cells, Tregs, and Th2 cells that do or do not express FOXP3. However, we cannot rule out the possibility that the CD4+ KJ1-26+ cells from tolerant mice are comprised of CD4+ regulatory T cells with a novel spectrum of characteristics.
The ability of CD8+ T cells to inhibit the expansion of CD4+ T cells is well documented. Thus, CD8+ T cells inhibit both proliferation and cytokine secretion of primary CD4+ T cells [82,83] as well as Th2-type cells [84]. Therefore, a role for CD8 blockade in promoting expansion of tolerant regulatory cells, including Th2-type cells, by blocking CD8+ T cell function is plausible. In addition, a growing body of literature now shows that a reduction in total T cell number, either by the use of protocols that result in T cell depletion [85], or by the transfer of small numbers of T cells into immunodeficient hosts [86], or by genetically-induced lymphopenia [87], results in proliferation of both CD4+ and CD8+ T cells (T cell homeostatic proliferation). Although such homeostatic proliferation has not yet been described for regulatory CD4+ T cells, it is possible that depletion of CD8+ T cells by the CD8-specific mAb used in this model (data not shown) simply provides space into which regulatory, and other CD4+ T cells can expand.
The CD8-specific mAb, YTS 105, used in these studies is specific for the α chain of CD8 [45] that is expressed on CD8α+ dendritic cells [88] as well as CD8+ T cells. A role for CD8α+ DC in limiting T cell responsiveness is also well documented. Examples include failure to support proliferation of T cells [89], inhibition of alloreactive T cell expansion resulting in prolonged cardiac allograft survival [90], and, although not relevant here, the induction of T cell apoptosis [91] including apoptosis of self-reactive T cells [92]. However, CD8α+ DC also play a role in inducing primary Th1-type rather than Th2-type responses [93,94]. These findings suggests the possibility that anti-CD8 mAb might promote CD4+ regulatory T cell expansion, including Th2-type cells, by blocking CD8α+ DC function and thus removing CD8α+ DC-mediated suppression of T cell responses.
These data show that CD8 blockade with anti-CD8 mAb promotes the survival and proliferation of reguatory CD4+ T cells. The regulatory cell population is memory in phenotype and expresses FOXP3, GITR and CTLA4. Consistent with previously published data, the function of the regulatory cells in vivo is associated with a dominant Th2-type response. The model described provides a protocol that can be used to generate and expand antigen-specific regulatory CD4+ T cells for further study.
Acknowledgement
Funding for this study was provided by grants from the Diabetes National Research Group (DNRG0603), the Alzheimer and Ageing Research Center (AARC5104), and the NIH (DK61334) to Joanna Davies.
References
- 1.Modigliani Y, Thomas-Vaslin V, Bandeira A, Coltey M, Le Douarin NM, Coutinho A, et al. Lymphocytes selected in allogeneic thymic epithelium mediate dominant tolerance toward tissue grafts of the thymic epithelium haplotype. Proc Natl Acad Sci U S A. 1995;92:7555–9. doi: 10.1073/pnas.92.16.7555. [DOI] [PMC free article] [PubMed] [Google Scholar]
- 2.Modigliani Y, Coutinho A, Pereira P, Le Douarin N, Thomas-Vaslin V, Burlen-Defranoux O, et al. Establishment of tissue-specific tolerance is driven by regulatory T cells selected by thymic epithelium. Eur J Immunol. 1996;26:1807–15. doi: 10.1002/eji.1830260822. [DOI] [PubMed] [Google Scholar]
- 3.Apostolou I, von Boehmer H. In vivo instruction of suppressor commitment in naïve T cells. J Exp Med. 2004;199:1401–8. doi: 10.1084/jem.20040249. [DOI] [PMC free article] [PubMed] [Google Scholar]
- 4.Mucida D, Kutchukhidze N, Erazo A, Russo M, Lafaille JJ, Curotto de Lafaille MA. Oral tolerance in the absence of naturally occurring Tregs. J Clin Invest. 2005;115:1923–33. doi: 10.1172/JCI24487. [DOI] [PMC free article] [PubMed] [Google Scholar]
- 5.Shevach EM. CD4+CD25+ suppressor T cells: more questions than answers. Nat Rev Immunol. 2002;2:389–400. doi: 10.1038/nri821. [DOI] [PubMed] [Google Scholar]
- 6.O'Garra A, Vieira PL, Veira P, Goldfeld AE. IL-10-producing and naturally occurring CD4+ tregs: limiting collateral damage. J Clin Invest. 2004;114:1372–8. doi: 10.1172/JCI23215. [DOI] [PMC free article] [PubMed] [Google Scholar]
- 7.Groux H, O'Garra A, Bigler M, Rouleau M, Antonenko S, de Vries JE, et al. A CD4+ T-cell subset inhibits antigen-specific T-cell responses and prevents colitis. Nature. 1997;389:737–42. doi: 10.1038/39614. [DOI] [PubMed] [Google Scholar]
- 8.Levings MK, Roncarolo MG. Phenotypic and functional differences between human CD4+ CD25+ and type I regulatory T cells. Curr Top Microbiol Immunol. 2005;293:303–26. doi: 10.1007/3-540-27702-1_14. [DOI] [PubMed] [Google Scholar]
- 9.Roncarolo MG, Bacchetta R, Bordignon C, Narula S, Levings MK. Type 1 T regulatory cells. Immunol Rev. 2001;182:68–79. doi: 10.1034/j.1600-065x.2001.1820105.x. [DOI] [PubMed] [Google Scholar]
- 10.Levings MK, Sangregorio R, Galbiati F, Squadrone S, de Waal Malefyt R, Roncarolo MG. IFN-alpha and IL-10 induce the differentiation of human type1 T regulatory cells. J Immunol. 2001;166:5530–9. doi: 10.4049/jimmunol.166.9.5530. [DOI] [PubMed] [Google Scholar]
- 11.Vieira PL, Christensen JR, Minaee S, O'Neill EJ, Barrat FJ, Boonstra A, et al. IL-10-secreting regulatory T cells do not express FOXP3 but have comparable regulatory function to naturally occurring CD4+CD25+ regulatory T cells. J Immunol. 2004;172:5986–93. doi: 10.4049/jimmunol.172.10.5986. [DOI] [PubMed] [Google Scholar]
- 12.Levings MK, Gregori S, Tresoldi E, Cazzaniga S, Bonini C, Roncarolo MG. Differentiation of Tr1 cells by immature dendritic cells requires IL-10 but not CD25+CD4+ Tr cells. Blood. 2005;105:1162–9. doi: 10.1182/blood-2004-03-1211. [DOI] [PubMed] [Google Scholar]
- 13.Karagiannidis C, Akdis M, Holopainen P, Woolley NJ, Hense G, Ruckert B, et al. Glucocorticoids upregulate FOXP3 expression and regulatory T cells in asthma. J Allergy Clin Immunol. 2004;114:1425–33. doi: 10.1016/j.jaci.2004.07.014. [DOI] [PubMed] [Google Scholar]
- 14.Martins TC, Aguas AP. A role for CD45RBlow CD38+ T cells and costimulatory pathways of T-cell activation in protection of non-obese diabetic (NOD) mice from diabetes. Immunology. 1999;96:600–5. doi: 10.1046/j.1365-2567.1999.00725.x. [DOI] [PMC free article] [PubMed] [Google Scholar]
- 15.Bach JF, Chatenoud L. Tolerance to islet autoantigens in type 1 diabetes. Annu Rev Immunol. 2001;19:131–61. doi: 10.1146/annurev.immunol.19.1.131. [DOI] [PubMed] [Google Scholar]
- 16.Lepault F, Gagnerault MC. Characterization of peripheral regulatory CD4+ T cells that prevent diabetes onset in nonobese diabetic mice. J Immunol. 2000;164:240–7. doi: 10.4049/jimmunol.164.1.240. [DOI] [PubMed] [Google Scholar]
- 17.Shimuzu J, Yamazaki S, Takahashi T, Ishida Y, Sakaguchi S. Stimulation of CD25(+)CD4(+) regulatory T cells through GITR breaks immunological self-tolerance. Nat Immunol. 2002;3:135–42. doi: 10.1038/ni759. [DOI] [PubMed] [Google Scholar]
- 18.Takahashi T, Tagami T, Yamazaki S, Uede T, Shimizu J, Sakaguchi N, et al. Immunologic self tolerance maintained by CD25(+)CD4(+) regulatory T cells constitutively expressing cytotoxic T lymphocyte-associated antigen 4. J Exp Med. 2000;192:303–10. doi: 10.1084/jem.192.2.303. [DOI] [PMC free article] [PubMed] [Google Scholar]
- 19.Read S, Malstrom V, Powrie F. Cytotoxic T lymphocyte-associated antigen 4 plays an essential role in the function of CD25(+)CD4(+) regulatory T cells that control intestinal inflammation. J Exp Med. 2000;192:295–302. doi: 10.1084/jem.192.2.295. [DOI] [PMC free article] [PubMed] [Google Scholar]
- 20.Powrie F, Leach MW, Mauze S, Caddle LB, Coffman RL. Phenotypically distinct subsets of CD4+ T cells induce or protect from chronic intestinal inflammation in C.B-17 scid mice. Int Immunol. 1993;5:1461–71. doi: 10.1093/intimm/5.11.1461. [DOI] [PubMed] [Google Scholar]
- 21.Morrissey PJ, Charrier K, Braddy S, Liggitt D, Watson JD. CD4+ T cells that express high levels of CD45RB induce wasting disease when transferred into congenic severe combined immunodeficient mice. Disease development is prevented by cotransfer of purified CD4+ Tcells. J Exp Med. 1993;178:237–44. doi: 10.1084/jem.178.1.237. [DOI] [PMC free article] [PubMed] [Google Scholar]
- 22.Davies JD, O'Connor E, Hall D, Krahl T, Trotter J, Sarvetnick N, et al. CD4+ CD45RB low-density cells from untreated mice prevent acute allograft rejection. J Immunol. 1999;163:5353–7. [PubMed] [Google Scholar]
- 23.Hara M, Kingsley CI, Niimi M, Read S, Turvey SE, Bushell AR, et al. IL-10 is required for regulatory T cells to mediate tolerance to alloantigens in vivo. J Immunol. 2001;166:3789–96. doi: 10.4049/jimmunol.166.6.3789. [DOI] [PubMed] [Google Scholar]
- 24.Mathew JM, Fuller L, Carreno M, Garcia-Morales R, Burke GW, III, Ricordi C, et al. Involvement of multiple subpopulations of human bone marrow cells in the regulation of allogeneic cellular immune responses. Transplantation. 2000;70:1752–60. doi: 10.1097/00007890-200012270-00015. [DOI] [PubMed] [Google Scholar]
- 25.Jiang S, Herrera O, Lechler RI. New spectrum of allorecognition pathways: implications for graft rejection and transplantation tolerance. Curr Opin Immunol. 2004;16:550–7. doi: 10.1016/j.coi.2004.07.011. [DOI] [PubMed] [Google Scholar]
- 26.Waldmann TA. The multi-subunit interleukin-2 receptor. Annu Rev Biochem. 1989;58:875–911. doi: 10.1146/annurev.bi.58.070189.004303. [DOI] [PubMed] [Google Scholar]
- 27.Jackson DG, Bell JI. Isolation of a cDNA encoding the human CD38 (T10) molecule, a cell surface glycoprotein with an unusual discontinuous pattern of expression during lymphocyte differentiation. J Immunol. 1990;144:2811–5. [PubMed] [Google Scholar]
- 28.Budd RC, Cerottini JC, Horvath C, Bron C, Pedrazzini T, Howe RC, et al. Distinction of virgin and memory T lymphocytes: stable acquisition of the Pgp-1 glycoprotein concomitant with antigenic stimulation. J Immunol. 1987;138:3120–9. [PubMed] [Google Scholar]
- 29.Swain SL. Generation and in vivo persistence of polarized Th1 and Th2 memory cells. Immunity. 1994;1:543–52. doi: 10.1016/1074-7613(94)90044-2. [DOI] [PubMed] [Google Scholar]
- 30.Birkeland ML, Johnson P, Trowbridge IS, Pure E. Changes in CD45 isoform expression accompany antigen-induced murine T-cell activation. Proc Natl Acad Sci U S A. 1989;86:6734–8. doi: 10.1073/pnas.86.17.6734. [DOI] [PMC free article] [PubMed] [Google Scholar]
- 31.Bottomly K, Luqman M, Greenbaum L, Carding S, West J, Pasqualini T, et al. A monoclonal antibody to murine CD45R distinguishes CD4 T cell populations that produce different cytokines. Eur J Immunol. 1989;19:617–23. doi: 10.1002/eji.1830190407. [DOI] [PubMed] [Google Scholar]
- 32.Lee WT, Yin XM, Vitetta ES. Functional and ontogenic analysis of murine CD45Rhi and CD45Rlo CD4+ T cells. J Immunol. 1990;144:3288–95. [PubMed] [Google Scholar]
- 33.Foy TF, Aruffo A, Bajorath J, Buhlmann JE, Noelle RJ. Immune regulation by CD40 and its ligand GP39. Annu Rev Immunol. 1996;14:591–617. doi: 10.1146/annurev.immunol.14.1.591. [DOI] [PubMed] [Google Scholar]
- 34.Lenschow DJ, Walunas TL, Bluestone JA. The CD28/B7 system of T-cell costimulation. Annu Rev Immunol. 1996;14:233–58. doi: 10.1146/annurev.immunol.14.1.233. [DOI] [PubMed] [Google Scholar]
- 35.Qin SX, Cobbold S, Benjamin R, Waldmann H. Induction of classical transplantation tolerance in the adult. J Exp Med. 1989;169:779–94. doi: 10.1084/jem.169.3.779. [DOI] [PMC free article] [PubMed] [Google Scholar]
- 36.Honey K, Cobbold SP, Waldmann H. CD40 ligand blockade induces CD4+ T cell tolerance and linked suppression. J Immunol. 1999;163:4805–10. [PubMed] [Google Scholar]
- 37.Ensminger SM, Witzke O, Spriewald BM, Morrison K, Morris PJ, Rose ML, et al. CD8+ T cells contribute to the development of transplant arteriosclerosis despite CD154 blockade. Transplantation. 2000;69:2609–12. doi: 10.1097/00007890-200006270-00022. [DOI] [PubMed] [Google Scholar]
- 38.Rossini AA, Mordes JP, Greiner DL, Stoff JS. Islet cell transplantation tolerance. Transplantation. 2001;72:43–6. [PubMed] [Google Scholar]
- 39.Newell KA, He G, Guo Z, Kim O, Szot GL, Rulifson I, et al. Blockade of the CD28/B7 costimulatory pathway inhibits intestinal allograft rejection mediated by CD4+ but not CD8+ T cells. J Immunol. 1999;163:2358–62. [PubMed] [Google Scholar]
- 40.Qin S, Cobbold SP, Pope H, Elliott J, Kioussis D, Davies JD, et al. “Infectious” transplantation tolerance. Science. 1993;259:974–7. doi: 10.1126/science.8094901. [DOI] [PubMed] [Google Scholar]
- 41.Watson CJ, Cobbold SP, Davies HS, Rebello PR, Waldmann H, Calne RY, et al. CD4 and CD8 monoclonal antibody therapy: strategies to prolong renal allograft survival in the dog. Br J Surg. 1993;80:1389–92. doi: 10.1002/bjs.1800801111. [DOI] [PubMed] [Google Scholar]
- 42.Baron F, Baudoux E, Frere P, Tourqui S, Schaaf-Lafontaine N, Greimers R, et al. Nonmyeloablative stem cell transplantation with CD8-depleted or CD34-selected peripheral blood stem cells. J Hematother Stem Cell Res. 2002;11:301–14. doi: 10.1089/152581602753658484. [DOI] [PubMed] [Google Scholar]
- 43.Soiffer RJ, Alyea EP, Hochberg E, Wu C, Canning C, Parikh B, et al. Randomized trial of CD8+ T-cell depletion in the prevention of graft-versus-host disease associated with donor lymphocytein-fusion. Biol Blood Marrow Transplant. 2002;8:625–32. doi: 10.1053/bbmt.2002.v8.abbmt080625. [DOI] [PubMed] [Google Scholar]
- 44.Cobbold SP, Martin G, Waldmann H. The induction of skin graft tolerance in major histocompatibility complex-mismatched or primed recipients: primed T cells can be tolerized in the periphery with anti-CD4 and anti-CD8 antibodies. Eur J Immunol. 1990;20:2747–55. doi: 10.1002/eji.1830201232. [DOI] [PubMed] [Google Scholar]
- 45.Qin SX, Wise M, Cobbold SP, Leong L, Kong YC, Parnes JR, Waldmann H. Induction of tolerance in peripheral T cells with monoclonal antibodies. Eur J Immunol. 1990;20:2737–45. doi: 10.1002/eji.1830201231. [DOI] [PubMed] [Google Scholar]
- 46.Chen Z, Cobbold S, Metcalfe S, Waldman H. Tolerance in the mouse to major histocompatibility complex-mismatched heart allografts, and to rat heart xenografts, using monoclonal antibodies to CD4 and CD8. Eur J Immunol. 1992;22:805–10. doi: 10.1002/eji.1830220326. [DOI] [PubMed] [Google Scholar]
- 47.Davies JD, Leong LY, Mellor A, Cobbold SP, Waldmann H. T cell suppression in transplantation tolerance through linked recognition. J Immunol. 1996;156:3602–7. [PubMed] [Google Scholar]
- 48.Davies JD, Martin G, Phillips J, Marshall SE, Cobbold SP, Waldmann H. T cell regulation in adult transplantation tolerance. J Immunol. 1996;157:529–33. [PubMed] [Google Scholar]
- 49.Sher A, Coffman RL. Regulation of immunity to parasites by T cells and T cell-derived cytokines. Annu Rev Immunol. 1992;10:385–409. doi: 10.1146/annurev.iy.10.040192.002125. [DOI] [PubMed] [Google Scholar]
- 50.Abbas AK, Murphy KM, Sher A. Functional diversity of helper T lymphocytes. Nature. 1996;383:787–93. doi: 10.1038/383787a0. [DOI] [PubMed] [Google Scholar]
- 51.Romagnani S. Human Th1 and Th2 subsets: doubt no more. Immunol Today. 1991;12:256–7. doi: 10.1016/0167-5699(91)90120-I. [DOI] [PubMed] [Google Scholar]
- 52.O'Connell PJ, Pacheco-Silva A, Nickerson PW, Muggia RA, Bastos M, Kelley VR, et al. Unmodified pancreatic islet allograft rejection results in the preferential expression of certain T cell activation transcripts. J Immunol. 1993;150:1093–104. [PubMed] [Google Scholar]
- 53.Dallman MJ, Larsen CP, Morris PJ. Cytokine gene transcription in vascularised organ grafts: analysis using semiquantitative polymerase chain reaction. J Exp Med. 1991;174:493–6. doi: 10.1084/jem.174.2.493. [DOI] [PMC free article] [PubMed] [Google Scholar]
- 54.Nickerson P, Steurer W, Steiger J, Zheng X, Steele AW, Strom TB, et al. Cytokines and the Th1/Th2 paradigm in transplantation. Curr Opin Immunol. 1994;6:757–64. doi: 10.1016/0952-7915(94)90081-7. [DOI] [PubMed] [Google Scholar]
- 55.Bugeon L, Cuturi MC, Hallet MM, Paineau J, Chabannes D, Soulillou JP. Peripheral tolerance of an allograft in adult rats-characterization by low interleukin-2 and interferon-gamma mRNA levels and by strong accumulation of major histocompatibility complex transcripts in the graft. Transplantation. 1992;54:219–25. doi: 10.1097/00007890-199208000-00006. [DOI] [PubMed] [Google Scholar]
- 56.Tellides G, Dallman MJ, Morris PJ. Mechanism of action of interleukin-2 receptor (IL-2R) monoclonal antibody (Mab) therapy: target cell depletion or inhibition of function? Transplant Proc. 1989;21:997–8. [PubMed] [Google Scholar]
- 57.Kupiec-Weglinski JW, Diamantstein T, Tilney NL. Interleukin 2 receptor-targeted therapy-rationale and application in organ transplantation. Transplantation. 1988;46:785–92. doi: 10.1097/00007890-198812000-00001. [DOI] [PubMed] [Google Scholar]
- 58.Murphy KM, Heimberger AB, Loh DY. Induction by antigen of intrathymic apoptosis of CD4+ CD8+ TCRlo thymocytes in vivo. Science. 1990;250:1720–3. doi: 10.1126/science.2125367. [DOI] [PubMed] [Google Scholar]
- 59.Haskins K, Kubo R, White J, Pigeon M, Kappler J, Marrak P. The major histocompatibility complex-restricted antigen receptor on T cells. I. Isolation with a monoclonal antibody. J Exp Med. 1983;157:1149–69. doi: 10.1084/jem.157.4.1149. [DOI] [PMC free article] [PubMed] [Google Scholar]
- 60.Kearney ER, Pape KA, Loh DY, Jenkins MK. Visualization of peptide-specific T cell immunity and peripheral tolerance induction in vivo. Immunity. 1994;1:327–39. doi: 10.1016/1074-7613(94)90084-1. [DOI] [PubMed] [Google Scholar]
- 61.Pape KA, Khoruts A, Ingulli E, Mondino A, Merica R, Jenkins MK. Antigen-specific CD4+ T cells that survive after the induction of peripheral tolerance possess an intrinsic lymphokine production defect. Novartis Found Symp. 1998;215:103–13. doi: 10.1002/9780470515525.ch8. [DOI] [PubMed] [Google Scholar]
- 62.Isakson PC, Pure E, Vitetta ES, Krammer PH. T cell-derived B cell differentiation factor(s). Effect on the isotype switch of murine B cells. J Exp Med. 1982;155:734–48. doi: 10.1084/jem.155.3.734. [DOI] [PMC free article] [PubMed] [Google Scholar]
- 63.Pene J, Rousset F, Briere F, Chretien I, Paliard X, Banchereau J, et al. IgE production by normal human B cells induced by alloreactive T cell clones is mediated by IL-4 and suppressed by IFN-gamma. J Immunol. 1988;141:1218–24. [PubMed] [Google Scholar]
- 64.Coffman RL, Carty J. AT cell activity that enhances polyclonal IgE production and its inhibition by interferon-gamma. J Immunol. 1986;136:949–54. [PubMed] [Google Scholar]
- 65.Snapper CM, McIntyre TM, Mandler R, Pecanha LM, Finkelman FD, Lees A, et al. Induction of IgG3 secretion by interferon gamma: a model for T cell-independent class switching in response to T cell-independent type 2 antigens. J Exp Med. 1992;175:1367–71. doi: 10.1084/jem.175.5.1367. [DOI] [PMC free article] [PubMed] [Google Scholar]
- 66.Snapper CM, Paul WE. Interferon-gamma and B cell stimulatory factor-1 reciprocally regulate Ig isotype production. Science. 1987;236:944–7. doi: 10.1126/science.3107127. [DOI] [PubMed] [Google Scholar]
- 67.Coffman RL, Lebman DA, Shrader B. Transforming growth factor beta specifically enhances IgA production by lipopolysaccharide-stimulated murine B lymphocytes. J Exp Med. 1989;170:1039–44. doi: 10.1084/jem.170.3.1039. [DOI] [PMC free article] [PubMed] [Google Scholar]
- 68.Briere F, Servet-Delprat C, Bridon JM, Saint-Remy JM, Banchereau J. Human interleukin 10 induces naive surface immunoglobulin D+(sIgD+) B cells to secrete IgG1 and IgG3. J Exp Med. 1994;179:757–62. doi: 10.1084/jem.179.2.757. [DOI] [PMC free article] [PubMed] [Google Scholar]
- 69.Lorenz M, Jung S, Radbruch A. Switch transcripts in immunoglobulin class switching. Science. 1995;267:1825–8. doi: 10.1126/science.7892607. [DOI] [PubMed] [Google Scholar]
- 70.Weigle WO. Immunological unresponsiveness. Adv Immunol. 1973;16:61–122. doi: 10.1016/s0065-2776(08)60296-5. [DOI] [PubMed] [Google Scholar]
- 71.Frei PC, Benacerraf B, Thorbecke GJ. Phagocytosis of the antigen, a crucial step in the induction of the primary response. PNAS. 1965;53:20–3. doi: 10.1073/pnas.53.1.20. [DOI] [PMC free article] [PubMed] [Google Scholar]
- 72.Dresser W. Effectiveness of lipid and lipidophilic substances as adjuvants. Nature. 1961;191:1169–71. doi: 10.1038/1911169a0. [DOI] [PubMed] [Google Scholar]
- 73.Krauth J. The interpretation of significance test for independence and dependent samples. J Neurosci Methods. 1983;9:269–81. doi: 10.1016/0165-0270(83)90058-4. [DOI] [PubMed] [Google Scholar]
- 74.Ludbrook J, Dudley H. Issues in biomedical statistics: analyzing 2 × 2 tables of frequencies. Aust N Z J Surg. 1994;64:780–7. doi: 10.1111/j.1445-2197.1994.tb04539.x. [DOI] [PubMed] [Google Scholar]
- 75.Benjamin RJ, Cobbold SP, Clark MR, Waldmann H. Tolerance to rat monoclonal antibodies. Implications for serotherapy. J Exp Med. 1986;163:1539–52. doi: 10.1084/jem.163.6.1539. [DOI] [PMC free article] [PubMed] [Google Scholar]
- 76.Nag B, Wada HG, Passmore D, Clark BR, Sharma SD, McConnell HM. Purified beta-chain of MHC class II binds to CD4 molecules on transfected HeLa cells. J Immunol. 1993;150:1358–64. [PubMed] [Google Scholar]
- 77.Blue ML, Hafler DA, Daley JF, Levine H, Craig KA, Breitmeyer JB, et al. Regulation of T cell clone function via CD4 and CD8 molecules. Anti-CD4 can mediate two distinct inhibitory activities. J Immunol. 1988;140:376–83. [PubMed] [Google Scholar]
- 78.Bonnard M, Haughn L, Julius M. CD4-mediated inhibiton of IL-2 production in activated T cells. J Immunol. 1999;162:1252–60. [PubMed] [Google Scholar]
- 79.Longhi MS, Hussain MJ, Mitry RR, Arora SK, Mieli-Vergani G, Vergani D, et al. Functional study of CD4+CD25+ regulatory T cells in health and autoimmune hepatitis. J Immunol. 2006;176:4484–91. doi: 10.4049/jimmunol.176.7.4484. [DOI] [PubMed] [Google Scholar]
- 80.Stassen M, Jonuleit H, Muller C, Klein M, Richter C, Bopp T, et al. Differential regulatory capacity of CD25+ T regulatory cells and preactivated CD25+ T regulatory cells on development, functional activation, and proliferation of Th2 cells. J Immunol. 2004;173:267–74. doi: 10.4049/jimmunol.173.1.267. [DOI] [PubMed] [Google Scholar]
- 81.Skapenko A, Kalden JR, Lipsky PE, Schulze-Koops H. The IL-4 receptor alpha-chain-binding cytokines, IL-4 and IL-13, induce forkhead box P3-expressing CD25+CD4+ regulatory T cells from CD25-CD4+ precursors. J Immunol. 2005;175:6107–16. doi: 10.4049/jimmunol.175.9.6107. [DOI] [PubMed] [Google Scholar]
- 82.Vikingsson A, Pederson K, Muller D. Altered kinetics of CD4+ T cells proliferation and interferon-g production in the absence of CD8+ T lymphocytes in virus-infected b2-microglobulin-deficient mice. Cell Immunol. 1996;173:261–8. doi: 10.1006/cimm.1996.0276. [DOI] [PubMed] [Google Scholar]
- 83.Xystrakis E, Dejean AS, Bernard I, Druet P, Liblau R, Gonzalez-Dunia D, et al. Identification of a novel regulatory CD8 T-cell subset and analysis of its mechanism of regulation. Blood. 2004;104:3294–301. doi: 10.1182/blood-2004-03-1214. [DOI] [PubMed] [Google Scholar]
- 84.Stock P, Kallinich T, Akbari O, Quarcoo D, Gerhold G, Wahn U, et al. CD8+ T cells regulate immune responses in a murine model of allergen-induced sensitization and airway inflammation. Eur J Immunol. 2004;34:1817–27. doi: 10.1002/eji.200324623. [DOI] [PubMed] [Google Scholar]
- 85.Wu Z, Bensinger SJ, Zhang J, Chen C, Yuan X, Huang X, et al. Homeostatic proliferation is a barrier to transplantation tolerance. Nat Med. 2004;10:87. doi: 10.1038/nm965. [DOI] [PMC free article] [PubMed] [Google Scholar]
- 86.Tanchot C, Rosado MM, Agenes F, Freitas AA, Rocha B. Lymphocyte homeostasis. Semin Immunol. 1997;9:331. doi: 10.1006/smim.1997.0090. [DOI] [PubMed] [Google Scholar]
- 87.King C, Ilic A, Koelsch K, Sarvetnick N. Homeostatic expansion of T cells during immune insufficiency generates autoimmunity. Cell. 2004;117:265. doi: 10.1016/s0092-8674(04)00335-6. [DOI] [PubMed] [Google Scholar]
- 88.Vremec D, Zorbas M, Scollay R, Saunders DJ, Ardavin CF, Wu L, et al. The surface phenotype of dendritic cells purified from mouse thymus and spleen: investigation of the CD8 expression by a subpopulation of dendrtic cells. J Exp Med. 1992;176:47–58. doi: 10.1084/jem.176.1.47. [DOI] [PMC free article] [PubMed] [Google Scholar]
- 89.Bilsborough J, George TC, Norment A, Viney JL. Mucosal CD8a+DC, with a plasmacytoid phenotype, induce differentiation and support function of T cells with regulatory properties. Immunology. 2003;108:481–92. doi: 10.1046/j.1365-2567.2003.01606.x. [DOI] [PMC free article] [PubMed] [Google Scholar]
- 90.O'Connell PJ, Li W, Wang Z, Specht SM, Logar AJ, Thomson AW. Immature and mature CD8a+ dendritic cells prolong the survival of vasculatized heart allografts. J Immunol. 2002;168:143–54. doi: 10.4049/jimmunol.168.1.143. [DOI] [PubMed] [Google Scholar]
- 91.Suss G, Shortman K. A subclass of dendritic cells kills CD4 T cells via Fas/Das ligand-induced apoptosis. J Exp Med. 1996;183:1789–96. doi: 10.1084/jem.183.4.1789. [DOI] [PMC free article] [PubMed] [Google Scholar]
- 92.Lambolez F, Jooss K, Vasseur F, Sarukhan A. Tolerance induction to self antigens by peripheral dendritic cells. Eur J Immunol. 2002;32:2588–97. doi: 10.1002/1521-4141(200209)32:9<2588::AID-IMMU2588>3.0.CO;2-1. [DOI] [PubMed] [Google Scholar]
- 93.Maldonado-Lopez R, De Smedt T, Michel P, Godfroid J, Pajak B, Heirman C, et al. CD8a+ and CD8a-subclasses of dendritic cells direct the development of distinct T helper cells in vivo. J Exp Med. 1999;189:587–92. doi: 10.1084/jem.189.3.587. [DOI] [PMC free article] [PubMed] [Google Scholar]
- 94.Maldonado-Lopez R, De Smedt T, Pajak B, Michel P, Heirman C, Leo O, et al. Role of CD8a+ and CD8a-dendritic cells in the induction of primary immune responses in vivo. J Leukoc Biol. 1999;66:242–6. doi: 10.1002/jlb.66.2.242. [DOI] [PubMed] [Google Scholar]