

Abstract
Reactive oxygen species (ROS) are important regulators of intracellular signaling. We examined the expression of ROS during rat brain development and explored their role in differentiation using cortical cultures. High levels of ROS were found in newborn neurons. Neurons produced ROS, not connected with cell death, throughout embryogenesis and postnatal stages. By P20, ROS-producing cells were found only in neurogenic regions. Cells with low levels of ROS, isolated from E15 brains by FACS, differentiated into neurons, oligodendrocytes, and astrocytes in clonal cultures. Neurons produced high ROS early in culture and later differentiated into two types: large pyramidal-like neurons that fired no or only a single action potential and smaller neurons that expressed nuclear calretinin and fired repeated action potentials. Antioxidant treatment did not alter neuron number but increased the ratio of small to large neurons. These findings suggest that modulation of ROS levels influences multiple aspects of neuronal differentiation.
INTRODUCTION
Reactive oxygen species (ROS), such as superoxide (O2•−) and hydrogen peroxide (H2O2) are produced intracellularly as part of normal metabolic reactions (Babior, 2002; Vignais, 2002). ROS are highly reactive oxidants (Liochev, 1996; Turrens, 2003) and their excessive, uncontrolled production can have detrimental effects on cellular physiology and function, often leading to apoptosis and a variety of diseases (Finkel, 2003).
Recent studies have suggested that elevated, but sub-lethal, levels of O2• − and H2O2 can act to influence intracellular signaling pathways in a variety of neuronal and non neuronal cells by modulating gene expression, cellular growth, and differentiation (Droge, 2002; Finkel, 1998; Hancock et al., 2001; Kamata and Hirata, 1999; Klann and Thiels, 1999; Rhee, 1999). ROS have been shown to regulate differentiation of microbial eukaryotes (Aguirre et al., 2005), to control intracellular signaling in plants (Desikan et al., 2004; Foreman et al., 2003; Kwak et al., 2003; Mori and Schroeder, 2004), and to influence differentiation of cardiac stem cells (Puceat, 2005), tumour angiogenesis (Sauer and Wartenberg, 2005), and angiotensin II-mediated renal growth and differentiation (Wolf, 2005). Thus, alteration of intracellular levels of ROS to regulate cellular growth and differentiation is a ubiquitous strategy in eukaryotes selected early in evolution.
Most relevant for the current study are the demonstrated effects of ROS on neuronal morphology and function. ROS have been shown to be essential for the NGF-induced differentiation of PC12 cells (Katoh et al., 1997; Katoh et al., 1999; Suzukawa et al., 2000) via TrkA (Kamata et al., 2005) and, in hippocampal neurons, high levels of O2• − (Bindokas et al., 1996) modulate neuronal plasticity (Hongpaisan et al., 2004; Knapp and Klann, 2002). Redox state has also been shown to modulate differentiation of mesencephalic precursors (Lee et al., 2003; Studer et al., 2000), of neural crest stem cells (Morrison et al., 2000), and of O2-A progenitors (Smith et al., 2000) in vitro. ROS can therefore influence multiple aspects of neural differentiation and function, including the survival and the plasticity of neurons, the proliferation of neural precursors, as well as their differentiation into specific neuronal cell types.
How ROS might affect growth and differentiation of mammalian cortical progenitors is not well understood. Previously, we showed that high levels of ROS are present in cultured neurons and in cells in brain slices from the embryonic and postnatal cortex (Tsatmali et al., 2005). The distribution suggested that they were young migrating neurons, which are born and migrate radially in the rat cortex from E12 through P14 (Bayer and Altman, 1995). In the present study, we examined the appearance of cells with high ROS in development and investigated the role of ROS in the differentiation of embryonic cortical progenitors. We report that rat cortical progenitors in clonal culture produce two types of neurons with different electrical and biochemical properties. Decreasing ROS in the clonal cultures of progenitors shifted the differentiation of the two types of neurons. The findings suggest that ROS play a key role in neuronal maturation.
RESULTS
Developing neurons produce high levels of ROS in vivo
To extend our previous observations (Tsatmali et al., 2005), we looked at the presence of cells with high ROS in various brain regions during development and, to establish that the cells were neurons, measured their physiological properties. Slices from P3 cortex revealed numerous cells that stained brightly after treatment with the ROS-sensing dye, CM-H2DCF-DA, which is de-esterified and oxidized to its fluorescent product CM-DCF only after entering live cells. Cells with high levels of ROS were found throughout the cortex but appeared to be most numerous in the intermediate zone of the developing cortical plate (Fig. 1A, B). It is known that neurons in the cortex undergo massive cell death during development (Kuan et al., 2000; Oppenheim, 1991) and also that high ROS levels can be associated with cells undergoing apoptosis (Krantic et al., 2005; Rego and Oliveira, 2003). To address whether the high ROS-producing cells were undergoing cell death, slices were stained with CM-H2DCF-DA and propidium iodide (PI), which stains dead or dying cells (Fig. 1B). Although many dying cells were found throughout the slice, very few cells labeled with both propidium iodide and CM-DCF. Slices were also stained with the apoptotic marker annexin V (Fig. 1C), a marker for the early to middle stages of apoptosis . Most of the cells with high levels of ROS did not stain for annexin V at the cell membrane. A few cells with clear annexin V surface staining had medium to high levels of ROS and some annexin-positive cells had no ROS (Fig.1C, arrows). These findings indicate that high levels of ROS do not reflect a population that is undergoing the massive cell death or apoptosis observed in the developing cortex.
Figure 1. Developmental expression of ROS and staining for cell death markers.
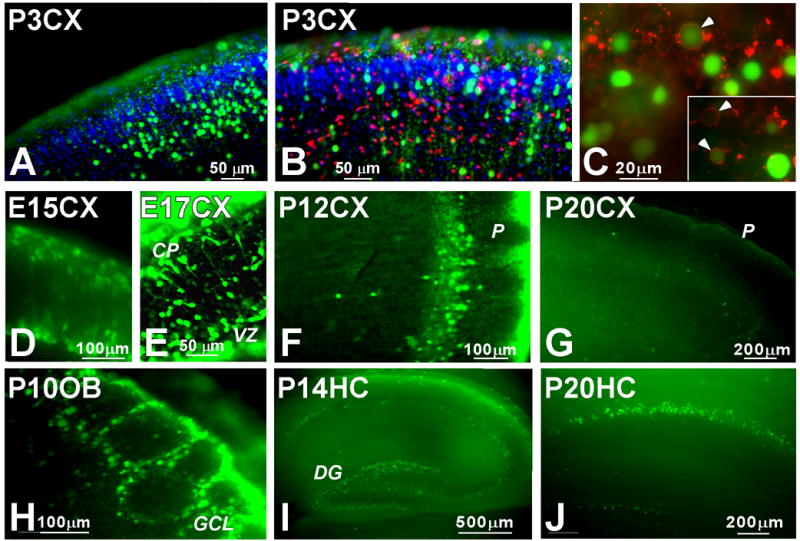
Postnatal day 3 rat brain slices were stained for ROS production with CM-H2DCF-DA (green, A–C), and counterstaining with either propidium iodide (red, B) or annexin V (red, C). Nuclei are stained with DAPI (blue, A, B). Yellow fluorescence results from the superposition of red and green and indicates when cells with high levels of ROS also express the cell death marker, propidium iodide (B). Annexin V stains the surface of cells (C, arrows) in the early to middle stages of apoptosis. Aggregates of annexin V were also observed within the slices (C). Slices from rat brains at the indicated ages and regions were stained for ROS production with CM-H2DCF-DA (green). E, embryonic day; P, postnatal day; CX, cortex; OB, olfactory bulb; HC, hippocampus.
Cells with high ROS levels were found in the brain throughout embryonic and early postnatal development (Fig. 1D–J). A large number of such cells were found in the E15 and E17 cortex, the earliest times in development that could practically be examined using slices (Fig. 1D, E). The distribution pattern of the cells with high levels of ROS in the E15, E17, and P12 (Fig. 1F) cortex was similar to that of young migratory neurons (Hatanaka et al., 2004; Nadarajah et al., 2003). A few migratory cells are clearly apparent in the P12 cortex (Fig. 1F). The number of cells with high ROS decreased in the cortex from E21 (not shown) through P12 (Fig. 1F) and very few were found by P20 (Fig. 1G).
At postnatal stages, cells with high ROS were found in the glomerular layer of the olfactory bulb (Fig. 1H) and in the dentate gyrus of the hippocampus (Fig. 1I, J) and high ROS cells remained in these structures in the adult (not shown). By P20, when ROS-producing cells were no longer predominant in the cortex (Fig. 1G), many cells in the hippocampus, particularly in the dentate gyrus (Fig. 1J), continued to produce high levels of ROS. These findings are consistent with the presence of high levels of ROS in differentiating neurons during embryonic development and in adult neurogenic regions.
The neuronal properties of cells with high ROS levels were examined using patch clamp analysis (Fig. 2A, B). Although ROS-positive cells were found in all layers In the P10 cortex, recordings were made from pyramidal cells in layers II/III and V as cells in these layers have well-characterized response properties and are the simplest neurons to record from. ROS-positive cells had neuronal morphologies, normal membrane potentials, and fired repeated action potentials upon current injection (Fig. 2C). The number of spikes fired (f) in the active cells was proportional to the amount of current injected (I) (F/I curve; Fig. 2D). No obvious differences were observed in the physiological properties of high ROS and neighboring low ROS cells (not shown). These data indicated that cells producing high ROS were functional neurons.
Figure 2. Physiology of cells with high levels of ROS.
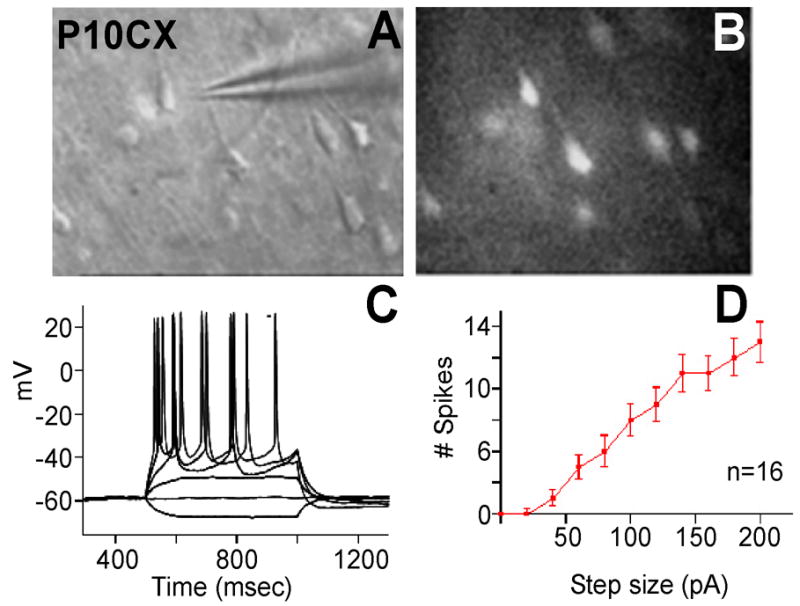
Patch clamp recordings were performed on high ROS-producing cells as described in Experimental Methods. Cells stained for ROS (B) were identified morphologically (A) and patched. (C) Firing pattern after current injection. (D) Firing rate as a function of current levels (F/I curve).
FACS-isolated cortical progenitors are multipotent, and the progenitor-derived neurons produce high levels of ROS
To determine the origin of high ROS-producing cells, we utilized a clonal culture system of FACS-isolated neural progenitor cells as described in the Materials and Methods section. This system also allowed us to analyze the ability of progenitor cells to differentiate when ROS levels were decreased by antioxidant treatment.
Cells with the lowest reactivity with the ROS-sensing dye, CM-H2DCF-DA were collected (approximately 35% of the total cells). We showed previously (Tsatmali et al., 2005) that 99% of this cell population expressed nestin (a marker of undifferentiated progenitor cells (Lendahl et al., 1990) and of glial cells that have the ability to become neurons (reviewed in (Doetsch, 2003; Gotz, 2003; Tramontin et al., 2003)), and incorporated BrdU, indicating that they were proliferative progenitor cells. The cells were placed in growth medium with either FGF2 (20 ng/ml), EGF (20 ng/ml) or FGF2 and EGF together and expanded for seven days.
The clonal potential of the progenitor cells was examined in two types of clonal culture. Single cells were seeded into 96-well plates using the FACS sorter. Approximately 10 % of the isolated cells formed neurospheres under these conditions. No neurospheres were formed in the absence of growth factors. Progenitor cells were also grown at clonal density (2 cells/μ l) in 60 mm2 tissue culture dishes (Reynolds and Weiss, 1992; Tropepe et al., 1999). In these cultures, single floating cells divided within 24 hours to give doublets, which quickly grew into neurospheres. The proportion of cells that gave neurospheres and the size of the neurospheres in these bulk cultures were similar to those seen in 96-well plates. The large number of neurospheres recovered per dish in the bulk cultures favored their use in subsequent studies.
When placed on surfaces coated with poly-L-lysine and laminin, clonal neurospheres attached, and the cells spread symmetrically in all directions. As long as growth factors were present, the cells continued to divide (39.2 ± 3.5 % after 4h, 100% after 24h of BrdU exposure with FGF2 + EGF, n=16) and remained immunopositive for nestin. Differentiation was initiated by replacing the medium with fresh growth factor-free medium. At 0 and 2 days of differentiation, low levels of ROS were detected in a small number of cells that were also positive for the death marker PI (Fig. 3A, B). The CM-DCF staining in these cells was confined within punctate structures (possibly aggregated mitochondria) and did not fill the entire cell body. The presence of PI in the nuclei suggested that ROS in these cells were related to early events in cell death (Kirkland and Franklin, 2003). In contrast, after 4 days, high levels of CM-DCF staining appeared in several cells that did not co-stain with PI (Fig. 3C). In these cells CM-DCF fluorescence filled the entire cell body. The number of such cells increased after 7 days when they started to extend small, thin processes that were also filled with green fluorescence (Fig. 3D).
Figure 3. Characterization of clonal neurosphere cultures.
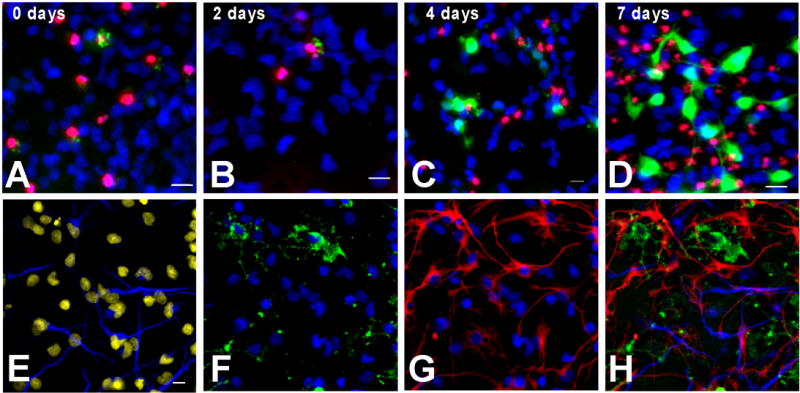
(A–D) Single neurospheres were transferred to glass slides coated with poly-L-lysine and laminin and allowed to differentiate. Live cells were stained for the presence of ROS (green) at the indicated days after initiation of the differentiation process and nuclei were visualized with Hoescht dye (blue). At 0 days (A) and two days (B), low levels of ROS were present in cells that were also positive for the death marker propidium iodide (PI) (red). No live, healthy cells in the cultures showed signs of ROS production, indicated by the combined staining for ROS and PI, which appears as yellow staining. However, after four days (C), several PI negative cells stain for CM-DCF. By seven days (D), the number of ROS positive cells increased and the cells with the high ROS production started to acquire neuronal-like morphology. (E–H) After seven days of differentiation, cells were fixed and immunostained with specific antibodies against β III tubulin (E) (blue), O4 (F) (green) and GFAP (G) (red) (all three shown merged in H). Nuclei were stained with DAPI (E–G) (blue, but shown in yellow pseudocolor in panel E). All clonal cultures examined were multipotent. The majority of the cells were GFAP positive astrocytes (See Table 1). The number of neurons and oligodendrocytes was similar. No other cell types were present in these cultures. Scale bar=10 μ m.
To determine the cell types present after seven days of differentiation, clonal cultures were fixed and immunostained with marker antibodies for neurons (β III-tubulin-positive), oligodendrocytes (O4-positive) and astrocytes (GFAP- positive) (Fig. 3E–H). Every clone was multipotent (n=65), having cells of each type, but in all cases the majority of the cells were astrocytes (Table 1). The small proportion of neurons was maintained at the same levels under all growth factor conditions (Table 1). O4 positive cells were most abundant in neurosphere cultures grown with FGF2 alone; in EGF or EGF and FGF2, the proportion of oligodendrocytes was 4 and 2 times lower respectively (Table 1). There was little or no double staining with any of the antibodies used.
Table 1. Differentiation of clonal neurosphere cultures.
Neurospheres grown for seven days in the presence of FGF2, EGF, or FGF2 and EGF together were allowed to differentiate and were fixed and immunostained with antibodies specific for β III tubulin, O4, and GFAP. Each cell type is expressed as a proportion of the total live cell population ± SEM.
| Cell types in clonal cultures | Growth factors present in medium prior to differentiation | ||
|---|---|---|---|
| FGF2 | EGF | FGF2 + EGF | |
| Neurons (β III tubulin) | 6.0 ± 4.1 % | 9.7 ± 3.5 % | 7.0 ± 0.6 % |
| Oligodendrocytes (O4) | 13.3 ± 4.8 % | 3.0 ± 0.2 % | 7.6 ± 0.9 % |
| Astrocytes (GFAP) | 81.4 ± 7.9 % | 87.2 ± 3.2 % | 85.4 ± 1.3 % |
Differentiating clonal cultures contain two morphologically and biochemically distinct types of neurons
Inspection of the neuronal cells in the clonal cultures revealed two types of β III tubulin-positive cells with distinct morphologies, which we designated type I and type II neurons (Fig. 4, red stain is β III tubulin). Type I neurons had flat, pyramidal-shaped somata with multiple processes protruding in all directions from near the soma (Fig. 4A, B). Type II neurons had smaller, rounded somata and two to four major processes, one of which was often thicker than the others. Many of these cells appeared bipolar in their neurite patterns as visualized by β III tubulin staining. The processes extended for 20–30 μ m before branching and secondary branching was minimal (Fig. 4C, D). Although the morphologies of type II neurons were more variable, the small rounded somata were easily distinguished from the flat pyramidal-like soma of the type I cells and allowed their unambiguous identification.
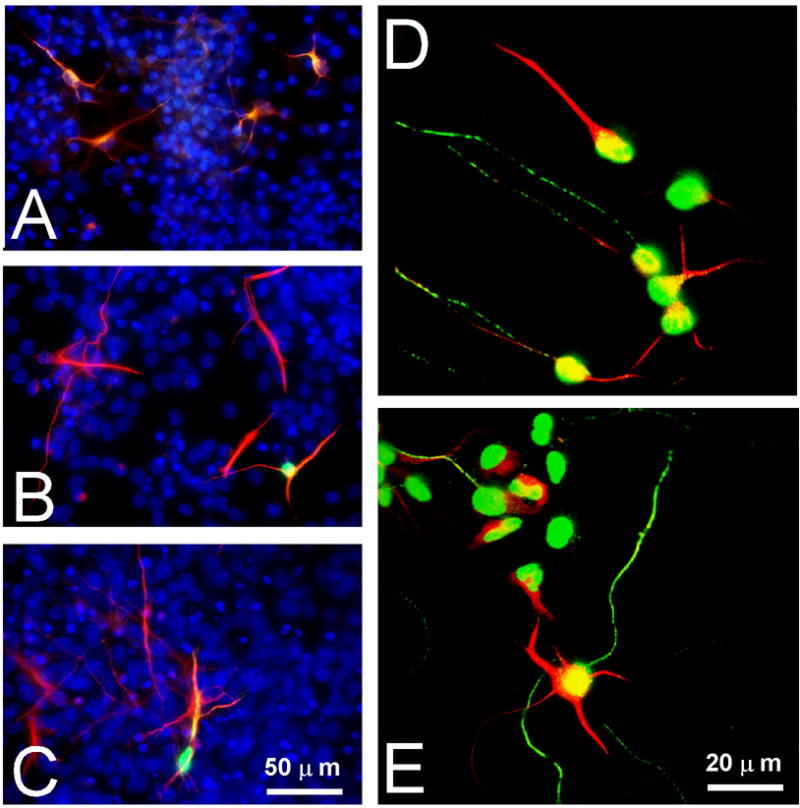
Figure 4. Two morphologically distinct types of neurons are present in clonal and primary cortical cultures.
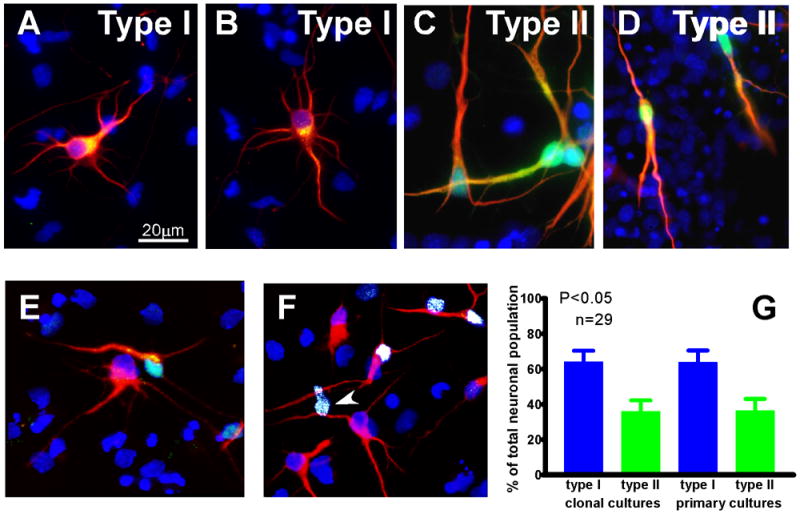
(A–D) Clonal neurospheres were grown under differentiation conditions and immunostained for calretinin (green) and β III tubulin (red). Nuclei were counterstained with DAPI (blue). (E, F) Three-dimensional reconstructions obtained using confocal microscopy. Type I neurons (A, B, E, F) have large, flat somata with multiple processes and little expression of calretinin. Type II neurons (C, D, E, F) have small round somata and only 2–4 processes extend from them. One of the processes is long and thick while the others are thinner. (E, F) Confocal microscopy and three-dimensional reconstruction using IMARIS software show that calretinin is present in the nuclei and thick processes of type II neurons (E, F). The majority of calretinin immunostaining appears to reside in the nucleus (white staining in F represents the colocalization of the green and blue channels). Calretinin immunoreactivity was also detected in the nuclei of non-neuronal cells (F, arrowheads). Type I neurons have little calretinin staining in the perinuclear region and proximal processes but none in the nucleus (A, B). (G) In clonal cultures, type I neurons are the majority of the neuronal population, while type II neurons are fewer. In E15 primary cortical cultures grown for 4 days, the same morphologically distinct types of neurons were present in similar proportion to that seen for the clonal cultures. Scale bar=20μ m
Additional characterization revealed that the two neuronal types differentially expressed the calcium binding protein calretinin. Type I neurons expressed low levels of calretinin in the proximal region of the major process and in the soma (Fig. 4A, B, green fluor, positive staining is seen in yellow due to the overlap with the red β III tubulin staining). In type II neurons, calretinin was localized primarily in the nucleus (where it often appeared as an aqua color due to colocalization with the DAPI nuclear counterstain), but was also found in the cell body and processes (Fig. 4C, D), although the process staining is often not apparent against the high level of β III tubulin staining. The colocalization of calretinin with DAPI was confirmed using confocal microscopy (Fig. 4E, F), which confirmed that most of the staining was in the nucleus. In Figure 4F, the overlap of green and blue fluors is shown as white pseudocolor and was observed in β III tubulin-stained neurons (red) and in a small number of non-neuronal cells (arrowheads). Additional immunostaining showed that the calretinin expressing non-neuronal cells were astrocytes (not shown).
Quantitation of the numbers of each type of neuron (Fig. 4G) showed that type I neurons were the majority of the total neuronal population (64.0 ± 6.2 % vs. 35.9 ± 6.2 % for type II, n=29; Fig. 5G). To determine whether the different types of neurons were selected due to the in vitro clonal culture, we examined the morphology of neurons isolated and cultured directly from E15 cortices. The neurons in primary cultures had morphologies similar to those seen in clonal cultures (Fig. 5A–C) and the proportion of each type of neuron was similar to that in differentiated clonal cultures (63.7 ± 6.7 type I and 36.3 ± 6.8 type II n= 30; Fig. 4G). Moreover, both types of differentiated neurons showed clear polarity as evidenced by confocal imaging of cells stained with antibodies to the polarity markers MAP2 and Tau (Fig. 5D,E).
Figure 5. Staining of primary E15 cortical cultures.
A–C Cells were stained for β III-tubulin (red), calretinin (green), and DAPI (blue) and photographed at low magnification. These micrographs were used to count the numbers of neurons and neuronal types in primary cultures as quantified in Fig. 4 G. D, E. Cells were stained with the neuronal polarity markers MAP2 (red) and Tau (green) and imaged by confocal microscopy.
Electrophysiological recordings of type I and type II neurons
The morphological differences and the differential expression of calretinin between type I and type II neurons suggested that they might be physiologically distinct types of neurons. To address this issue, electrophysiological recordings were carried out in primary neuronal cultures (Fig. 6) since it was hard to identify and patch neuronal cells in the high-density clonal cultures. Whole cell patch recordings were obtained after 14–20 DIV. Bright field microscopy was used to distinguish between putative type I and type II neurons (Fig. 6A).
Figure 6. Electrophysiological characterization of type I and type II neurons in primary cultures.
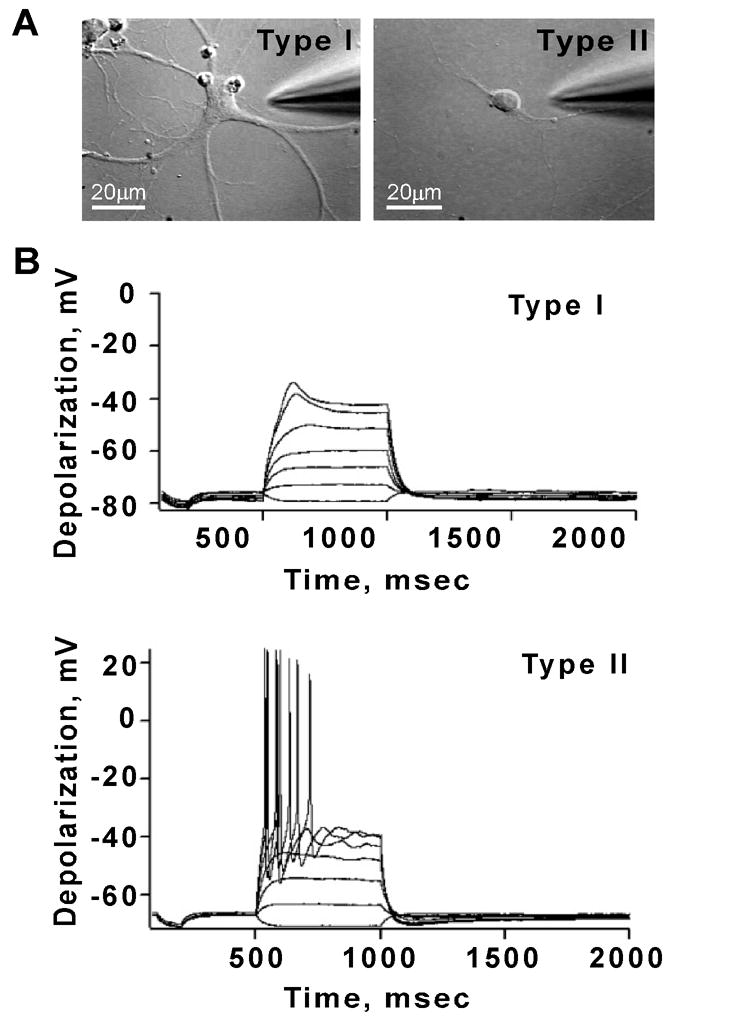
Recording made from E15 cortical neurons grown on glass coverslips for 14–20 days. (A) Cells were chosen for recording according to their morphological characteristics. As seen in DIC images, type I neurons had flat somata and several processes and type II neurons had round somata and a smaller number of processes. Bar = 20 μ m (B) Most type I neurons fired a single action potential (55% of cases) or none (27% of cases) (top panel), but the membrane potential showed some evidence of active currents. In contrast, type II neurons were able to fire multiple action potentials in response to current injection (81% of cases) (bottom panel).
Whole-cell patch clamp recordings revealed no differences in basic intrinsic properties such as resting membrane potentials (−63 ± 3mV, n=11 type I, −62 ± 2, n=16 type II) or input resistances (323 ± 61 MΩ vs. 346 ± 50 MΩ ) between the two cell types. The majority of type I neurons fired a single action potential (55%), while a few fired either multiple action potentials (18%) or were unable to generate an action potential (27%; Fig. 6B, top). In the neurons that fired single action potentials, some had higher apparent thresholds requiring large current steps (>0.25 nA) to trigger action potentials. In contrast, most of the type II neurons responded to current steps with repetitive action potentials and displayed normal frequency-current characteristics (81% multiple action potentials, 6% no action potential, 13% single action potential, Fig. 6B, bottom). Thus the two types of neurons had distinct electrophysiological characteristics.
Alterations of ROS levels in clonal cultures led to changes in the differentiation of neuronal progenitors
To test the idea that different levels of ROS influenced neuronal differentiation, we examined the ability of progenitor cells to differentiate in the presence of antioxidants. Both O2• − and H2O2 were shown in our previous study to contribute to the ROS signal (Tsatmali et al., 2005). SOD-PEG (100U/ml), CAT-PEG (50U/ml), and the SOD mimetic MnTMPyP (10μ M) are cell-permeant and very effective O2• − and H2O2 scavengers (Faulkner et al., 1994; Gardner et al., 1996; Tsatmali et al., 2005). (Covalent conjugation of SOD and CAT to PEG increases the half-life of these enzymes from <10 minutes to 40 hours (Beckman et al., 1988)). For effective ROS perturbation, the antioxidants were added as soon as growth factors were removed from the culture medium and were replenished every second day during the seven-day differentiation period.
None of the antioxidant treatments significantly modified the proportions of astrocytes, neurons, or oligodendrocytes (Table 2). Moreover, none of the antioxidants significantly increased the number of dead cells, as determined by counting the number of apoptotic nuclei in control and treated cultures. Dead cells were 26.2 ± 2.9% of total cell population in control cultures (n=15), 32.7 ± 5.5% in the presence of SOD-PEG (n=9), 28.5 ± 3.4% in the presence of CAT-PEG (n=7), and 26.6 ± 5.5% in the presence of MnTMPyP (n=8).
Table 2. Proportion of neurons, oligodendrocytes and astrocytes in clonal cultures differentiated in the presence of antioxidants.
Clonal neurospheres were grown and differentiated as described in Material and Methods in control cultures or cultures in the presence the antioxidants SOD-PEG (100 U/ml; A), CAT-PEG (50 U/ml; B) or MnTMPyP (10μ M; C). After 7 days, cells were fixed and immunostained for β III tubulin, O4, and GFAP. 4–6 fields containing 100–200 cells were photographed from each culture and the total number of cells (evaluated by DAPI nuclear staining) as well as the number of cells expressing each marker antibody were counted. None of the antioxidants used was able to change significantly the proportion of the various differentiated cell populations. Each column represents cell subpopulation as a percentage of the total live cell population ± SEM (control, n=18; SOD-PEG, n=10; CAT-PEG, n=8; MnTMPyP, n=8, where n = the number of cultures evaluated).
| Neurons (β III tubulin) | Oligodendrocytes (O4) | Astrocytes (GFAP) | |
|---|---|---|---|
| Control | 6.8 ± 0.7 % | 7.1 ± 0.8 % | 87.5 ± 1.8 % |
| SOD-PEG | 10.0 ± 2.6 % | 7.4 ± 2.4 % | 87.7 ± 2.7 % |
| CAT-PEG | 6.0 ± 1.6 % | 2.5 ± 0.8 % | 91.4 ± 1.9 % |
| MnTMPyP | 9.3 ± 1.9 % | 4.1 ± 0.6 % | 86.4 ± 1.5 % |
Although antioxidants did not influence the percentage of progenitors that became neurons, the number of neurons with type II morphology increased dramatically, with a concomitant decrease in the type I neurons (Figure 7). After treatment with SOD-PEG, the number of neurons with nuclear calretinin expression increased over two-fold compared with control (Fig. 7E) (35.9 ± 6.2% of the total neuronal population in control cultures (n=9), 79.0 ± 4.3% in SOD treated cultures (n=9)). In type II neurons, the amount of calretinin staining in the nucleus, soma, and processes increased after SOD-PEG treatment (compare Figs. 7A and B). In addition, there was an increase in the amount of calretinin staining in the processes of type I neurons (compare Fig. 7C and D). However, none of the type I neurons after SOD-PEG treatment acquired nuclear calretinin staining (Fig. 7D). These findings demonstrate that the production of type I cells requires higher levels of ROS and that the accumulation of type II cells was a result of keeping the ROS levels lower by the presence of antioxidants. They are consistent with the notion that higher levels of ROS support the production of multiple neurites and modulate the physiological function of the resultant neurons.
Figure 7. ROS perturbation alters the numbers of type I and type II neurons.
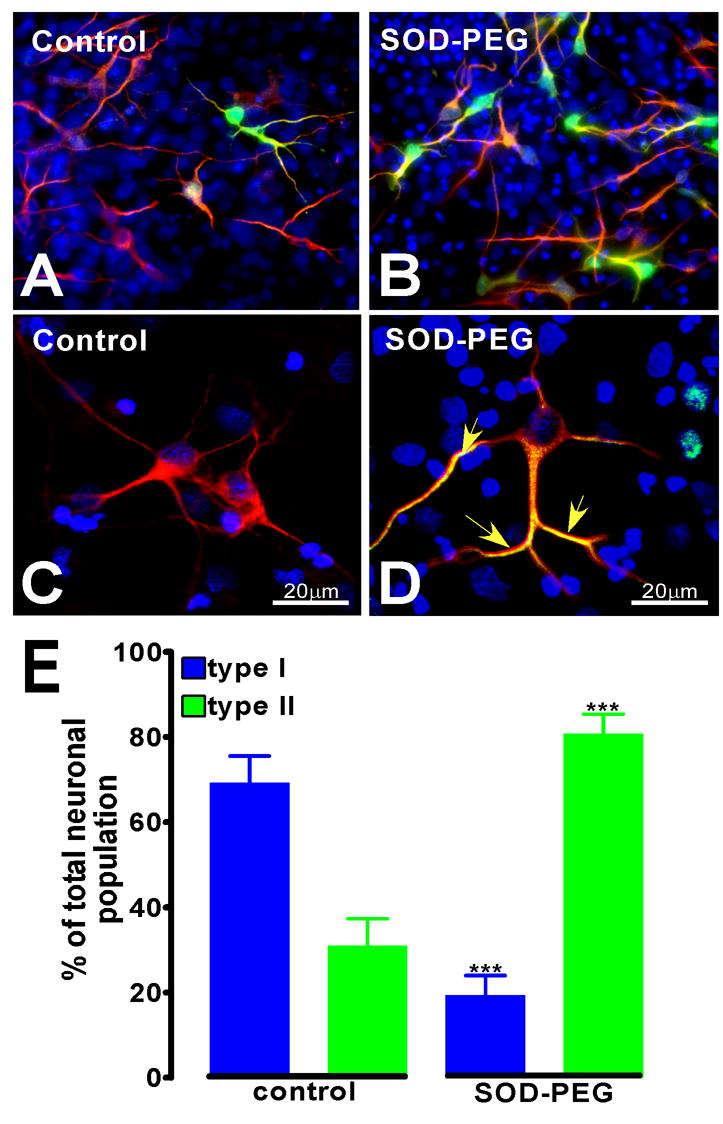
(A, C) Clonal cultures differentiated under control conditions contained fewer calretinin positive, type II neurons than calretinin negative, type I neurons. (B, D) Upon treatment with the antioxidant SOD-PEG (50 U/ml), there was a highly significant (p<0.001), two-fold increase in the number of type II neurons with a concomitant decrease in type I neurons (E). Calretinin staining increased in the processes of type I neurons in the presence of SOD-PEG, but was never found in the nucleus in these cells (D, arrows).
DISCUSSION
The present study has shown that the production of high levels of ROS is associated with young neurons in vivo, is developmentally regulated, and is not associated with cell death. High levels of ROS persist in only neurogenic regions such as the hippocampus and olfactory bulb in the adult brain. In clonal cell cultures from embryonic rat cortex, ROS were produced as soon as neurons differentiated from multipotent progenitor cells. Two types of neuron developed in the clonal cultures: one type (I), which was predominant in control cultures, was pyramidal-like, had multiple neurites of similar diameter, and fired only single or no action potentials; the other type (II) had more rounded cell bodies, fewer processes, expressed calretinin in their nuclei, and fired repeated action potentials. Lowering of ROS levels by antioxidant treatment led to increases in the number of type II neurons at the expense of type I. These findings provide the first evidence for the influence of ROS on the development of morphological and physiological properties of cortical neurons in vivo and in vitro. These findings are summarized in a schematic (Figure 8).
Figure 8. Schematic summarizing the major findings of the present work.
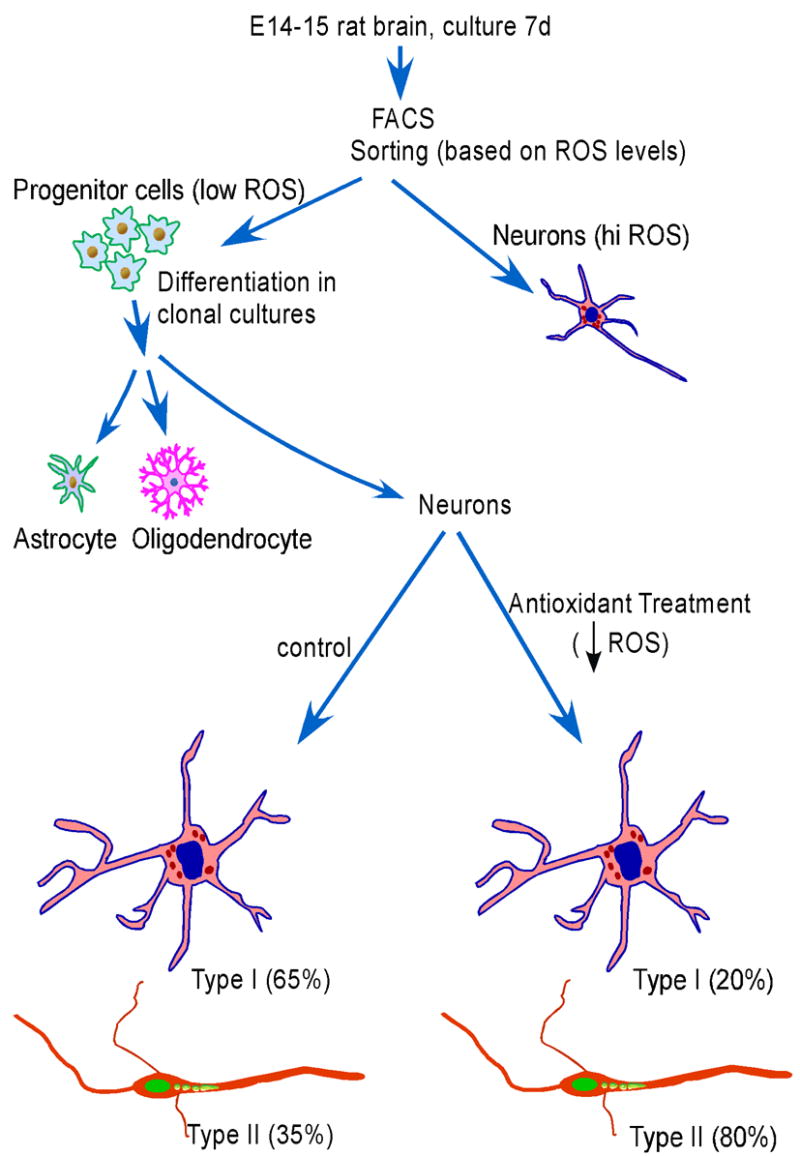
A population of cells containing low levels of ROS from E14–15 rat cortex were isolated and shown by clonal cell culture to be multipotent neural progenitor cells. The high ROS-containing population was composed of neurons (Tsatmali et al., 2005). The multipotent progenitor cells gave rise to two types of neurons, the numbers of which were altered after antioxidant treatment.
In vivo, high ROS-producing cells in the cortical plate and in other regions did not colocalize with dying or apoptotic cells, raising the possibility that ROS play an important role in development. The high ROS cells appeared to be migratory cells, and ROS may impact intracellular processes that are crucial for process extension and cell migration. For example, several studies have implicated ROS in the regulation of GTPases that are known to be important for the cytoskeletal rearrangements necessary for cell migration and for dendritic morphogenesis (Deora et al., 1998; Kheradmand et al., 1998; Moldovan et al., 1999; Puceat, 2005; Scott et al., 2003; Werner and Werb, 2002). Additional studies on the connection between ROS levels and GTPase activity may reveal how both influence cell shape.
Fluorescence-activated cell sorting was employed to isolate E15 rat cortical cells based on their reactivity with a cell permeant ROS indicator, CM-H2DCF-DA (Royall and Ischiropoulos, 1993). Cells that had low reactivity with this dye expressed nestin and incorporated BrdU (Tsatmali et al., 2005), both hallmarks of progenitor cells. Upon differentiation of clonal cultures of these cells, all clones were multipotent, yielding the three major neural cell types: neurons, astrocytes, and oligodendrocytes (Figure 8, left side). FACS strategies have been used by others to isolate stem cells and specific classes of progenitor cells (Maric et al., 2003; Rietze et al., 2001; Uchida et al., 2000). In some of these and other clonal studies (Qian et al., 1997), only one or two types of differentiated cells were found in each clone, depending on the concentration of FGF2 (Qian et al., 1997) or the presence of neurotrophic factors (Uchida et al., 2000). Thus the method described here is defined both by the use of low redox state to select progenitors and by its ability to produce cells of all three neural lineages. It may be possible to manipulate this multipotent progenitor population further by altering the growth factor or neurotrophic factor composition or to isolate subpopulations of progenitors by FACS using additional markers.
When the clonal cultures were allowed to differentiate in vitro, two types of differentiated neurons were observed. Morphologically, the two types of neurons produced in vitro resemble neuronal cell types in vivo (type I are Cajal-Retzius-like and type II are pyramidal-like) suggesting that they represent distinct lineages. Dramatic differences in the proportions of the two neuronal types were observed after lowering ROS levels with antioxidants, although the number of neurons produced remained the same (Figure 8, lower right side). What we termed type I neurons predominated in control cultures but type II neurons were greatly increased in cultures with reduced ROS, suggesting that higher ROS levels support the production of a more elaborate set of processes. This result is consistent with studies in PC12 cells, in which enhanced neurite outgrowth stimulated by NGF is mediated by increased ROS, particularly superoxide (Kamata et al., 1996; Katoh et al., 1997). The increased ROS in turn lead to enhanced phosphorylation of the NGF receptor TrkA (Kamata et al., 2005), Rac1 activation, and sustained MAP kinase phosphorylation as intermediates in the differentiation pathway (Katoh et al., 1999; Suzukawa et al., 2000). Our preliminary studies indicate that the phosphorylation of Trks and MAP kinases are decreased by antioxidant treatment of primary cortical cultures, suggesting that part of the mechanism by which changes in morphology occur could involve alterations in these pathways (unpublished observations).
An important issue for understanding the role of ROS in neuronal differentiation and maturation concerns the differences in ROS expression between experiments in culture and in slices. High ROS levels were transient in vivo but in vitro high ROS levels persisted for up to five weeks, the latest time point examined. It is clear therefore that some feedback loop must exist to decrease the levels of ROS after neuron differentiation and migration. How this might occur via modulation of mitochondrial activity will be an active area of future research.
In addition to their differences in morphology, type I and type II neurons exhibited different electrophysiological properties. Most type I cells fired a single action potential or were unable to fire, but type II cells reliably fired repeated action potentials. The firing properties observed for the type I neurons appear to be consistent with those reported in the developing rat cortex in immature pyramidal cells (Luhmann et al., 2003) and in young migratory neurons (Noctor et al., 2004). Type I and type II neurons also differed in their expression of calretinin, a Ca2+ binding protein (CaBP) that is believed to buffer intracellular Ca2+ (Heizmann, 1984), contribute to membrane repolarization (Pauls et al., 1996), and modulate calcium-signaling (Hubbard and McHugh, 1995). In addition, calretinin is a marker for subpopulations of cortical GABAergic interneurons (del Rio and DeFelipe, 1997; Kubota et al., 1994; Xu et al., 2003) and is found in non-GABAergic neurons of the cortical plate, including Cajal-Retzius cells (del Rio et al., 1995; Weisenhorn et al., 1994). Calretinin is also expressed in immature hippocampal neurons during adult neurogenesis (Kempermann et al., 2004). While nuclear calretinin has not been reported previously in neurons, the calcium-binding protein calbindin-D28k has been observed in the nucleus of midbrain dopaminergic neurons and cerebellar Purkinje cells (German et al., 1997). Investigation into how ROS influence the expression of neuronal physiology and calretinin expression and its nuclear localization may help to clarify the role of ROS in neuronal development and cell physiology.
Mechanistically, ROS are known to reversibly oxidize enzymes such as protein tyrosine phosphatases; this ability underlies one mechanism by which they influence tyrosine phosphorylation and subsequent signaling. A recent report indicates that reversible oxidation regulates the SUMO conjugating enzymes (Bossis and Melchior, 2006). It is an intriguing possibility that ROS could influence this system, which is involved in protein stabilization (Muller et al., 2001), during early neuronogenesis and process outgrowth, thereby impacting the synthetic and degradative pathways necessary for cellular remodeling. Increased ROS production is also associated with cell surface signaling and neuronal differentiation mediated by neuregulin (Goldsmit et al., 2001), Semaphorin 3A (Schwamborn et al., 2004) and MICALs (Terman et al., 2002). These pathways are likely to be activated by cell contact and the importance of cell density in modulating ROS in cortical cells has been suggested in a recent study showing that ROS levels differ in sparse and dense cultures of adult hippocampal stem cells (Limoli et al., 2004). Taken together, our data demonstrate a functional role for ROS in the regulation of neuronal maturation and suggest mechanisms for their mode of actions.
Overall, our findings suggest that ROS production during normal development does not influence the probability of a cell to become a neuron but does affect aspects of neuronal maturation including morphology, physiology, and biochemistry. ROS have also been shown to influence cell and tissue morphology in a number of other systems. For example, ROS play an essential role in promoting vascular angiogenesis (reviewed in (Maulik, 2002)) and in directing polar growth in plants (Mori and Schroeder, 2004). Cell shape changes induced by integrin activation (Kheradmand et al., 1998) involved ROS (Werner and Werb, 2002) and, as noted above, neurite outgrowth in PC12 cells is mediated by ROS, particularly superoxide (Kamata et al., 1996; Katoh et al., 1997). A search for common mechanisms in these disparate systems may provide a useful link to the general role of ROS during development.
EXPERIMENTAL METHODS
Chemicals
Chemicals were purchased from Sigma-Aldrich (St. Louis, MO) unless otherwise noted. Primary antibodies were β III-tubulin (Sigma), GFAP (DAKO), O4 and calretinin (Chemicon). Secondary antibodies were from Invitrogen (Carlsbad, CA).
Brain Slices
Brains from late embryonic and postnatal rat pups were prepared as described (Desai and Walcott, 2006). E15 slices were embedded in ultralow temperature gelling agarose , Slices were incubated for 30 min in artificial cerebrospinal fluid (ACSF) containing 124mM NaCl, 3mM KCl, 1.25mM NaH2PO4, 2mM MgCl2, 2mM CaCl2 and 10mM dextrose, and transferred to ACSF containing 3μ M CM-H2DCF-DA (Invitrogen, Eugene, OR) and 0.05% DMSO for 25 min. Slices were returned to ACSF for 90 min prior to recording.
Primary cortical cultures
Primary cultures from E15 cortices were obtained as described (Tsatmali et al., 2005).
Cortices, including the rostral and caudal cortical plate and ventricular zone, but not hippocampus or striatum, were dissected from timed pregnant Wistar rats. For electrophysiological recordings, cells were seeded on glass coverslips coated with poly-L-lysine and laminin (50,000 cells per coverslip) and were treated with 50μ M cytosine arabinoside (AraC) for 4 days. After AraC treatment, over 97% of the cells were neuronal as assessed by β III tubulin staining.
Clonal neurospheres and clonal culture differentiation
Cells in primary cultures grown for 5 days were loaded with CM-H2DCF-DA and low ROS-expressing cells were isolated by FACS, as previously described (Tsatmali et al., 2005). Sorted cells were placed either as single cells in 96 well plates or at clonal density (2 cells per μ l of media) in uncoated 60 mm2 dishes with 5 ml NB + B27 medium and either FGF2 (20 ng/ml), EGF (20 ng/ml) or both factors together. Low-density culture results in clonal neurosphere colonies that arise from single cells and not as a result of cell aggregation (Tropepe et al., 2000), which was confirmed by microscopy. After 4–5 days, single neurospheres were placed in chamber slides (BD, Bedford, MA) coated with poly-L-lysine and laminin. Cells were grown in the presence of growth factors (GFs) for 5–6 days, after which medium without GFs was added and cultures were allowed to differentiate for 7 days.
ROS perturbations
Antioxidants were added in growth media lacking GFs. Half of the medium was removed every other day and fresh media with antioxidants was added up to the original volume. Bovine Cu/Zn SOD-PEG and bovine CAT-PEG were used at 100 U/ml and 50 U/ml, respectively. The SOD mimetic Mn (III) tetrakis (1-methyl-4-pyridyl) porphyrin pentachloride (MnTMPyP; EMD Biosciences) was used at 10μ M.
Live ROS imaging
Imaging of live cells for the detection of ROS was carried out as described (Tsatmali et al., 2005). Four to six fields from each culture were photographed using a 40x objective.
Immunofluorescent staining and imaging
Immunocytochemistry was carried out as described (Amoureux et al., 2000) with modifications. For staining with antibodies to cytoplasmic proteins, cells were incubated for 2 hours at room temperature (RT) with 5 % goat serum (GS) and 0.1 % Triton-X 100 (TX 100) in PBS, primary antibodies were added, and the cells were incubated at 4 ° C overnight. When antibodies against both membrane-bound and cytoplasmic proteins were tested together, cells were incubated in 5% GS for 2h at RT and the antibodies against the membrane bound antigens were added and left overnight at 4 ° C. The cells were permeabilized with 0.1 % TX 100 in solution of 5 % GS in PBS and the cytoplasmic antibodies were added for 2 hours at RT. Washes were done in PBS/0.1% TX 100, 5 min. each, and fluorescent secondary antibodies were added for 1 hour at RT. Nuclei were stained with DAPI and slides were mounted in Slowfade (Molecular Probes). Cells were imaged on a Zeiss Axioplan 2 microscope equipped with a Cooke Sensicam CCD camera (12-bit) and a mercury lamp. All components were controlled by the SlideBook software (Intelligent Imaging Innovations, Denver, CO). Images were acquired using a 40x or 63x objective. For determining the number of cells with specific phenotypes, 4–6 fields were photographed from each primary or clonal culture under identical exposure conditions.
Confocal microscopy
Images were acquired using the Bio-Rad (Zeiss) Radiance 2100 Rainbow laser scanning confocal microscope with the latest BioRad LaserSharp 2000 software. Selected images were processed for 3D animation, conceptual modeling, and colocalization using Imaris-Autoquant software (Bitplane Inc.).
Electrophysiology
Cells on coverslips or brain slices were placed in a submerged chamber mounted on an fixed-upright microscope (Leica DMLFSA, Nussloch, Germany) and continuously perfused with ACSF at 3 ml/min (31 ° C). Whole cell patches were obtained using pulled glass electrodes (4–5 MΩ ) filled with an intracellular solution containing: 110 mM K-gluconate, 10 mM KCl, 10 mM (Na) phosphocreatine, 10 mM HEPES, 0.5 mM EGTA, 4 mM (Mg)ATP, 0.3 mM (Na)GTP, and 0.1% w/v biocytin, adjusted with KOH to pH 7.4 and with sucrose to 290–300 mOsm. Signals were recorded using a Multiclamp 700A amplifier (Molecular Devices, Union City, CA), filtered at 4kHz and digitized at 10 kHz. Data were acquired with a 16-bit input-output board (National Instruments, Austin, TX) and analyzed with custom software written in Matlab (MathWorks, Natick, MA). Whole patch recordings in voltage and current clamp were made according to methods described in (Desai and Walcott, 2006). Cells were considered acceptable if input resistances were greater than 100 MΩ and membrane potentials were less than -50 mV. Images of cells were acquired using a 40X magnification objective and a Leica DMLFSA miscroscope equipped with infrared DIC optics and a DAGE-MTI infrared-sensitive camera, using WinTV2000 acquisition program (Hauppauge Computer Works, Hauppauge, NY).
Statistical analysis
Graph Pad Prism software was used to perform one-way analysis of variance. Dunnett’s multiple comparison test was used as a post hoc test to compare the means of treated and untreated cell populations.
Acknowledgments
The authors wish to thank Dr. Bill Kiosses for help with the confocal microscopy, the FACS Core Facility for advice and help with the FACS analyses, and Ms. Adrienne L. Myers for excellent technical support. We are grateful to Drs. Bruce Cunningham, Gerald M. Edelman, Joseph A. Gally, and Frederick S. Jones for their critical reading of the manuscript and helpful comments. This work was supported by a grant from the G. Harold and Leila Y. Mathers Foundation (KLC), the Skaggs Institute (MT), and the Neurosciences Research Foundation (HM and ECW). No conflicts of interest exist for any of the authors.
Footnotes
This is a PDF file of an unedited manuscript that has been accepted for publication. As a service to our customers we are providing this early version of the manuscript. The manuscript will undergo copyediting, typesetting, and review of the resulting proof before it is published in its final citable form. Please note that during the production process errors may be discovered which could affect the content, and all legal disclaimers that apply to the journal pertain.
References
- Aguirre J, Rios-Momberg M, Hewitt D, Hansberg W. Reactive oxygen species and development in microbial eukaryotes. Trends Microbiol. 2005;13:111–118. doi: 10.1016/j.tim.2005.01.007. [DOI] [PubMed] [Google Scholar]
- Amoureux MC, Cunningham BA, Edelman GM, Crossin KL. N-CAM binding inhibits the proliferation of hippocampal progenitor cells and promotes their differentiation to a neuronal phenotype. J Neurosci. 2000;20:3631–3640. doi: 10.1523/JNEUROSCI.20-10-03631.2000. [DOI] [PMC free article] [PubMed] [Google Scholar]
- Babior BM. The leukocyte NADPH oxidase. Isr Med Assoc J. 2002;4:1023–1024. [PubMed] [Google Scholar]
- Bayer SA, Altman J. Neurogenesis and Neuronal Migration. In: Paxinos G, editor. The Rat Nervous System. Academic Press; Sydney, Australia: 1995. pp. 1041–1078. [Google Scholar]
- Beckman JS, Minor RL, Jr, White CW, Repine JE, Rosen GM, Freeman BA. Superoxide dismutase and catalase conjugated to polyethylene glycol increases endothelial enzyme activity and oxidant resistance. J Biol Chem. 1988;263:6884–6892. [PubMed] [Google Scholar]
- Bindokas VP, Jordan J, Lee CC, Miller RJ. Superoxide production in rat hippocampal neurons: selective imaging with hydroethidine. J Neurosci. 1996;16:1324–1336. doi: 10.1523/JNEUROSCI.16-04-01324.1996. [DOI] [PMC free article] [PubMed] [Google Scholar]
- Boersma HH, Kietselaer BL, Stolk LM, Bennaghmouch A, Hofstra L, Narula J, Heidendal GA, Reutelingsperger CP. Past, present, and future of annexin A5: from protein discovery to clinical applications. J Nucl Med. 2005;46:2035–2050. [PubMed] [Google Scholar]
- Bossis G, Melchior F. Regulation of SUMOylation by Reversible Oxidation of SUMO Conjugating Enzymes. Mol Cell. 2006;21:349–357. doi: 10.1016/j.molcel.2005.12.019. [DOI] [PubMed] [Google Scholar]
- Bradke F, Dotti CG. Establishment of neuronal polarity: lessons from cultured hippocampal neurons. Curr Opin Neurobiol. 2000;10:574–581. doi: 10.1016/s0959-4388(00)00124-0. [DOI] [PubMed] [Google Scholar]
- del Rio JA, Martinez A, Fonseca M, Auladell C, Soriano E. Glutamate-like immunoreactivity and fate of Cajal-Retzius cells in the murine cortex as identified with calretinin antibody. Cereb Cortex. 1995;5:13–21. doi: 10.1093/cercor/5.1.13. [DOI] [PubMed] [Google Scholar]
- del Rio MR, DeFelipe J. Synaptic connections of calretinin-immunoreactive neurons in the human neocortex. J Neurosci. 1997;17:5143–5154. doi: 10.1523/JNEUROSCI.17-13-05143.1997. [DOI] [PMC free article] [PubMed] [Google Scholar]
- Deora AA, Win T, Vanhaesebroeck B, Lander HM. A redox-triggered ras-effector interaction. Recruitment of phosphatidylinositol 3'-kinase to Ras by redox stress. J Biol Chem. 1998;273:29923–29928. doi: 10.1074/jbc.273.45.29923. [DOI] [PubMed] [Google Scholar]
- Desai NS, Walcott EC. Synaptic bombardment modulates muscarinic effects in forelimb motor cortex. J Neurosci. 2006;26:2215–2226. doi: 10.1523/JNEUROSCI.4310-05.2006. [DOI] [PMC free article] [PubMed] [Google Scholar]
- Desikan R, Cheung MK, Bright J, Henson D, Hancock JT, Neill SJ. ABA, hydrogen peroxide and nitric oxide signalling in stomatal guard cells. J Exp Bot. 2004;55:205–212. doi: 10.1093/jxb/erh033. [DOI] [PubMed] [Google Scholar]
- Doetsch F. The glial identity of neural stem cells. Nat Neurosci. 2003;6:1127–1134. doi: 10.1038/nn1144. [DOI] [PubMed] [Google Scholar]
- Doetsch F, Caillé I, Lim DA, García-Verdugo JM, Alvarez-Buylla A. Subventricular zone astrocytes are neural stem cells in the adult mammalian brain. Cell. 1999;97:703–716. doi: 10.1016/s0092-8674(00)80783-7. [DOI] [PubMed] [Google Scholar]
- Doetsch F, Garcia-Verdugo JM, Alvarez-Buylla A. Cellular composition and three-dimensional organization of the subventricular germinal zone in the adult mammalian brain. J Neurosci. 1997;17:5046–5061. doi: 10.1523/JNEUROSCI.17-13-05046.1997. [DOI] [PMC free article] [PubMed] [Google Scholar]
- Doetsch F, Petreanu L, Caille I, Garcia-Verdugo JM, Alvarez-Buylla A. EGF converts transit-amplifying neurogenic precursors in the adult brain into multipotent stem cells. Neuron. 2002;36:1021–1034. doi: 10.1016/s0896-6273(02)01133-9. [DOI] [PubMed] [Google Scholar]
- Droge W. Free radicals in the physiological control of cell function. Physiol Rev. 2002;82:47–95. doi: 10.1152/physrev.00018.2001. [DOI] [PubMed] [Google Scholar]
- Faulkner KM, Liochev SI, Fridovich I. Stable Mn(III) porphyrins mimic superoxide dismutase in vitro and substitute for it in vivo. J Biol Chem. 1994;269:23471–23476. [PubMed] [Google Scholar]
- Finkel T. Oxygen radicals and signaling. Curr Opin Cell Biol. 1998;10:248–253. doi: 10.1016/s0955-0674(98)80147-6. [DOI] [PubMed] [Google Scholar]
- Finkel T. Oxidant signals and oxidative stress. Curr Opin Cell Biol. 2003;15:247–254. doi: 10.1016/s0955-0674(03)00002-4. [DOI] [PubMed] [Google Scholar]
- Foreman J, Demidchik V, Bothwell JH, Mylona P, Miedema H, Torres MA, Linstead P, Costa S, Brownlee C, Jones JD, Davies JM, Dolan L. Reactive oxygen species produced by NADPH oxidase regulate plant cell growth. Nature. 2003;422:442–446. doi: 10.1038/nature01485. [DOI] [PubMed] [Google Scholar]
- Gardner PR, Nguyen DD, White CW. Superoxide scavenging by Mn(II/III) tetrakis (1-methyl-4-pyridyl) porphyrin in mammalian cells. Arch Biochem Biophys. 1996;325:20–28. doi: 10.1006/abbi.1996.0003. [DOI] [PubMed] [Google Scholar]
- German DC, Ng MC, Liang CL, McMahon A, Iacopino AM. Calbindin-D28k in nerve cell nuclei. Neuroscience. 1997;81:735–743. doi: 10.1016/s0306-4522(97)00206-6. [DOI] [PubMed] [Google Scholar]
- Goldsmit Y, Erlich S, Pinkas-Kramarski R. Neuregulin induces sustained reactive oxygen species generation to mediate neuronal differentiation. Cell Mol Neurobiol. 2001;21:753–769. doi: 10.1023/A:1015108306171. [DOI] [PMC free article] [PubMed] [Google Scholar]
- Gotz M. Glial cells generate neurons--master control within CNS regions: developmental perspectives on neural stem cells. Neuroscientist. 2003;9:379–397. doi: 10.1177/1073858403257138. [DOI] [PubMed] [Google Scholar]
- Hancock JT, Desikan R, Neill SJ. Role of reactive oxygen species in cell signalling pathways. Biochem Soc Trans. 2001;29:345–350. doi: 10.1042/0300-5127:0290345. [DOI] [PubMed] [Google Scholar]
- Hanshaw RG, Smith BD. New reagents for phosphatidylserine recognition and detection of apoptosis. Bioorg Med Chem. 2005;13:5035–5042. doi: 10.1016/j.bmc.2005.04.071. [DOI] [PubMed] [Google Scholar]
- Hatanaka Y, Hisanaga S, Heizmann CW, Murakami F. Distinct migratory behavior of early- and late-born neurons derived from the cortical ventricular zone. J Comp Neurol. 2004;479:1–14. doi: 10.1002/cne.20256. [DOI] [PubMed] [Google Scholar]
- Heizmann CW. Parvalbumin, an intracellular calcium-binding protein; distribution, properties and possible roles in mammalian cells. Experientia. 1984;40:910–921. doi: 10.1007/BF01946439. [DOI] [PubMed] [Google Scholar]
- Hongpaisan J, Winters CA, Andrews SB. Strong calcium entry activates mitochondrial superoxide generation, upregulating kinase signaling in hippocampal neurons. J Neurosci. 2004;24:10878–10887. doi: 10.1523/JNEUROSCI.3278-04.2004. [DOI] [PMC free article] [PubMed] [Google Scholar]
- Hubbard MJ, McHugh NJ. Calbindin28kDa and calbindin30kDa (calretinin) are substantially localised in the particulate fraction of rat brain. FEBS Lett. 1995;374:333–337. doi: 10.1016/0014-5793(95)01135-2. [DOI] [PubMed] [Google Scholar]
- Kamata H, Hirata H. Redox regulation of cellular signalling. Cell Signal. 1999;11:1–14. doi: 10.1016/s0898-6568(98)00037-0. [DOI] [PubMed] [Google Scholar]
- Kamata H, Oka S, Shibukawa Y, Kakuta J, Hirata H. Redox regulation of nerve growth factor-induced neuronal differentiation of PC12 cells through modulation of the nerve growth factor receptor, TrkA. Arch Biochem Biophys. 2005;434:16–25. doi: 10.1016/j.abb.2004.07.036. [DOI] [PubMed] [Google Scholar]
- Kamata H, Tanaka C, Yagisawa H, Hirata H. Nerve growth factor and forskolin prevent H2O2-induced apoptosis in PC12 cells by glutathione independent mechanism. Neurosci Lett. 1996;212:179–182. doi: 10.1016/0304-3940(96)12806-8. [DOI] [PubMed] [Google Scholar]
- Kanaani J, Prusiner SB, Diacovo J, Baekkeskov S, Legname G. Recombinant prion protein induces rapid polarization and development of synapses in embryonic rat hippocampal neurons in vitro. J Neurochem. 2005;95:1373–1386. doi: 10.1111/j.1471-4159.2005.03469.x. [DOI] [PubMed] [Google Scholar]
- Katoh S, Mitsui Y, Kitani K, Suzuki T. Hyperoxia induces the differentiated neuronal phenotype of PC12 cells by producing reactive oxygen species. Biochem Biophys Res Commun. 1997;241:347–351. doi: 10.1006/bbrc.1997.7514. [DOI] [PubMed] [Google Scholar]
- Katoh S, Mitsui Y, Kitani K, Suzuki T. Hyperoxia induces the neuronal differentiated phenotype of PC12 cells via a sustained activity of mitogen-activated protein kinase induced by Bcl-2. Biochem J. 1999;338:465–470. [PMC free article] [PubMed] [Google Scholar]
- Kempermann G, Jessberger S, Steiner B, Kronenberg G. Milestones of neuronal development in the adult hippocampus. Trends Neurosci. 2004;27:447–452. doi: 10.1016/j.tins.2004.05.013. [DOI] [PubMed] [Google Scholar]
- Kheradmand F, Werner E, Tremble P, Symons M, Werb Z. Role of Rac1 and oxygen radicals in collagenase-1 expression induced by cell shape change. Science. 1998;280:898–902. doi: 10.1126/science.280.5365.898. [DOI] [PubMed] [Google Scholar]
- Kietselaer BL, Hofstra L, Dumont EA, Reutelingsperger CP, Heidendal GA. The role of labeled Annexin A5 in imaging of programmed cell death. From animal to clinical imaging. Q J Nucl Med. 2003;47:349–361. [PubMed] [Google Scholar]
- Kirkland RA, Franklin JL. Bax, reactive oxygen, and cytochrome c release in neuronal apoptosis. Antioxid Redox Signal. 2003;5:589–596. doi: 10.1089/152308603770310257. [DOI] [PubMed] [Google Scholar]
- Klann E, Thiels E. Modulation of protein kinases and protein phosphatases by reactive oxygen species: implications for hippocampal synaptic plasticity. Prog Neuro-Psychopharmacol Biol Psychiatry. 1999;23:359–376. doi: 10.1016/s0278-5846(99)00002-0. [DOI] [PubMed] [Google Scholar]
- Knapp LT, Klann E. Role of reactive oxygen species in hippocampal long-term potentiation: contributory or inhibitory? J Neurosci Res. 2002;70:1–7. doi: 10.1002/jnr.10371. [DOI] [PubMed] [Google Scholar]
- Krantic S, Mechawar N, Reix S, Quirion R. Molecular basis of programmed cell death involved in neurodegeneration. Trends Neurosci. 2005;28:670–676. doi: 10.1016/j.tins.2005.09.011. [DOI] [PubMed] [Google Scholar]
- Kuan CY, Flavell RA, Rakic P. Programmed cell death in mouse brain development. Results Probl Cell Differ. 2000;30:145–162. doi: 10.1007/978-3-540-48002-0_6. [DOI] [PubMed] [Google Scholar]
- Kubota Y, Hattori R, Yui Y. Three distinct subpopulations of GABAergic neurons in rat frontal agranular cortex. Brain Res. 1994;649:159–173. doi: 10.1016/0006-8993(94)91060-x. [DOI] [PubMed] [Google Scholar]
- Kwak JM, I, Mori C, Pei ZM, Leonhardt N, Torres MA, Dangl JL, Bloom RE, Bodde S, Jones JD, Schroeder JI. NADPH oxidase AtrbohD and AtrbohF genes function in ROS-dependent ABA signaling in Arabidopsis. Embo J. 2003;22:2623–2633. doi: 10.1093/emboj/cdg277. [DOI] [PMC free article] [PubMed] [Google Scholar]
- Lee JY, Chang MY, Park CH, Kim HY, Kim JH, Son H, Lee YS, Lee SH. Ascorbate-induced differentiation of embryonic cortical precursors into neurons and astrocytes. J Neurosci Res. 2003;73:156–165. doi: 10.1002/jnr.10647. [DOI] [PubMed] [Google Scholar]
- Lendahl U, Zimmerman LB, McKay RD. CNS stem cells express a new class of intermediate filament protein. Cell. 1990;60:585–595. doi: 10.1016/0092-8674(90)90662-x. [DOI] [PubMed] [Google Scholar]
- Limoli CL, Rola R, Giedzinski E, Mantha S, Huang TT, Fike JR. Cell-density-dependent regulation of neural precursor cell function. Proc Natl Acad Sci U S A. 2004;101:16052–16057. doi: 10.1073/pnas.0407065101. [DOI] [PMC free article] [PubMed] [Google Scholar]
- Liochev SL. The role of iron-sulfur clusters in in vivo hydroxyl radical production. Free Radic Res. 1996;25:369–384. doi: 10.3109/10715769609149059. [DOI] [PubMed] [Google Scholar]
- Luhmann HJ, Hanganu I, Kilb W. Cellular physiology of the neonatal rat cerebral cortex. Brain Res Bull. 2003;60:345–353. doi: 10.1016/s0361-9230(03)00059-5. [DOI] [PubMed] [Google Scholar]
- Maric D, Maric I, Chang YH, Barker JL. Prospective cell sorting of embryonic rat neural stem cells and neuronal and glial progenitors reveals selective effects of basic fibroblast growth factor and epidermal growth factor on self-renewal and differentiation. J Neurosci. 2003;23:240–251. doi: 10.1523/JNEUROSCI.23-01-00240.2003. [DOI] [PMC free article] [PubMed] [Google Scholar]
- Maulik N. Redox signaling of angiogenesis. Antioxid Redox Signal. 2002;4:805–815. doi: 10.1089/152308602760598963. [DOI] [PubMed] [Google Scholar]
- Moldovan L, Irani K, Moldovan NI, Finkel T, Goldschmidt-Clermont PJ. The actin cytoskeleton reorganization induced by Rac1 requires the production of superoxide. Antioxid Redox Signal. 1999;1:29–43. doi: 10.1089/ars.1999.1.1-29. [DOI] [PubMed] [Google Scholar]
- Mori IC, Schroeder JI. Reactive oxygen species activation of plant Ca2+ channels. A signaling mechanism in polar growth, hormone transduction, stress signaling, and hypothetically mechanotransduction. Plant Physiol. 2004;135:702–708. doi: 10.1104/pp.104.042069. [DOI] [PMC free article] [PubMed] [Google Scholar]
- Morrison SJ, Csete M, Groves AK, Melega W, Wold B, Anderson DJ. Culture in reduced levels of oxygen promotes clonogenic sympathoadrenal differentiation by isolated neural crest stem cells. J Neurosci. 2000;20:7370–7376. doi: 10.1523/JNEUROSCI.20-19-07370.2000. [DOI] [PMC free article] [PubMed] [Google Scholar]
- Muller S, Hoege C, Pyrowolakis G, Jentsch S. SUMO, ubiquitin's mysterious cousin. Nat Rev Mol Cell Biol. 2001;2:202–210. doi: 10.1038/35056591. [DOI] [PubMed] [Google Scholar]
- Nadarajah B, Alifragis P, Wong RO, Parnavelas JG. Neuronal migration in the developing cerebral cortex: observations based on real-time imaging. Cereb Cortex. 2003;13:607–611. doi: 10.1093/cercor/13.6.607. [DOI] [PubMed] [Google Scholar]
- Noctor SC, Martinez-Cerdeno V, Ivic L, Kriegstein AR. Cortical neurons arise in symmetric and asymmetric division zones and migrate through specific phases. Nat Neurosci. 2004;7:136–144. doi: 10.1038/nn1172. [DOI] [PubMed] [Google Scholar]
- Oppenheim RW. Cell death during development of the nervous system. Annu Rev Neurosci. 1991;14:453–501. doi: 10.1146/annurev.ne.14.030191.002321. [DOI] [PubMed] [Google Scholar]
- Pauls TL, Cox JA, Berchtold MW. The Ca2+(−)binding proteins parvalbumin and oncomodulin and their genes: new structural and functional findings. Biochim Biophys Acta. 1996;1306:39–54. doi: 10.1016/0167-4781(95)00221-9. [DOI] [PubMed] [Google Scholar]
- Picken Bahrey HL, Moody WJ. Early development of voltage-gated ion currents and firing properties in neurons of the mouse cerebral cortex. J Neurophysiol. 2003;89:1761–1773. doi: 10.1152/jn.00972.2002. [DOI] [PubMed] [Google Scholar]
- Puceat M. Role of Rac-GTPase and Reactive Oxygen Species in Cardiac Differentiation of Stem Cells. Antioxid Redox Signal. 2005;7:1435–1439. doi: 10.1089/ars.2005.7.1435. [DOI] [PubMed] [Google Scholar]
- Qian X, Davis AA, Goderie SK, Temple S. FGF2 concentration regulates the generation of neurons and glia from multipotent cortical stem cells. Neuron. 1997;18:81–93. doi: 10.1016/s0896-6273(01)80048-9. [DOI] [PubMed] [Google Scholar]
- Rego AC, Oliveira CR. Mitochondrial dysfunction and reactive oxygen species in excitotoxicity and apoptosis: implications for the pathogenesis of neurodegenerative diseases. Neurochem Res. 2003;28:1563–1574. doi: 10.1023/a:1025682611389. [DOI] [PubMed] [Google Scholar]
- Reynolds BA, Weiss S. Generation of neurons and astrocytes from isolated cells of the adult mammalian central nervous system. Science. 1992;255:1707–1710. doi: 10.1126/science.1553558. [DOI] [PubMed] [Google Scholar]
- Rhee SG. Redox signaling: hydrogen peroxide as intracellular messenger. Exp Mol Med. 1999;31:53–59. doi: 10.1038/emm.1999.9. [DOI] [PubMed] [Google Scholar]
- Rietze RL, Valcanis H, Brooker GF, Thomas T, Voss AK, Bartlett PF. Purification of a pluripotent neural stem cell from the adult mouse brain. Nature. 2001;412:736–739. doi: 10.1038/35089085. [DOI] [PubMed] [Google Scholar]
- Royall JA, Ischiropoulos H. Evaluation of 2',7'-dichlorofluorescin and dihydrorhodamine 123 as fluorescent probes for intracellular H2O2 in cultured endothelial cells. Arch Biochem Biophys. 1993;302:348–355. doi: 10.1006/abbi.1993.1222. [DOI] [PubMed] [Google Scholar]
- Ruthel G, Hollenbeck PJ. Growth cones are not required for initial establishment of polarity or differential axon branch growth in cultured hippocampal neurons. J Neurosci. 2000;20:2266–2274. doi: 10.1523/JNEUROSCI.20-06-02266.2000. [DOI] [PMC free article] [PubMed] [Google Scholar]
- Sauer H, Wartenberg M. Reactive Oxygen Species as Signaling Molecules in Cardiovascular Differentiation of Embryonic Stem Cells and Tumor-Induced Angiogenesis. Antioxid Redox Signal. 2005;7:1423–1434. doi: 10.1089/ars.2005.7.1423. [DOI] [PubMed] [Google Scholar]
- Schwamborn JC, Fiore R, Bagnard D, Kappler J, Kaltschmidt C, Puschel AW. Semaphorin 3A stimulates neurite extension and regulates gene expression in PC12 cells. J Biol Chem. 2004;279:30923–30926. doi: 10.1074/jbc.C400082200. [DOI] [PubMed] [Google Scholar]
- Scott EK, Reuter JE, Luo L. Small GTPase Cdc42 is required for multiple aspects of dendritic morphogenesis. J Neurosci. 2003;23:3118–3123. doi: 10.1523/JNEUROSCI.23-08-03118.2003. [DOI] [PMC free article] [PubMed] [Google Scholar]
- Smith J, Ladi E, Mayer-Proschel M, Noble M. Redox state is a central modulator of the balance between self-renewal and differentiation in a dividing glial precursor cell. Proc Natl Acad Sci U S A. 2000;97:10032–10037. doi: 10.1073/pnas.170209797. [DOI] [PMC free article] [PubMed] [Google Scholar]
- Studer L, Csete M, Lee SH, Kabbani N, Walikonis J, Wold B, McKay R. Enhanced proliferation, survival, and dopaminergic differentiation of CNS precursors in lowered oxygen. J Neurosci. 2000;20:7377–7383. doi: 10.1523/JNEUROSCI.20-19-07377.2000. [DOI] [PMC free article] [PubMed] [Google Scholar]
- Suzukawa K, Miura K, Mitsushita J, Resau J, Hirose K, Crystal R, Kamata T. Nerve growth factor-induced neuronal differentiation requires generation of Rac1-regulated reactive oxygen species. J Biol Chem. 2000;275:13175–13178. doi: 10.1074/jbc.275.18.13175. [DOI] [PubMed] [Google Scholar]
- Terman JR, Mao T, Pasterkamp RJ, Yu HH, Kolodkin AL. MICALs, a family of conserved flavoprotein oxidoreductases, function in plexin-mediated axonal repulsion. Cell. 2002;109:887–900. doi: 10.1016/s0092-8674(02)00794-8. [DOI] [PubMed] [Google Scholar]
- Tramontin AD, Garcia-Verdugo JM, Lim DA, Alvarez-Buylla A. Postnatal development of radial glia and the ventricular zone (VZ): a continuum of the neural stem cell compartment. Cereb Cortex. 2003;13:580–587. doi: 10.1093/cercor/13.6.580. [DOI] [PubMed] [Google Scholar]
- Tropepe V, Coles BL, Chiasson BJ, Horsford DJ, Elia AJ, McInnes RR, van der Kooy D. Retinal stem cells in the adult mammalian eye. Science. 2000;287:2032–2036. doi: 10.1126/science.287.5460.2032. [DOI] [PubMed] [Google Scholar]
- Tropepe V, Sibilia M, Ciruna BG, Rossant J, Wagner EF, van der Kooy D. Distinct neural stem cells proliferate in response to EGF and FGF in the developing mouse telencephalon. Dev Biol. 1999;208:166–188. doi: 10.1006/dbio.1998.9192. [DOI] [PubMed] [Google Scholar]
- Tsatmali M, Walcott EC, Crossin KL. Newborn neurons acquire high levels of reactive oxygen species and increased mitochondrial proteins upon differentiation from progenitors. Brain Res. 2005;1040:137–150. doi: 10.1016/j.brainres.2005.01.087. [DOI] [PubMed] [Google Scholar]
- Turrens JF. Mitochondrial formation of reactive oxygen species. J Physiol. 2003;552:335–344. doi: 10.1113/jphysiol.2003.049478. [DOI] [PMC free article] [PubMed] [Google Scholar]
- Uchida N, Buck DW, He D, Reitsma MJ, Masek M, Phan TV, Tsukamoto AS, Gage FH, Weissman IL. Direct isolation of human central nervous system stem cells. Proc Natl Acad Sci USA. 2000;97:14720–14725. doi: 10.1073/pnas.97.26.14720. [DOI] [PMC free article] [PubMed] [Google Scholar]
- Vignais PV. The superoxide-generating NADPH oxidase: structural aspects and activation mechanism. Cell Mol Life Sci. 2002;59:1428–1459. doi: 10.1007/s00018-002-8520-9. [DOI] [PMC free article] [PubMed] [Google Scholar]
- Weisenhorn DM, Prieto EW, Celio MR. Localization of calretinin in cells of layer I (Cajal-Retzius cells) of the developing cortex of the rat. Brain Res Dev Brain Res. 1994;82:293–297. doi: 10.1016/0165-3806(94)90171-6. [DOI] [PubMed] [Google Scholar]
- Werner E, Werb Z. Integrins engage mitochondrial function for signal transduction by a mechanism dependent on Rho GTPases. J Cell Biol. 2002;158:357–368. doi: 10.1083/jcb.200111028. [DOI] [PMC free article] [PubMed] [Google Scholar]
- Wolf G. Role of reactive oxygen species in angiotensin II-mediated renal growth, differentiation, and apoptosis. Antioxid Redox Signal. 2005;7:1337–1345. doi: 10.1089/ars.2005.7.1337. [DOI] [PubMed] [Google Scholar]
- Xu Q, de la Cruz E, Anderson SA. Cortical interneuron fate determination: diverse sources for distinct subtypes? Cereb Cortex. 2003;13:670–676. doi: 10.1093/cercor/13.6.670. [DOI] [PubMed] [Google Scholar]