Abstract
We cloned, expressed, and purified the hdeB gene product, which belongs to the hdeAB acid stress operon. We extracted HdeB from bacteria by the osmotic-shock procedure and purified it to homogeneity by ion-exchange chromatography and hydroxyapatite chromatography. Its identity was confirmed by mass spectrometry analysis. HdeB has a molecular mass of 10 kDa in sodium dodecyl sulfate-polyacrylamide gel electrophoresis, which matches its expected molecular mass. We purified the acid stress chaperone HdeA in parallel in order to compare the two chaperones. The hdeA and hdeB mutants both display reduced viability upon acid stress, and only the HdeA/HdeB expression plasmid can restore their viability to close to the wild-type level, suggesting that both proteins are required for optimal protection of the bacterial periplasm against acid stress. Periplasmic extracts from both mutants aggregate at acidic pH, suggesting that HdeA and HdeB are required for protein solubilization. At pH 2, the aggregation of periplasmic extracts is prevented by the addition of HdeA, as previously reported, but is only slightly reduced by HdeB. At pH 3, however, HdeB is more efficient than HdeA in preventing periplasmic-protein aggregation. The solubilization of several model substrate proteins at acidic pH supports the hypothesis that, in vitro, HdeA plays a major role in protein solubilization at pH 2 and that both proteins are involved in protein solubilization at pH 3. Like HdeA, HdeB exposes hydrophobic surfaces at acidic pH, in accordance with the appearance of its chaperone properties at acidic pH. HdeB, like HdeA, dissociates from dimers at neutral pH into monomers at acidic pHs, but its dissociation is complete at pH 3 whereas that of HdeA is complete at a more acidic pH. Thus, we can conclude that Escherichia coli possesses two acid stress chaperones that prevent periplasmic-protein aggregation at acidic pH.
In their natural habitats, bacteria are constantly under assault from a wide array of environmental stresses, including UV, heat, oxidative, osmotic, and pH stresses (5). One of the most frequently encountered is acid stress (8). Enterobacteria, when traveling through the gastrointestinal tract, encounter an extremely low pH; facultative intracellular pathogens tolerate episodes of low pH within macrophage phagolysosomes, and fermentative bacteria excrete acidic fermentation products that trigger endogenous acid stress (5, 17).
In response to acid stress, several mechanisms regulate the homeostasis of bacterial cytoplasmic pH. Many bacteria, including Escherichia coli, possess amino acid (glutamate, arginine, or lysine) decarboxylase systems, each of which consists of a cytoplasmic decarboxylase, which converts its substrate into a related amine (γ-aminobutyric acid, agmatine, or cadaverine, respectively), and an antiporter, which exchanges the imported amino acid for the cytoplasmic amine produced (5, 8, 12, 21, 24). These systems consume one cytoplasmic proton during amino acid decarboxylation and one extracytoplasmic proton during protonation of the exported amine, thus leading to cytoplasmic and periplasmic alkalinization. In several bacteria, including fermentative bacteria, such as Lactococcus lactis, the proton-translocating F1F0 ATPase can export protons as a consequence of ATP hydrolysis (26). Further protection against acid stress is obtained by decreasing the permeability of the inner and outer membranes to protons; several inner and outer membrane proteins are overexpressed in response to acid stress, including the cyclopropane fatty acyl phospholipid synthase, OmpC, the lipopolysaccharide biosynthesis enzyme YfbF, and the outer membrane lipoprotein Slp (26). Furthermore, bacteria can reverse their cytoplasmic membrane potentials to an inside-positive potential that slows the influx of protons into the cell (8, 21). They can also reorient their metabolism toward pathways that decrease proton production or increase amine production, with a consequent alkalinization (underexpression of catabolic sugar enzymes, such as those of the maltose regulon) (27) that decreases the production of organic acids, and overexpression of urease increases ammonia production in Helicobacter pylori (2, 7). Moreover, several protective proteins may be induced upon acid stress, including the DnaK and GroEL chaperone machines (17) and several DNA repair enzymes (25).
The acid resistance mechanisms of the periplasm are not as well understood as those of the cytoplasm. Periplasmic proteins are probably more vulnerable than cytoplasmic proteins to acid stress, due to the relative permeability of the outer membrane porins to molecules smaller than 600 Da (15, 23). Recently, a periplasmic chaperone, HdeA, which plays a role in acid resistance in E. coli, was discovered (9, 14). HdeA exhibits chaperone-like activity at strong acidic pH only (below pH 3), preventing the acid-induced aggregation of bacterial periplasmic extracts and of several model substrate proteins, such as alcohol dehydrogenase (ADH), glyceraldehyde-3-phosphate dehydrogenase (GAPDH), and the periplasmic ribose receptor (14).
In this study, we report the cloning, purification, and characterization of HdeB as a novel acid stress chaperone and we show that, in vivo, both HdeA and HdeB are required for protein solubilization at acidic pH, while in vitro, HdeA is more efficient than HdeB at pH 2 and HdeB is more efficient than HdeA at pH 3.
MATERIALS AND METHODS
Bacterial strains, plasmids, and growth conditions.
The E. coli strain BL21(DE3) (Novagen) was used for the transformation of the new expression vector constructs containing the genes encoding HdeB and HdeA, respectively. We generated the genes coding for HdeB and HdeA by amplifying the hdeB and hdeA genes from E. coli genomic DNA (from strain MG1655) by PCR using the forward primers 5′GGTGGTTGCTCTTCACATATGAATATTTCATCTCTC-3′ for hdeB and 5′GGTGGTTGCTCTTCACATATGAAAAAAGTATTAGGC-3′ for hdeA, containing an NdeI site, and the reverse primers 5′GGTGGTCTGGGATCCTCATTAATTCGGCAAGTCATT-3′ for hdeB and 5′GGTGGTCTGGAATCCTCATCATTACATATCTTTCTYTAAT-3′ for hdeA, containing a BamHI site. The whole hdeAB operon was generated by PCR using the hdeA forward primer and the hdeB reverse primer. The PCR was done in a volume of 50 μl in the presence of 0.5 μg of template DNA, 1 μg (each) of forward and reverse primers, and 5 units of Taq DNA polymerase (Applied Biosystems) for 35 cycles (1 min at 94°C, 2 min at 58°C, and 2 min at 72°C), followed by a final cycle (1 min at 94°C, 2 min at 58°C, and 10 min at 72°C). The resulting products were digested with NdeI and BamHI, ligated to the pET-21a (Novagen) NdeI and BamHI backbone fragment, and transformed into strain BL21(DE3). The sequences of the cloned genes were confirmed by DNA sequencing (not shown).
Construction of the hdeA and hdeB mutants.
We achieved the one-step inactivation of the hdeA and hdeB genes using the phage λ recombination (Red) system (4). The strategy is analogous to the PCR-based gene deletion method in yeast, except that we used E. coli cells carrying an easily curable, low-copy-number plasmid based on plasmid pSC101 (a replication-temperature-sensitive derivative), pKD46, carrying the λ Red recombinase genes expressing the Red system. The basic strategy was to replace a chromosomal sequence with a selectable antibiotic resistance gene that was generated by PCR by using primers with 50-nucleotide extensions homologous to the adjacent upstream or downstream flanking regions of the target gene and 20-nucleotide 3′ ends for the amplification of the kanamycin (kan) resistance gene. This replacement was achieved by λ Red-mediated recombination in these flanking homologies (4). Strain BW25113 [lacIq rrnB3 ΔlacZ4787 hsdR514 Δ(araBAD)567 Δ(rhaBAD)568 rph-1] was used as the parent for construction of the hdeA and hdeB mutants. The construction of the hdeA and hdeB disruption mutants was part of the systematic construction of E. coli single-gene deletion mutants (1). The amounts of HdeA and HdeB in the hdeA- and hdeB-deficient mutants, and in those mutants complemented with pBAD vectors (see below), were evaluated by one- or two-dimensional gel electrophoresis of osmotic-shock fluids prepared from the strains.
Construction of pBAD vectors.
Construction of pBAD vectors for in vivo expression of HdeA and HdeB in the hdeA- and hdeB-deficient strains was done as follows. The hdeA gene, the hdeB gene, and the hdeAB operon were excised from the pET-21a-hdeA, pET-21a-hdeB, and pET-21a-hdeAB vectors using XbaI and HindIII and ligated to the pBAD33 XbaI and HindIII backbone fragment (pBAD33 is a pACYC184-derived vector containing the PBAD promoter of the araBAD operon and the gene encoding the regulator of this promoter, araC) (11). The pBAD vectors were induced with 0.05% arabinose.
Preparation of bacterial extracts and purification of HdeA and HdeB.
The HdeA- and HdeB-overproducing strains BL21(DE3) pET-21a-hdeA and BL21(DE3) pET-21a-hdeB were grown at 37°C in 1 liter of Luria-Bertani medium (19) supplemented with ampicillin (50 μg/ml) to an optical density at 600 nm of 0.5. HdeA and HdeB overexpression was induced with 1 mM IPTG (isopropyl-β-d-thiogalactopyranoside), and growth was continued for 3 h. The cells were harvested by centrifugation at 4°C. The cell pellets were resuspended in 10 ml of 30 mM Tris, pH 8.0, 20 mM NaCl, 1 mM dithiothreitol (DTT), 0.5 mM EDTA, and bacterial periplasmic extracts were prepared according to the osmotic-shock procedure described previously (13). HdeA and HdeB were each loaded onto a DEAE-Sephacel column equilibrated in 30 mM Tris, pH 8.0, 1 mM DTT at 20°C and eluted with a linear gradient of 0 to 0.5 M NaCl in the same buffer. Fractions were analyzed by sodium dodecyl sulfate-polyacrylamide gel electrophoresis (SDS-PAGE) and quantified by the Bradford assay. Purified fractions of HdeB and HdeA were loaded onto a hydroxyapatite column (Bio-Gel HTP; Bio-Rad); equilibrated at 20°C in 30 mM Tris, pH 7.5, 1 mM DTT; and eluted with a linear gradient of 0 to 50 mM sodium phosphate, pH 7.5, in the same buffer. HdeA and HdeB were stored at −70°C. For experiments at acidic pH, HdeA and HdeB were equilibrated in distilled water by gel permeation on a Bio-Gel P10 column equilibrated in water (Bio-Rad). We performed electrophoresis according to the method of Laemmli, using 16% polyacrylamide gels (Bio-Rad) with Coomassie blue staining (16). All the experiments showing polyacrylamide gels (see Fig. 2 to 5) were repeated at least three times, leading to similar results. We used NIH Image 1.62 software (http://rsb.info.nih.gov/nih-image/download.html) to quantify protein bands on polyacrylamide gels.
FIG. 2.
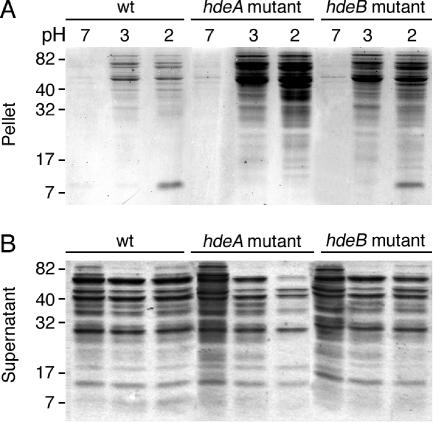
Acid-induced aggregation of periplasmic extracts. SDS-PAGE analyses of the pellet (A) and supernatant (B) fractions of periplasmic extracts (20 μg each) from the hdeA mutant, the hdeB mutant, and their parent after an acid treatment at pH 2 or at pH 3 for 60 min (a control was done at pH 7).
FIG. 5.
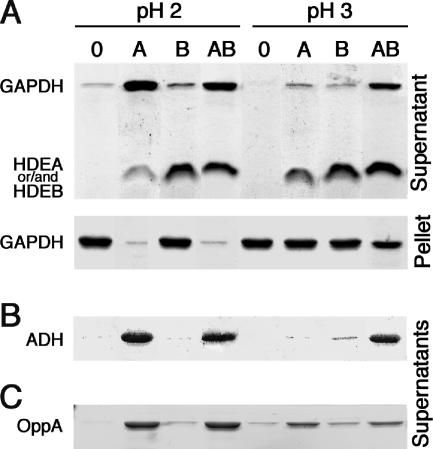
Solubilization of GAPDH, ADH, and OppA at acidic pH. (A) SDS-PAGE analyses of the supernatant and pellet fractions of GAPDH (10 μg) that were subjected to treatment for 60 min at pH 3 or 2, either alone or in the presence of (5 μg each) HdeA, HdeB, or both. (B) SDS-PAGE analyses of the supernatant fractions of ADH (10 μg) that were subjected to treatment for 60 min at pH 3 or 2, either alone or in the presence of (5 μg each) HdeA, HdeB, or both. (C) SDS-PAGE analyses of the supernatant fractions of OppA (10 μg) that were subjected to treatment for 60 min at pH 3 or 2, either alone or in the presence of (5 μg each) HdeA, HdeB, or both. The molecular masses (monomeric forms) of HdeA, HdeB, GAPDH, ADH, and OppA were 10 kDa, 9 kDa, 36 kDa, 36 kDa, and 61 kDa, respectively.
Mass spectrometric identification of HdeA and HdeB.
Excised HdeA and HdeB gel bands were in-gel digested with mass spectrometry grade trypsin (Roche). Mass spectra were recorded in the positive ion reflection mode of a matrix-assisted laser desorption ionization-time of flight Voyager DE PRO (Applied Biosystems). The peptide masses obtained were searched against the E. coli database (PIR; National Biomedical Research Foundation) with the Mascot engine available online.
Chaperone assays.
The chaperone activities of HdeA and HdeB were assayed by incubating periplasmic extracts or model substrate proteins for 60 min at 25°C in the presence of HdeA and/or HdeB at acidic pH and monitoring the appearance of the proteins in the 15,000 × g pellet or supernatant (proteins were analyzed by SDS-PAGE) (14). Sulfate was used as the anion in order to achieve effective aggregation of substrate proteins at low pH (10, 14).
Assay of ANS binding to HdeA and HdeB.
Using a Kontron SFM 25 fluorescence spectrophotometer, we monitored the binding of 1-anilino-8-naphthalenesulfonate (ANS) (100 μM) to HdeA or HdeB (7 μM) by measuring the increase in the fluorescence intensity of ANS at 25°C upon its binding to the protein. Samples were excited at 395 nm, with emission recorded between 400 and 600 nm. Fluorescence readings were made for triplicate samples.
Oligomeric forms of HdeA and HdeB.
The molecular masses of HdeA and HdeB were determined by filtration of the proteins on a TSK G-2000-SW high-performance liquid chromatography (HPLC) gel permeation column (Hewlett-Packard). Blue dextran (2 MDa), yellow dextran (20,000 Da), cytochrome c (12,500 Da), and vitamin B12 (1,382 Da) were used as molecular mass standards. For experiments at pH 7.5, the column was equilibrated in 20 mM Tris, pH 7.5, 100 mM NaCl at 20°C; loaded with 20 μl of protein (2.4 mg/ml); and eluted at a flow rate of 0.5 ml/min. For experiments at pH 3 and pH 2, the column was equilibrated with 150 mM Na2SO4 adjusted to these pHs with sulfuric acid. Proteins were detected by their absorbance at 280 nm. When both proteins were loaded onto the column, they were detected by SDS-PAGE (on an 18% acrylamide gel).
Acid stress sensitivities of the hdeA and hdeB mutants and of the mutants complemented by plasmids pBAD33-hdeA, pBAD33-hdeB, and pBAD33-hdeAB.
Mutant and parental strains were grown in LB medium containing 0.05% arabinose for 24 h at 37°C with aeration in the presence of the required antibiotics. They were diluted to 106 bacteria per ml and incubated for 90 min in acidified LB medium (pH 2 or 3) at 37°C under aeration (9). A control was done at pH 7. Survival patterns were determined by plating the bacteria overnight on LB agar plates at pH 7.
Reagents.
Restriction enzymes were from Invitrogen, and the plasmid extraction kit was from QIAGEN. ADH (from rabbit muscle; 36 kDa) and GAPDH (from Saccharomyces cerevisiae; 36 kDa) were from Sigma, and OppA was purified as described by Richarme and Caldas (22). All other chemicals were from Sigma and were reagent grade.
RESULTS
Expression and purification of HdeA and HdeB.
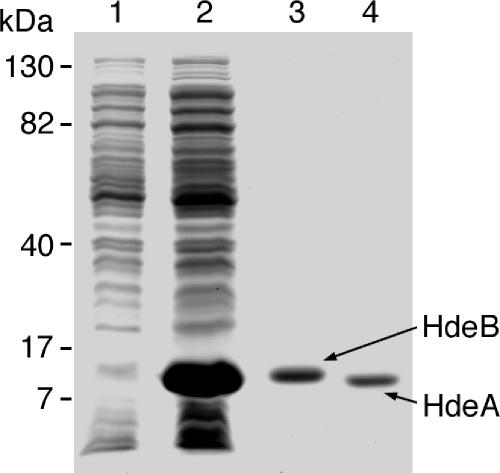
The BL21(DE3) strain, transformed with the recombinant expression vector pET-21a-hdeB, was induced for 3 h with 1 mM IPTG, and its periplasmic extract was prepared by a modification (13) of the osmotic-shock procedure of Nossal and Heppel (20). The HdeB-overproducing strain accumulated a periplasmic protein migrating in SDS-PAGE with an apparent molecular mass of 10 kDa, which matched the expected HdeB molecular mass of 9 kDa (after processing of the signal sequence) (Fig. 1, lane 2). The overexpressed protein represented 29% by mass of the proteins in the induced periplasmic extract. HdeB was purified as described in Materials and Methods by two chromatographic steps on a DEAE-Sephacel column and a hydroxyapatite column (Fig. 1, lane 3), and its identity was confirmed by mass spectrometry (not shown). We purified HdeA from the pET-21a-hdeA strain, using the same osmotic-shock procedure and chromatographic steps as for HdeB (Fig. 1, lane 4), and confirmed its identity by mass spectrometry (not shown).
FIG. 1.
Purification of HdeA and HdeB. Protein samples were separated by sodium dodecyl sulfate-polyacrylamide gels (16%) and stained with Coomassie brilliant blue. Lane 1, periplasmic extract from uninduced strain BL21(DE3) pET-21a-hdeB; lane 2, periplasmic extract from BL21(DE3) pET-21a-hdeB induced for 3 h with IPTG; lane 3, 5 μg of purified HdeB; lane 4, 5 μg of purified HdeA. The positions of molecular mass markers are indicated on the left.
Acid-induced aggregation of periplasmic extracts from the hdeA and hdeB mutants.
Periplasmic-protein extracts are relatively resistant to acid-induced aggregation (18), and the acid stress chaperone HdeA contributes to this resistance (9, 14). We investigated the acid-induced aggregation of periplasmic extracts from the hdeA and hdeB mutants and their parent by analyzing pellets and supernatants after an acidic treatment at pH 2 or pH 3 for 60 min. The wild-type extract displayed a moderate amount of protein aggregation at acidic pH (Fig. 2A). In contrast, a massive amount of protein aggregation was observed at both pHs in periplasmic extracts from the hdeA mutant, as reported previously (14), and from the hdeB mutant. Conversely, a smaller quantity of proteins from the two mutants (compared to their parent) remained in the supernatant at these acidic pHs (Fig. 2B). For both mutants, protein aggregation was more extensive at pH 2 than at pH 3 and for the hdeA periplasmic extract than for the hdeB extract. Furthermore, the proteins that appeared to aggregate in periplasmic extracts from both mutants were similar. A fraction of HdeA (characterized by N-terminal sequencing) was found in the pellets at pH 2 (slightly above the 7-kDa marker shown in Fig. 3A, except in the HdeA-deficient extract). At pH 7, there was no significant protein aggregation, suggesting that HdeA and HdeB do not function as neutral-pH chaperones.
FIG. 3.
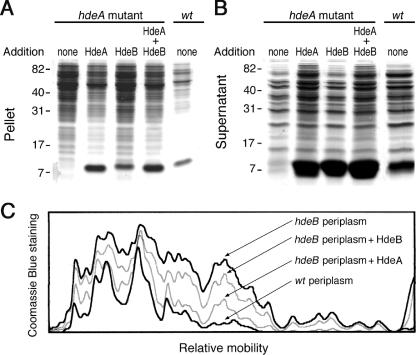
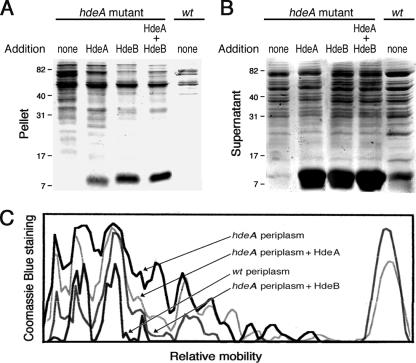
Prevention of periplasmic-protein aggregation at pH 2. Shown are SDS-PAGE analyses of the pellet (A) and supernatant (B) fractions of periplasmic extracts (20 μg) from the hdeA mutant and its parental strain after incubation for 60 min at pH 2, either alone or in the presence of purified (15 μg each) HdeA, HdeB, or both (7.5 μg each). (C) Densitometric scan of the protein distributions of periplasmic extracts from the wild-type (wt) strain and the hdeB mutant (not shown in panel A) supplemented with HdeA or HdeB, as indicated. We checked that the intensities of the protein bands (excluding the HdeA/B bands) in pellets and supernatants added up to similar amounts in all cases.
The two mutants display strong protein aggregation at both pH 2 and pH 3, but in vitro, HdeA and HdeB are mainly involved in periplasmic-protein solubilization at pH 2 and pH 3, respectively (see below). We checked the expression levels of HdeA and HdeB in each mutant. Our two-dimensional gel electrophoresis analysis (performed as described previously [17]) of periplasmic extracts from the hdeA and hdeB mutants showed that HdeA and HdeB were both undetectable in the hdeA mutant (which consequently behaved like an hdeAB mutant) and that HdeB was undetectable in the hdeB mutant, while HdeA was expressed at around 24% of the wild-type level (not shown). The null expression of the two chaperones in the hdeA mutant explains its aggregation phenotype at pH 2 and pH 3. The aggregation phenotype of the hdeB mutant cannot be explained by its low HdeA level, since complementation of the mutant by the PBAD HdeA expression plasmid (the complemented strain expresses HdeA at a level that is 148% of that of the wild type) did not significantly modify its aggregation behavior (not shown).
HdeA is more efficient than HdeB in preventing periplasmic-protein aggregation at pH 2.
Periplasmic extracts from the parental strain and from the hdeA and hdeB mutants, either alone or supplemented with purified HdeA, HdeB, or both, were incubated at pH 2 for 60 min, and their 15,000 × g pellets and supernatants were analyzed. As reported above, protein aggregation at pH 2 increased in extracts from both mutants. The addition of HdeA decreased the aggregation of the hdeA (Fig. 3A) and hdeB (Fig. 3C) extracts, whereas the addition of HdeB was much less efficient. HdeA and HdeB together were no more efficient than HdeA alone. For the different periplasmic extracts, a large quantity of protein in the supernatant fraction (Fig. 3B) corresponded to a small quantity in the pellet (Fig. 3A), and vice versa. Most of HdeA and HdeB remained in the supernatant. We quantified the aggregated proteins in the hdeB mutant extract and in its wild-type control using NIH Image 1.62 software (Fig. 3C). The profile of the HdeB-supplemented extract was only slightly different from that of the unsupplemented extract, whereas the profile of the HdeA-supplemented extract approached that of the parental-strain extract. These results are consistent with the hypothesis that, in vitro, HdeA is the main chaperone involved in protein solubilization at pH 2. The important role of HdeA in preventing protein aggregation at pH 2 has already been discussed (9, 14).
HdeB is more efficient than HdeA in preventing periplasmic-protein aggregation at pH 3.
Periplasmic extracts from the parental strain and from the hdeA and hdeB mutants, either alone or supplemented with HdeA, HdeB, or both, were incubated at pH 3 for 60 min, and their 15,000 × g pellet and supernatant were analyzed. As reported above, there was strong protein aggregation in extracts from both mutants. HdeA decreased the aggregation of the hdeA (Fig. 4A) and hdeB (not shown) extracts, but HdeB was much more efficient than HdeA. HdeA and HdeB together were no more efficient than HdeB alone. For the different periplasmic extracts, a large quantity of protein in the supernatant fraction (Fig. 4B) corresponded to a small quantity in the pellet, and vice versa. We quantified the aggregated proteins in the hdeA mutant extract and in its wild-type control (Fig. 4A) using NIH Image 1.62 software (Fig. 4C). The protein profiles of the HdeA- and HdeB-supplemented extracts reflected the greater efficiency of HdeB in solubilizing periplasmic proteins at pH 3. These results are consistent with the hypothesis that HdeB is the main chaperone for periplasmic-protein solubilization at pH 3 and clarify the poor efficiency of the HdeA chaperone at pH 3 (reference 14 and this study). These results, together with those presented above, suggest that, to achieve the solubilization in vitro of periplasmic extracts (the natural substrates of HdeA and HdeB), the task is divided between the two chaperones, with HdeA being involved in protein solubilization mainly at pH 2 and HdeB mainly at pH 3. In vivo experiments, however, suggest that both HdeA and HdeB are required for optimal protection of bacteria against acid stress at either pH 3 or pH 2 (see below).
FIG. 4.
Prevention of periplasmic-protein aggregation at pH 3. (A and B) SDS-PAGE analyses of pellet (A) and supernatant (B) fractions of periplasmic extracts (20 μg) from the hdeA mutant and its parental strain after incubation for 60 min at pH 3, either alone or in the presence of purified (15 μg each) HdeA, HdeB, or both (7.5 μg each). (B) Densitometric scan of protein distributions of periplasmic extracts from the wild-type (wt) strain and the hdeA mutant supplemented with HdeA or HdeB, as indicated. We checked that the intensities of the protein bands (excluding the HdeA/B bands) in pellets and supernatants added up to similar amounts in all cases.
Solubilization of model substrate proteins at pH 2 and pH 3.
We examined the aggregation-suppressing functions of HdeA and HdeB, using two usual substrates of chaperone activity assays, ADH and GAPDH, and the periplasmic oligopeptide receptor OppA. Protein aggregation was monitored by analysis of 15,000 × g supernatants and pellets after the incubation of these proteins at acidic pHs in the absence or presence of chaperones. In the absence of chaperones, GAPDH remained in the supernatant at pH 7 and 4 (not shown), but not at pH 3 and 2 (Fig. 5A). At pH 2, HdeA increased the fraction of soluble GAPDH from 12% to 81%, whereas HdeB had only a weak effect and HdeA and HdeB together were no more efficient than HdeA alone. At pH 3, HdeA and HdeB separately increased the fraction of soluble GAPDH from 1% to 12% and 8%, respectively, whereas HdeA and HdeB together solubilized up to 55% of GAPDH, suggesting that synergy occurs between the two chaperones for the solubilization of the substrate protein to take place. For each experiment, the amounts of GAPDH found in the supernatant and the pellet were additive (in all of the following experiments, the initial amount of each substrate protein was quantitatively recovered in the supernatant and pellet fractions).
Experiments similar to that shown in Fig. 5A were performed with ADH and OppA. For ADH solubilization, HdeA, but not HdeB, was efficient at pH 2 (98% solubilization); at pH 3, HdeA or HdeB alone was relatively inefficient (less than 10% solubilization), whereas HdeA and HdeB together solubilized up to 68% of the protein (Fig. 5B). For OppA, HdeA solubilized 95% and 52% of the protein at pH 2 and pH 3, respectively, whereas HdeB solubilized 14% and 25% of OppA; the addition of both proteins at the same time was not significantly more efficient than HdeA alone (Fig. 5C). These results are consistent with the hypotheses that HdeA makes a major contribution to the solubilization of model proteins at pH 2, that the efficiency of each chaperone is variable for protein solubilization at pH 3, and that synergy between the two chaperones occurs to enable the solubilization of the two cytoplasmic proteins tested at pH 3 (ADH and GAPDH) to take place.
HdeB exposes surfaces that are less hydrophobic than those of HdeA at acidic pHs.
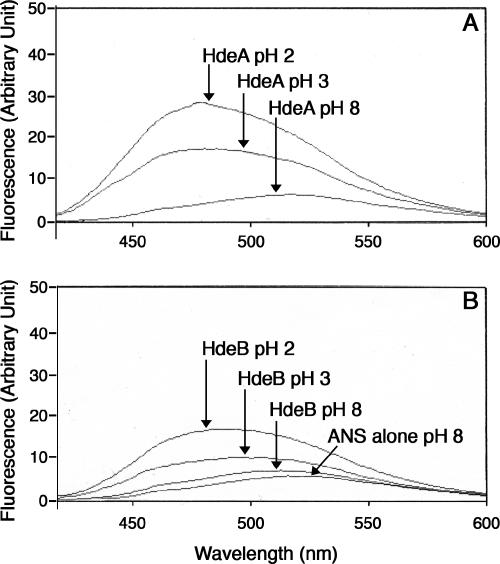
It is generally believed that molecular chaperones interact with their unfolded substrate proteins via hydrophobic interactions. HdeA exposes hydrophobic surfaces at acidic pH, but not at neutral pH, in accordance with the appearance of its chaperone activity at acidic pHs (14). We measured the fluorescence emission of the hydrophobic probe ANS in the presence of HdeA or HdeB at different pHs. As shown in Fig. 6, ANS binding to HdeA and HdeB was negligible at pH 8 and increased at pH 3 and pH 2 (ANS fluorescence was stronger at pH 2 than at pH 3 and stronger with HdeA than with HdeB). Furthermore, the blue shifts of ANS fluorescence were similar for both chaperones at pH 2 (around 30 nm) but lower for HdeB (11 nm) than for HdeA (35 nm) at pH 3. This suggests that the surface of HdeB is less hydrophobic than that of HdeA, especially at pH 3. Such a difference in the exposed hydrophobicities of the two chaperones might explain their different chaperone properties described above, and the combination of both chaperones, in certain circumstances, might be required for the optimal handling of unfolded proteins.
FIG. 6.
ANS fluorescence of HdeB and HdeA at neutral and acidic pHs. The intensities of ANS fluorescence (100 μM in H2SO4 solution at pH 2 or pH 3 or in 10 mM Tris, pH 8) in the presence of 7 μM HdeA or 7 μM HdeB were measured after excitation at 395 nm.
Monomerization of HdeB at acidic pH.
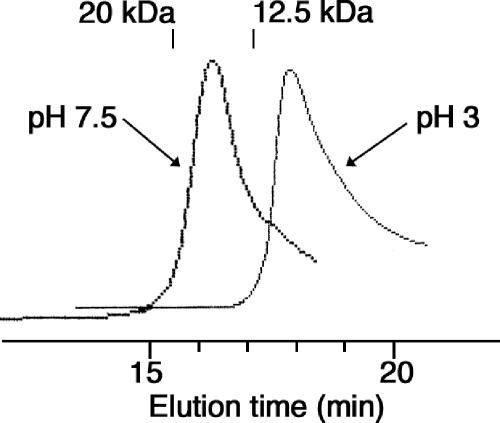
HdeB was analyzed by size exclusion chromatography on an SW G-2000 HPLC column, as described in Materials and Methods. At pH 7.5, HdeB (loaded at 2.4 mg/ml) migrated as a dimer with an apparent molecular mass of around 16,000 Da (Fig. 7), whereas at both pH 3 (Fig. 7) and pH 2 (not shown), it migrated as a monomer (9,000 Da). At pH 7.5, HdeA (loaded at 2.4 mg/ml) migrated as a dimer, as previously reported (14), with an apparent molecular mass of around 17,000 Da (not shown), whereas at pH 3 it migrated as a mixture of monomers and dimers (with an apparent molecular mass of around 14,000 Da) and at pH 2 as a monomer (10,000 Da) (not shown), as reported previously (14). Thus, like HdeA, HdeB dissociates from dimers to monomers at acidic pHs, but whereas the dissociation of HdeB is complete at pH 3, that of HdeA is not. This difference might explain why HdeB is a more efficient chaperone than HdeA at pH 3.
FIG. 7.
Oligomeric forms of HdeB at neutral and acidic pHs. For experiments at pH 7.5, the column was equilibrated in 20 mM Tris, pH 7.5, 100 mM NaCl at 20°C; loaded with 20 μl of HdeB (2.4 mg/ml); and eluted at a flow rate of 0.5 ml/min. For experiments at pH 3 and pH 2, the column was equilibrated with 150 mM Na2SO4 adjusted to these pHs with sulfuric acid and loaded with 20 μl of HdeB and/or HdeA (2.4 mg/ml each) equilibrated at the pH of the column. Proteins were detected by their absorbance at 280 nm. Blue dextran (2 MDa), yellow dextran (20,000 Da), cytochrome c (12,500 Da), and vitamin B12 (1,382 Da) were used as molecular mass standards.
We also checked whether HdeA and HdeB form a complex at pH 3. When a mixture of HdeA and HdeB (2.4 mg/ml each) was loaded onto the SW G-2000 HPLC column equilibrated at pH 3, HdeA migrated (as it does when alone) as a mixture of monomers and dimers with an apparent molecular mass of around 14,000 Da, and HdeB migrated (as it does when alone) as a monomer of around 9,000 Da (not shown).
Acid stress sensitivities of the hdeA and hdeB mutants and of the mutants complemented by pBAD33-hdeA, pBAD33-hdeB, and pBAD33-hdeAB.
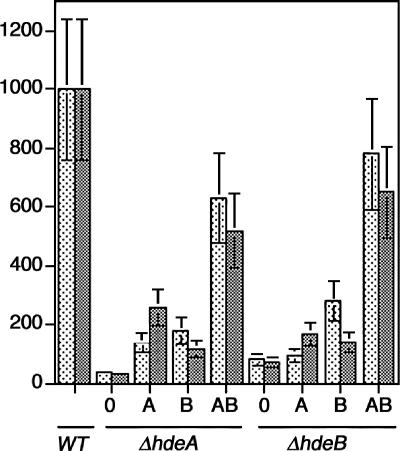
Cultures of the mutants and of their parent were incubated for 90 min at 37°C at either pH 2 or pH 3 (a control was done at pH 7), as described in Materials and Methods, and their survival patterns were observed on LB plates at pH 7. The hdeA mutant, which contains neither HdeA nor HdeB (see above), displayed 4% and 3% survival rates at pH 3 and pH 2, respectively. The HdeB mutant, which contains a reduced amount of HdeA (24% of the wild-type level [see above]) and no HdeB, displayed 8% and 7% survival rates at pH 3 and pH 2, respectively (Fig. 8). This suggests that both genes are required for resistance of E. coli to these acidic pHs (the involvement of hdeA in E. coli resistance at pH 2 has been reported [9]). However, since the hdeA mutant expresses neither HdeA nor HdeB and since the hdeB mutant expresses 24% of the wild-type level of HdeA, in order to determine the respective contribution of each chaperone to acid stress resistance, we complemented these mutants with pBAD vectors expressing HdeA and/or HdeB under the control of the arabinose PBAD promoter.
FIG. 8.
Acid stress sensitivities of the hdeA and hdeB mutants and of those mutants complemented with plasmids pBAD33-hdeA, pBAD33-hdeB, and pBAD33-hdeAB. The mutants, either uncomplemented (0) or complemented with pBAD33-hdeA (A), pBAD33-hdeB (B), or pBAD33-hdeAB (AB), and their parent were subjected to acid stress in LB medium adjusted to pH 3 (stippled bars) or pH 2 (shaded bars) for 90 min at 37°C, as described in Materials and Methods, and survival patterns were determined by plating the bacteria overnight on LB agar plates at pH 7. The results are the averages ± standard errors of the mean of three experiments. The colony counts of the mutants were normalized to those of the parental strain. All of the strains displayed similar viabilities at pH 7.
The viability of the hdeA mutant complemented with pBAD33-hdeA (this strain contains HdeA [140% of the wild-type level], but no HdeB) increased to 12% (a threefold increase) and 18% (a sixfold increase) after the pH 3 and pH 2 stresses, respectively. This suggests that HdeA alone affords some protection in vivo against acid stresses at these pHs.
The viability of the hdeA mutant complemented with pBAD33-hdeB (this strain contains HdeB [175% of the wild-type level] but no HdeA) increased to 16% (a fourfold increase) and 11% (a fourfold increase) after the pH 3 and pH 2 stresses, respectively. This suggests that HdeB alone affords moderate protection of bacteria against acid stresses at these pHs.
The viability of the hdeB mutant complemented with pBAD33-hdeA (this strain contains HdeA [148% of the wild-type level] but no HdeB) increased to 9% and 16% after the pH 3 and pH 2 stresses, respectively. These viabilities are not very different (especially at pH 3) from those of the unsupplemented hdeB mutant (8% and 7%, respectively). Importantly, this suggests that the low viability of the uncomplemented hdeB mutant is not a consequence of its reduced HdeA level (25% of the level of the parental strain) but results from an HdeB deficiency.
The viability of the hdeB mutant expressing the hdeB plasmid (this strain contains HdeA [28% of the wild-type level] and 125% of the wild-type HdeB level) increased to 28% and 18% after the pH 3 and pH 2 stresses, respectively.
The viabilities of the hdeA and hdeB mutants expressing the hdeAB plasmid attained 50 to 75% of the wild-type level, suggesting that the PBAD expression system sufficiently complemented the strains deficient in acid stress chaperones.
In short, these viability experiments suggest that both HdeA and HdeB are required for optimal protection of bacteria against acid stress in vivo at either pH 3 or pH 2 (especially since the hdeA- and the hdeB-deficient strains displayed lower viability when complemented with a single chaperone than when complemented with both chaperones).
DISCUSSION
We cloned, overexpressed, purified, and characterized HdeB as a novel acid stress chaperone. HdeB was found in the periplasm in a soluble form. It was purified by osmotic shock, followed by two chromatographic steps on DEAE-Sephacel and hydroxyapatite columns, and identified by matrix-assisted laser desorption ionization-time of flight mass spectrometry. We purified HdeA in parallel in order to compare the two chaperones.
A periplasmic extract from the hdeB mutant aggregated at pH 2 and pH 3, like an extract from the hdeA mutant (9). The aggregation defect of the hdeB mutant did not result from the lower expression (24% of the wild-type level) of HdeA, since complementation of this mutant by the HdeA expression plasmid did not rescue its aggregation defect. Thus, HdeB is important for the solubility of the bacterial periplasm at acidic pH.
At pH 2, HdeA is the main chaperone involved in the in vitro solubilization of periplasmic extracts and of the model substrate proteins used in our study (the chaperone properties of HdeA at a pH around 2 have been described by others [9, 14]). HdeB is much less efficient than HdeA in solubilizing periplasmic extracts at pH 2, and its best performance at this pH was the 25% solubilization of OppA. Furthermore, HdeB did not increase the efficiency of HdeA at pH 2.
At pH 3, HdeB solubilizes periplasmic extracts more efficiently than HdeA. It can prevent the aggregation of periplasmic extracts in the absence of HdeA and thus functions as an acid stress chaperone by itself. HdeA or HdeB, separately, are relatively inefficient in solubilizing GAPDH and ADH (less than 10% of these proteins were solubilized), and there is functional synergy between them (leading to 52% and 68% solubilization of GAPDH and ADH, respectively). The occurrence of synergy between HdeA and HdeB seems to depend on the particular substrate protein used (the synergy observed for the solubilization of the cytoplasmic proteins ADH and GAPDH is not obvious for that of OppA) or on chaperone/substrate ratios (at lower chaperone concentrations, we also observed some synergy between HdeA and HdeB for the solubilization of periplasmic extracts at pH 3 [unpublished results]).
Like HdeA, HdeB displays more hydrophobic surfaces at acidic pHs than at neutral pH, as judged from ANS fluorescence spectra. The surface of HdeB, however, appears less hydrophobic than that of HdeA, and such a difference might explain their respective roles in the renaturation of unfolded proteins.
Like HdeA, HdeB dissociates from dimers at neutral pH to monomers at acidic pHs. The dissociation of HdeB into monomers, however, is complete at pH 3, whereas that of HdeA is not. The easier dissociation of HdeB into monomers possibly explains its better chaperone properties at pH 3. Although HdeA and HdeB appear to cooperate in the solubilization of several protein substrates at pH 3, we could not detect the formation of a stable heterodimer between the two chaperones at this pH.
An hdeB-deficient strain, like an hdeA-deficient strain (9), displays increased sensitivity to acid stress at pH 2 and pH 3 (and its sensitivity to acid stress is not a consequence of its reduced HdeA level), suggesting that HdeB, like HdeA, is involved in resistance to acid stress. In vivo, there seems to be a requirement for both chaperones for optimal resistance of bacteria to acid stresses at either pH 3 or pH 2, in accordance with their coexpression from the same operon. This contrasts somewhat with results obtained in vitro, suggesting that HdeA is more efficient at pH 2 and HdeB at pH 3. In fact, there are many differences between the in vivo and in vitro situations, including differences in protein concentrations and in the physicochemical properties of the medium.
HdeA and HdeB are general chaperones (like DnaK, GroEL, small Hsps, and periplasmic chaperones that also function as general chaperones) (3, 6), since they reduce the aggregation of many different periplasmic proteins. Furthermore, whereas HdeA and HdeB display different pH specificities in vitro (pH 2 for HdeA and pH 3 for HdeB), they solubilize roughly the same proteins, since the profile of aggregated proteins at pH 2 in the presence of HdeA is similar to that of aggregated proteins at pH 3 in the presence of HdeB. Finally, the hdeA and hdeB mutants do not present a protein aggregation phenotype at neutral pH, suggesting that HdeA and HdeB are not involved in protein solubilization at neutral pH (this has been reported for HdeA [14]). Computational and structural experiments will allow us to understand further the different specificities of these two chaperones, which have been developed by enterobacteria to prevent periplasmic-protein aggregation at acidic pH.
Acknowledgments
We thank Hirotada Mori (Nara Institute of Sciences and Technology, Nara, Japan) for the construction of the hdeA- and hdeB-disrupted strain, Teresa Caldas for her help during the early course of this work, Jean-Jacques Montagne for mass spectrometry analysis, Catherine Dubucs for two-dimensional gel electrophoresis, Antonia Kropfinger for correction of the English language, and Myriam Barre for her help in the preparation of the manuscript.
Footnotes
Published ahead of print on 3 November 2006.
REFERENCES
- 1.Baba, T., T. Ara, Y. Okumura, M. Hasegawa, Y. Takai, M. Baba, K. A. Datsenko, T. Oshima, M. Tomita, B. L. Wanner, and H. Mori. 2006. Construction of Escherichia coli K-12 in frame, single-gene knock out mutants, the Keio collection. Mol. Syst. Biol. doi: 10.1038/msb4100050. [DOI] [PMC free article] [PubMed]
- 2.Booth, I. R., P. Cash, and C. O'Byrne. 2002. Sensing and adapting to acid stress. Antonie Leeuwenhoek 81:33-42. [DOI] [PubMed] [Google Scholar]
- 3.Bukau, B., and A. L. Horwich. 1998. The Hsp70 and Hsp60 chaperone machines. Cell 92:351-366. [DOI] [PubMed] [Google Scholar]
- 4.Datsenko, K. A., and B. L. Wanner. 2000. One-step inactivation of chromosomal genes in Escherichia coli K-12 using PCR products. Proc. Natl. Acad. Sci. USA 97:6640-6644. [DOI] [PMC free article] [PubMed] [Google Scholar]
- 5.De Angelis, M., and M. Gobbetti. 2004. Environmental stress responses in Lactobacillus: a review. Proteomics 4:106-122. [DOI] [PubMed] [Google Scholar]
- 6.Duguay, A. R., and T. J. Silhavy. 2004. Quality control in the bacterial periplasm. Biochim. Biophys. Acta 1694:121-134. [DOI] [PubMed] [Google Scholar]
- 7.Ferrero, R. L., V. Cussac, P. Courcoux, and A. Labigne. 1992. Construction of isogenic urease-negative mutants of Helicobacter pylori by allelic exchange. J. Bacteriol. 174:4212-4217. [DOI] [PMC free article] [PubMed] [Google Scholar]
- 8.Foster, J. W. 2004. Escherichia coli acid resistance: tales of an amateur acidophile. Nat. Rev. Microbiol. 2:898-907. [DOI] [PubMed] [Google Scholar]
- 9.Gajiwala, K. S., and S. K. Burley. 2000. HdeA, a periplasmic protein that supports acid resistance in pathogenic enteric bacteria. J. Mol. Biol. 295:605-612. [DOI] [PubMed] [Google Scholar]
- 10.Goto, Y., and A. L. Fink. 1989. Conformational states of beta-lactamase: molten-globule states at acidic and alkaline pH with high salt. Biochemistry 28:945-952. [DOI] [PubMed] [Google Scholar]
- 11.Guzman, L. M., D. Belin, M. J. Carson, and J. Beckwith. 1995. Tight regulation, modulation, and high-level expression by vectors containing the arabinose PBAD promoter. J. Bacteriol. 177:4121-4130. [DOI] [PMC free article] [PubMed] [Google Scholar]
- 12.Hersh, B. M., F. T. Farooq, D. N. Barstad, D. L. Blankenhorn, and J. L. Slonczewski. 1996. A glutamate-dependent acid resistance gene in Escherichia coli. J. Bacteriol. 178:3978-3981. [DOI] [PMC free article] [PubMed] [Google Scholar]
- 13.Higgins, C. F., and M. M. Hardie. 1983. Periplasmic protein associated with the oligopeptide permeases of Salmonella typhimurium and Escherichia coli. J. Bacteriol. 155:1434-1438. [DOI] [PMC free article] [PubMed] [Google Scholar]
- 14.Hong, W., W. Jiao, J. Hu, J. Zhang, C. Liu, X. Fu, D. Shen, B. Xia, and Z. Chang. 2005. Periplasmic protein HdeA exhibits chaperone-like activity exclusively within stomach pH range by transforming into disordered conformation. J. Biol. Chem. 280:27029-27034. [DOI] [PubMed] [Google Scholar]
- 15.Koebnik, R., K. P. Locher, and P. Van Gelder. 2000. Structure and function of bacterial outer membrane proteins: barrels in a nutshell. Mol. Microbiol. 37:239-253. [DOI] [PubMed] [Google Scholar]
- 16.Laemmli, U. K. 1972. Cleavage of structural proteins during the assembly of the head of bacteriophage T4. Nature 227:680-685. [DOI] [PubMed] [Google Scholar]
- 17.Lim, E. M., S. D. Ehrlich, and E. Maguin. 2000. Identification of stress-inducible proteins in Lactobacillus delbrueckii subsp. bulgaricus. Electrophoresis 21:2557-2561. [DOI] [PubMed] [Google Scholar]
- 18.Liu, Y., X. Fu, X. J. Shen, H. Zhang, W. Hong, and Z. Chang. 2004. Periplasmic proteins of Escherichia coli are highly resistant to aggregation: reappraisal for roles of molecular chaperones in periplasm. Biochem. Biophys. Res. Commun. 316:795-801. [DOI] [PubMed] [Google Scholar]
- 19.Miller, J. H. 1972. Experiments in molecular genetics, p. 421. Cold Spring Harbor Laboratory, Cold Spring Harbor, NY.
- 20.Nossal, N. G., and L. A. Heppel. 1966. The release of enzymes by osmotic shock from Escherichia coli in exponential phase. J. Biol. Chem. 241:3055-3062. [PubMed] [Google Scholar]
- 21.Richard, H., and J. W. Foster. 2004. Escherichia coli glutamate- and arginine-dependent acid resistance systems increase internal pH and reverse transmembrane potential. J. Bacteriol. 186:6032-6041. [DOI] [PMC free article] [PubMed] [Google Scholar]
- 22.Richarme, G., and T. D. Caldas. 1997. Chaperone properties of the bacterial periplasmic substrate-binding proteins. J. Biol. Chem. 272:15607-15612. [DOI] [PubMed] [Google Scholar]
- 23.Schirmer, T. 1998. General and specific porins from bacterial outer membranes. J. Struct. Biol. 121:101-109. [DOI] [PubMed] [Google Scholar]
- 24.Small, P. L., and S. R. Waterman. 1998. Acid stress, anaerobiosis and gadCB: lessons from Lactococcus lactis and Escherichia coli. Trends Microbiol. 6:214-216. [DOI] [PubMed] [Google Scholar]
- 25.Thompson, S. A., and M. J. Blaser. 1995. Isolation of the Helicobacter pylori recA gene and involvement of the recA region in resistance to low pH. Infect. Immun. 63:2185-2193. [DOI] [PMC free article] [PubMed] [Google Scholar]
- 26.Tucker, D. L., N. Tucker, and T. Conway. 2002. Gene expression profiling of the pH response in Escherichia coli. J. Bacteriol. 184:6551-6558. [DOI] [PMC free article] [PubMed] [Google Scholar]
- 27.Yohannes, E., D. M. Barnhart, and J. L. Slonczewski. 2004. pH-dependent catabolic protein expression during anaerobic growth of Escherichia coli K-12. J. Bacteriol. 186:192-199. [DOI] [PMC free article] [PubMed] [Google Scholar]


