Abstract
During acute and early human immunodeficiency virus type 1 (HIV-1) infection (AEI) more than 50% of CD4+ T cells are preferentially depleted from the gastrointestinal (GI) lamina propria. To better understand the underlying mechanisms, we studied virological and immunological events within the peripheral blood (PB) and GI tract during AEI. A total of 32 AEI subjects and 18 uninfected controls underwent colonic biopsy. HIV-1 viral DNA and RNA levels were quantified in CD4+ T cells derived from the GI tract and PB by using real-time PCR. The phenotype of infected cells was characterized by using combinations of immunohistochemistry and in situ hybridization. Markers of immunological memory, activation, and proliferation were examined by flow cytometry and immunohistochemistry, and the host-derived cytotoxic cellular response was examined by using immunohistochemistry. GI CD4+ T cells harbored, on average, 13-fold higher HIV-1 viral DNA levels and 10-fold higher HIV-1 RNA levels than PB CD4+ T cells during AEI. HIV-1 RNA was detected in both “activated” and “nonactivated” mucosal CD4+ T cells. A significantly higher number of activated and proliferating T cells were detected in the GI tract compared to the PB, and a robust cytotoxic response (HIV-1 specificity not determined) was detected in the GI tract as early as 18 days postinfection. Mucosal CD4+ T-cell depletion is multifactorial. Direct viral infection likely accounts for the earliest loss of CD4+ T cells. Subsequently, ongoing infection of susceptible CD4+ T cells, along with activation-induced cellular death and host cytotoxic cellular response, are responsible for the persistence of the lesion.
A preferential depletion of more than half of gastrointestinal (GI) CD4+ T cells has been documented during acute and early human immunodeficiency virus type 1 (HIV-1) infection (3, 8, 18), echoing the observations made in the simian immunodeficiency virus (SIV)-macaque model of acute infection (30). The mechanisms underlying this lesion have been explored recently in the SIV model, where Mattapallil et al., using PCR, demonstrated that at peak viremia (10 days postinfection) 30 to 60% of memory T cells throughout the body (including the GI tract) are infected by SIV and suggested that direct viral cytopathicity is responsible for CD4+ T-cell depletion in the intestines (17). Contemporaneously, Li et al. (16) suggested that the effects of direct viral infection alone could not account for the magnitude of GI CD4+ T-cell loss, since only 7% of GI CD4+ T cells were found to contain HIV-1 RNA. These researchers based their findings on in situ hybridization as opposed to PCR-based techniques, which may account for the observed difference. Nevertheless, they found that SIV infection triggers Fas-Fas-ligand-mediated apoptosis in lamina propria CD4+ T cells and concluded that direct viral cytopathicity and indirect effects such as apoptosis of infected and uninfected CD4+ T cells are both involved in the pathogenesis of mucosal CD4+ T-cell depletion.
Studying the pathogenesis of CD4+ T-cell depletion in the human GI tract during acute HIV-1 infection is challenging. In our experience it is difficult to identify and biopsy human subjects prior to or at peak HIV-1 viremia. Sample availability is often limited, and inferences must be drawn by collecting snapshots of a very dynamic process. We have attempted to circumvent some of these problems by rigorously examining a relatively large cohort of acute and early HIV-1 infection (AEI) subjects, some of whom were identified as early as 18 to 19 days postinfection. These patients are, to our knowledge, among the earliest identified, diagnosed, and biopsied.
Compared to the well-characterized changes in the peripheral blood (PB) during acute and early infection, early events in the GI tract remain less well defined, and significant controversies exist. For example, using Ki67 as a marker of cellular proliferation, some groups have demonstrated an increase in lymphocyte proliferation in the GI tract (8), whereas others have not (3). Similarly, some reports have suggested that there are defects in cytotoxic cellular machinery within the GI tract during acute (2) and chronic (1, 25) HIV-1 infection, whereas others could not confirm these findings in the simian model (22, 27, 28).
The aims of the present study were to understand the virological and immunological factors involved in GI CD4+ T-cell depletion during AEI by (i) quantifying and comparing HIV-1 DNA and mRNA levels in the GI tract and PB; (ii) examining markers of immunological memory, activation, and proliferation in GI and PB compartments of AEI subjects and HIV-uninfected controls; and (iii) examining and comparing host-derived cytotoxic cellular responses in subjects with AEI and HIV-1-uninfected controls.
We compared the relative viral burden in the GI tract and PB by using precise, high-speed flow sorting to obtain CD4+ T cells. We quantified HIV-1 viral DNA and RNA levels at a cellular level. To study virology and associated immunologic sequelae, combinations of immunohistochemistry, in situ hybridization, and flow cytometry were used. In doing so, we sought to better understand important aspects of HIV-1 pathogenesis, some of which may be amenable to therapeutic or preventive interventions.
MATERIALS AND METHODS
Patients and sample acquisition.
PB and rectosigmoid colonic mucosal tissue were collected from HIV-1-infected and uninfected subjects. A total of 32 subjects with acute and early HIV-1 infection and 18 uninfected subjects were studied. On presentation, the patients were all viremic and were staged according to the National Institutes of Health-sponsored Acute and Early Disease Research Program (AIEDRP) as follows: enzyme-linked immunosorbent assay (ELISA) negative (stage Ia), Western blot indeterminate (stage Ib), or a nonreactive detuned ELISA result (12) with an optical density (OD) of <0.5 or a documented negative ELISA result within 3 months of presentation (stage II), and a nonreactive detuned ELISA (OD = 0.51 to 1.0) or a documented negative serology within 6 months of presentation (stage III). All were male patients who contracted HIV-1 sexually during same-sex contact.
The 18 HIV-1-uninfected subjects were recruited from a population undergoing screening colonoscopy at the time of study recruitment. This group comprised of 10 men and 8 women. None of the HIV-1-infected or uninfected subjects were found to have macroscopic evidence of GI mucosal disease, nor were any concomitant pathological processes found on histological examination. All enrolled subjects signed an informed consent form that was approved by the institutional review boards of The Rockefeller University, Bellevue Hospital Center, and Manhattan Veteran's Administration Center. Informed consent was obtained from all patients, and the study was approved by the Institutional Review Boards of the Rockefeller University, Bellevue Hospital Center, and Manhattan Veteran's Administration Hospital Center. All clinical investigation was conducted according to the principles expressed in the Helsinki Declaration.
Endoscopic biopsies were obtained from the colon from macroscopically normal mucosa and processed as described previously (18).
Cell sorting.
CD3+ CD4+ double-positive lymphocytes were sorted from gut and PB by using a MoFlo MLS cell sorter (DakoCytomation, Inc., Fort Collins, CO). Viable single cells of this phenotype were selected for sorting by using light scatter and a doublet discriminator based on pulse width. Cells were sorted at 500 cells/well into 96-well PCR plates using the MoFlo CyClone adapter and stored at −70°C immediately after sorting. Bulk-sorted material was collected into Eppendorf tubes containing TRIzol reagent (Invitrogen, Carlsbad, CA) and frozen at −70°C immediately for subsequent RNA extraction. Cell sorting was verified by reanalysis of bulk-sorted material and showed >99.5% purity.
Quantitation of HIV-1 viral DNA by real-time PCR.
Flow-sorted cells were resuspended in 25 μl of PCR mixture containing 1× PCR buffer (QIAGEN, Hilden, Germany), 0.2 mM concentrations of each deoxynucleoside triphosphate, 1.5 mM MgCl2, 0.2 μM concentrations of each primer, SYBR green I (1:75,000; Cambrex, East Rutherford, NJ), and 0.25 U of HotStarTaq polymerase (QIAGEN, Valencia, CA). Quantification of HIV-1 viral DNA was performed with the primers Gag-forward (5′-GGACCAAAGGAACCCTTTAGAGA-3′; HIV-1HXB2 1651-1673) and Gag-reverse (5′-GGACCAACAAGGTTTCTGTCATC-3′; (HIV-1HXB2 1759-1737) binding to a conserved sequence in the gag region. The cell input number was adjusted by using primers CCR5-Forward (5′-GTCTTCATTACACCTGCAGCTCTCA-3′) and CCR5-Reverse (5′-AAGCAGAGTTTTTAGGATTCCCGAGTAG-3′) binding to a region of the CC chemokine receptor 5 (CCR-5) genomic DNA. An external standard for CCR5 DNA was created with spectrophotometrically determined copy number standards of a CCR5 DNA PCR product generated with the primer pair CR5S-F (5′-GCTGTGTTTGCGTCTCTCCCAGGA-3′) and CR5S-B (5′-CTCACAGCCCTGTGCCTCTTCTTC-3′). Standards for HIV-1 viral DNA were created with serial dilutions of spectrophotometrically determined copy numbers of molecular clone pNL4.3. Gene amplification was carried out with an initial activation of HotStarTaq polymerase at 95°C for 15 min, followed by 40 cycles of 95°C for 15 s, 60°C for 30 s, and 72°C for 30 s. A postamplification melting curve analysis was performed to determine the correct Tm of the amplified product and to rule out primer dimer formation. Amplification, data acquisition, and analysis were carried out with an ABI 7700 sequence detection instrument (Applied Biosystems, Foster City, CA).
Quantification of HIV-1 intracellular RNA by real-time reverse transcription-PCR.
Cellular RNA was isolated from flow-sorted cells with TRIzol reagent (Invitrogen, Carlsbad, CA) according to the manufacturer's protocol. Reverse transcription was performed with 200 to 500 ng of RNA, 1× first-strand buffer (Clontech, Palo Alto, CA), 500 nM concentrations of each deoxynucleoside triphosphate, 10 U of RNasin (Promega, Madison, WI), 200 ng of random hexamers (Promega), and 1 μl of PowerScript reverse transcriptase (Clontech) in 20 μl of total reaction volume. After a 10-min incubation at 25°C the reaction mixture was incubated at 42°C for 50 min, followed by heat inactivation of the reverse transcriptase enzyme at 70°C for 10 min. PCR amplification was carried out with 1 μl of cDNA in a final volume of 25 μl using the same PCR conditions as described for viral HIV-1 DNA quantification. A second PCR using the primers G-1 (5′-AAGGTGAAGGTCGGAGTCAA-3′) and G-2 (5′-TGGAATTTGCCATGGGTGGA-3′) complementary to sequences in the mRNA of housekeeping gene GAPDH (glyceraldehyde-3-phosphate dehydrogenase) was performed to normalize the samples for absolute RNA input.
Light microscopy and immunohistochemistry.
Routine histologic assessment was done on 5-μm sections of formalin-fixed and paraffin-embedded biopsies stained with hematoxylin-eosin or Giemsa stain. For immunohistochemistry, dewaxed sections were subjected to high-temperature antigen retrieval as described previously (29). The sections were incubated with the primary antibodies to CD4 (NCL-CD4-IF6; Novocastra, Newcastle upon Tyne United Kingdom); CD8 (C8/144B), granzyme B (GrB), CD45RO (UCHL1), major histocompatibility complex class II antigen (CR3/43), CD68, and Ki-67 (MIB-1; all from DakoCytomation, Copenhagen, Denmark); perforin (5B10; Novocastra); and T-cell intracytoplasmic antigen (TIA-1; Coulter, Krefeld, Germany). Antibody binding was visualized with the alkaline phosphatase anti-alkaline phosphatase (APAAP) method using New Fuchsin as the chromogen. The sections were either counterstained with hematoxylin and mounted or dehydrated through graded ethanol and subjected to in situ hybridization to detect HIV-1 RNA (see below).
Immunohistochemical double labeling for detection of proliferating T cells or the CD8+ perforin+ subset.
After heat-mediated antigen retrieval by pressure cooking (3 min for CD4 and 15 min for perforin in 50 mM Tris and 2 mM EDTA [pH 9]), the sections were incubated with anti-perforin or anti-CD4 antibodies overnight. Immunodetection was performed either with the StreptABComplex/HRP (code K0391; DakoCytomation) using 3-amino-9-ethylcarbazole (Sigma, St. Louis, MO) as the substrate or with APAAP and Fast Blue as a chromogen. The sections were then heat treated again for 5 min with 0.01 M buffered sodium citrate solution (pH 6.0). This was followed by an overnight incubation either with MIB-1 or a polyclonal antibody generated in rabbit against CD8 (Lab Vision UK, Ltd., Newmarket, United Kingdom). For the second antibody, either the APAAP or the StreptABComplex/HRP visualization system was applied. Enumeration of the perforin-, granzyme B-, or TIA-1-positive cells was performed with a Zeiss AxioImager M1 microscope equipped with AxioCam MRc5 digital camera and AxioVision Rel 4.5 software (Zeiss) as described previously (18). Briefly, using a ×40 objective lens 10 to 15 nonoverlapping digital images were captured for the lamina propria and two to five unit areas for the T-dependent zone of the GALT. The values were averaged separately to represent the numbers of positive cells per unit area of the lamina propria or the GALT. For the proliferating CD4+ Ki-67+ or CD8+ perforin+ subsets the percentage of the double-positive cells was determined. The data were available for only 16 of 32 patients due to technical reasons (high background signal, lack of clear staining, etc.).
In situ hybridization.
The in situ hybridization was performed on paraffin sections as described previously(29). Briefly, deparaffinized sections were boiled in 0.01 M buffered sodium citrate solution (pH 6.0) for 5 min, cooled to room temperature and, together with the immunostained biopsy sections described above, subjected to an overnight hybridization to a 35S-labeled, single-stranded antisense RNA probe of HIV-1 (Lofstrand Labs, Gaithersburg, MD) composed of fragments of 1.4 to 2.7 kb, which collectively represent ca. 90% of HIV-1 genome (7). After several washings in standard saline citrate, the sections were digested with RNase, rinsed again, dehydrated, dipped in Kodak NTB-2 emulsion, and exposed for 7 days. After development in Kodak D-19, the sections were counterstained with hematoxylin and mounted. As a positive control, paraffin-embedded sections from the spleen of an HIV-infected patient were used. As a negative control sections were hybridized with a 35S-labeled sense-strand probe. The sections were examined with an Axiophot microscope (Carl Zeiss, Inc., Jena, Germany) equipped with transmitted and incident light.
Flow cytometry.
Cell surface expression of lymphocyte antigens was identified by monoclonal antibody staining of freshly isolated MMCs and peripheral blood mononuclear cells (PBMC), followed by flow cytometry using a FACSCalibur (Becton Dickinson Immunocytometry Systems [BDIS], Mountain View, CA) with analysis using CellQuest software (BDIS) as described previously (18). The monoclonal antibodies used in the present study included anti-human CD3 fluorescein isothiocyanate (FITC) (clone UCHT1; BDIS), anti-human CD3-phycoerythrin (PE) (clone SK-7; BDIS), anti-human CD3-peridinin chlorophyll-a protein (PerCP; clone SK-7; BDIS), anti-human CD4-allophycocyanin (clone RPA T4; Pharmingen, San Diego, CA), anti-human CD8 PE (clone RPA T8; Pharmingen), anti-human CD38 FITC (clone HIT2; Pharmingen), anti-human CD45RO PE (clone UCHL1; Pharmingen), anti-human Ki67 FITC (clone B56; Pharmingen), anti-human CCR7 PE (clone 3D12; BD Biosciences, San Jose, CA), anti-human CD62L allophycocyanin (clone Dreg56; BD Biosciences), and the appropriate isotype controls. To examine for activated memory cells, gated CD4+ and CD8+ lymphocytes were examined for the expression of CD45RO and CD38. Central and effector memory cells were evaluated by the expression of CD62L and CCR7 on gated CD4+ and CD8+ lymphocytes. To determine the percentage of proliferating cells, after surface staining, PBMC and MMCs were permeabilized with Cytofix/Cytoperm solution (BD Biosciences) according to the manufacturer's instructions. Intracellular staining was performed with Ki67 FITC. Gated CD4+ and CD8+ lymphocytes were examined for the expression of Ki67 by flow cytometry.
Statistical methodology.
Values are expressed as mean ± the standard deviation. Statistical comparisons were made between PBMC and MMCs from individuals by using the Mann-Whitney test. Statistical comparisons were made between HIV-1-infected and control subjects by using a two-sample, unequal variance t test. All reported P values were two sided at the 0.05 significance level using Statview 5.0.1 for Windows software.
(These findings were presented in part in abstract form February 2005 at the 12th Conference of Retroviruses and Opportunistic Infections, Boston, MA, and February 2006 at the 13th Conference of Retroviruses and Opportunistic Infections, Denver, CO.)
RESULTS
Patient characteristics.
A total of 32 male subjects were identified during acute and early HIV-1 infection (Table 1) . Patients were all viremic with a negative or evolving HIV-1 serology. All contracted HIV-1 sexually during same-sex contact and were antiretroviral naive at the time of GI biopsy. CD4 and CD8 T-cell subsets were quantified for all 32 subjects. However, owing to limited study sample availability, markers for memory, activation, and proliferation were examined on 24 subjects, HIV-1 viral DNA was quantified on biopsies from 11 subjects, and HIV-1 RNA levels were determined in 12 subjects.
TABLE 1.
Patient characteristics for 32 study subjects
| Study subject | Count (cells/mm3)
|
Log10 plasma viral load (copies/ml) | Stagea | Estimated duration of infectionb (days) | |
|---|---|---|---|---|---|
| CD4 | CD8 | ||||
| 102 | 391 | 312 | 7.11 | Ia | 18 |
| 100 | 595 | 1,259 | 5.47 | II | 45 |
| 104 | 1,321 | 926 | 5.79 | II | 38 |
| 107 | 426 | 928 | 5.61 | Ia | 24 |
| 336 | 556 | 1,368 | 4.99 | II | 62 |
| 109 | 340 | 803 | 6.26 | II | 19 |
| 119 | 350 | 1,354 | 6.33 | Ia | 18 |
| 122 | 400 | 1,086 | 4.95 | III | 72 |
| 125 | 684 | 855 | 5.03 | II | 36 |
| 127 | 350 | 1,075 | 4.99 | Ia | 23 |
| 131 | 250 | 959 | 6.75 | Ia | 25 |
| 137 | 178 | 1,325 | 5.94 | Ia | 31 |
| 500 | 311 | 1,464 | 5.23 | Ia | 27 |
| 347 | 291 | 679 | 4.43 | Ia | 64 |
| 128 | 706 | 2,638 | 4.57 | Ia | 29 |
| 141 | 489 | 1,146 | 4.94 | III | 88 |
| 142 | 330 | 575 | 4.22 | II | NA |
| 143 | 442 | 621 | 5.17 | Ia | 28 |
| 351 | 956 | 1,017 | 3.42 | II | NA |
| 357 | 514 | 1,218 | 3.75 | III | NA |
| 146 | 391 | 633 | 4.52 | I | 51 |
| 147 | 194 | 267 | 5.97 | Ia | 30 |
| 502 | 408 | 3,011 | 7.46 | Ia | 19 |
| 503 | 631 | 607 | 5.66 | Ia | 18 |
| 508 | 176 | 2,116 | 5.74 | Ia | 26 |
| 148 | 332 | 754 | 5.40 | II | 87 |
| 512 | 820 | 1,598 | 6.51 | Ia | 38 |
| 368 | 346 | 1,070 | 4.62 | II | NA |
| 516 | 372 | 906 | 4.49 | II | 59 |
| 519 | 322 | 976 | 6.26 | Ia | 27 |
| 518 | 434 | 527 | 6.72 | Ia | 19 |
| 520 | 473 | 917 | 4.91 | Ia | 30 |
| Mean | 462 | 1,093 | 5.41 | 37 | |
Subjects were staged in accordance with the NIH-sponsored AIEDRP as follows: ELISA negative (stage Ia), Western blot indeterminate (stage Ib), nonreactive detuned ELISA result with an OD of <0.5 or a documented negative ELISA result within 3 months of presentation (stage II), and a nonreactive detuned ELISA result (OD of 0.51 to 1.0) or a documented negative serology within 6 months of presentation (stage III).
The estimated duration of infection was calculated 2 weeks prior to the onset of acute retroviral illness. In four subjects, the estimated duration of infection could not be calculated. Enrollment was based on nonreactive detuned ELISA result (stage II) or a documented negative HIV-1 test within the 6 months of biopsy (stage III). NA, not available.
Gastrointestinal CD4+ T cells harbor greater HIV-1 viral DNA levels than PB CD4+ T cells.
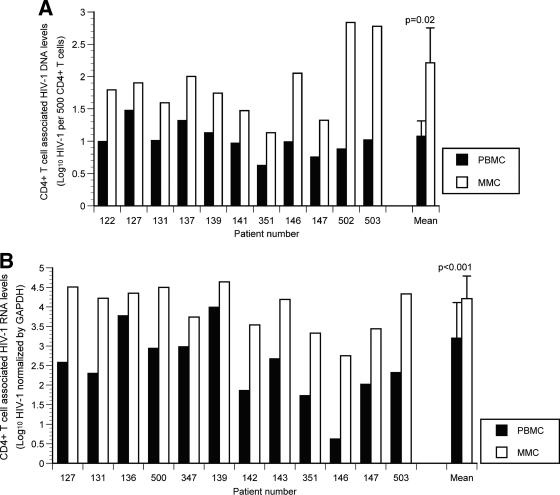
In the GI-derived CD4+ T cells, the HIV-1 viral DNA copy numbers ranged from 14 (1.1-log10) copies to 684 (2.8-log10) copies per 500 cells. In the PB HIV-1 viral DNA the copy numbers ranged from 4 (0.6-log10) copies to 30 (1.5-log10) copies per 500 cells. In each study subject, GI CD4+ T cells harbored a greater quantity of HIV-1 viral DNA than PB CD4+ T cells (Fig. 1A) and ranged from 3- to 90-fold greater than that found in CD4+ T cells derived from the PB. The mean viral DNA in GI CD4+ T cells was 163.5 (2.2 log10) copies/500 cells compared to a mean of 11.9 (1.1 log10) copies/500 PB CD4+ T cells (P = 0.02).
FIG. 1.
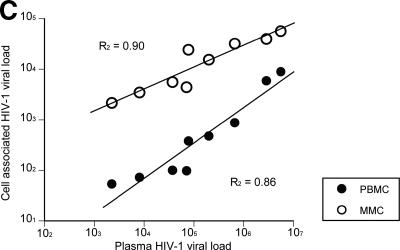
Gastrointestinal CD4+ T cells harbor a greater viral burden than PB CD4+ T cells during acute and early HIV-1 infection. PBMC and MMCs from subjects with acute and early HIV-1 infection were flow cytometrically sorted with >99.5% purity. HIV-1 viral DNA and RNA levels were quantified and compared between GI and PB CD4+ T cells. (A) The log10 HIV-1 viral DNA copy number per 500 CD4+ T cells (shown on the y axis) is compared in 11 study subjects (depicted on the x axis) with black bars representing the PBMC and white bars representing the MMCs. (B) The log10 HIV-1 RNA levels normalized by GAPDH signal (shown on the y axis) are compared in 12 study subjects (represented on the x axis) with black bars depicting the PBMC and white bars depicting the MMCs. (C) Levels of plasma HIV-1 viral load (represented on the x axis) are compared to the PBMC (gray circles) and MMC (white circles) associated viral load (shown on the y axis).
Gastrointestinal CD4+ T cells contain significantly higher levels of HIV-1 mRNA compared to PB CD4+ T cells.
Having examined levels of cell-associated HIV-1 viral DNA, we set out to quantify and compare the level of HIV-1 mRNA within CD4+ lymphocytes cells derived from the two compartments. In order to account for variability in the input cell number, a second PCR was performed to determine the mRNA levels of the housekeeping gene GAPDH, and the HIV-1 RNA copy number was normalized by GAPDH mRNA.
In each of the subjects examined, significantly greater HIV-1 RNA level was observed within CD4+ lymphocytes derived from the GI tract compared to PB (Fig. 1B). The mean HIV-1 mRNA copy number, normalized by GAPDH signal, was 16,542 (4.2 ± 0.6 log10) copies in GI CD4+ T cells compared to 1,594 (3.2 ± 0.9 log10) copies in PB CD4+ T cells (P < 0.001). In fact, in subject 503, a 102-fold-greater HIV-1 RNA copy number was observed in GI CD4+ T cells than in the PB CD4+ T cells. Cumulative analysis of all study subjects revealed a mean of 10-fold-greater HIV-1 RNA levels within GI CD4+ T cells compared to the PB CD4+ T cells (range, 3- to 102-fold).
Simultaneous plasma HIV-1 RNA levels (quantified by the Cobas Roche Amplicor assay) correlated well with the level of GI CD4+ T-cell associated HIV-1 RNA levels (R2 = 0.90), as well as with PB CD4+ T-cell associated HIV-1 RNA levels (R2 = 0.86) (Fig. 1C).
Activated and “nonactivated” cells, proliferating cells, and nonproliferating cells produce HIV-1 RNA in the GI tract during AEI.
We selected patients 502 and 503 for intensive in situ studies and immunohistochemistry since they were biopsied after an estimated 19 and 18 days postinfection and represent the earliest biopsies available for analysis. Our aim was to study the phenotype of infected cells using a combination of immunohistochemistry and in situ hybridization.
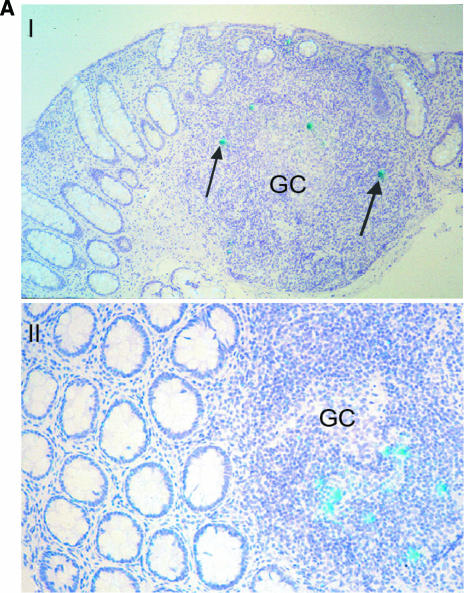
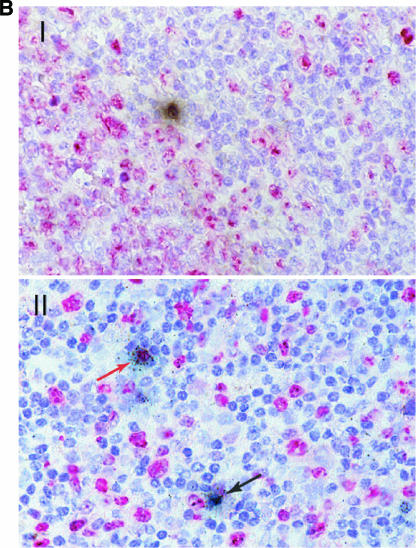
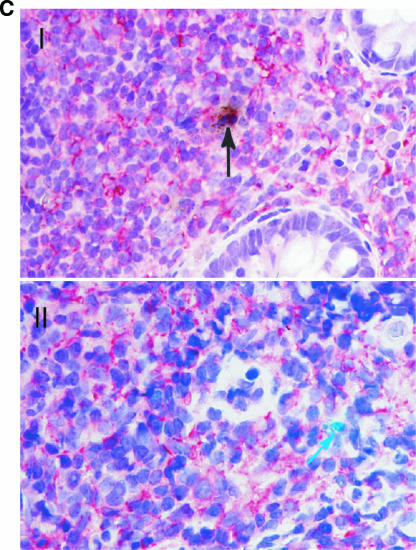
As shown in Fig. 2A, HIV-1 RNA-positive cells were detected in the organized lymphoid tissue with no preferential localization (such cells were detected in the germinal centers and the T-cell-dependent zones, as well as in the dome region). HIV-1 RNA-positive cells demonstrated lymphocytic morphology and were positive for CD4 and CD45RO receptors. Cells that were positive for nuclear antigen Ki67, a marker of cellular proliferation, and Ki67-negative cells both harbored HIV-1 RNA (Fig. 2B). Similarly, both HLA-DR-positive and HLA-DR-negative cells were found to express HIV-1 RNA (Fig. 2C). Meaningful statistical calculations to determine the preponderance of one cell type over the other could not be performed due to the relatively low infected-cell number detected in these in situ studies.
FIG. 2.
Detection of HIV-1 RNA in the GI tract during acute and early HIV-1 infection and characterization of the phenotype of infected GI lymphocytes. Using a 35S-labeled, single-stranded antisense RNA probe of HIV-1, in situ hybridization was performed on paraffin sections to detect HIV-1 RNA within the GI tract. Combinations of immunohistochemistry and in situ hybridization were used to determine whether infected lymphocytes exhibited a proliferating (Ki67+) or activated (HLA-DR+) phenotype. Cells were considered positive for viral gene expression if the grain count was more than six times the background. (A) In the upper panel, follicular localization of HIV-1 mRNA (blue-green, using reflected light) is indicated by black arrows at (estimated) day 18 postinfection (subject 503). Original magnification, ×50. The lower panel depicts a higher magnification (×100) of a biopsy from subject 131 at (estimated) 25 days postinfection. Scattered HIV-1-infected cells are noted in the lymphoid follicle (blue-green, reflected light), along with delicate viral trapping (faint, reticular green in subject 131). Virus trapping could not be detected in the germinal center (GC) in subject 503 at day 18 postinfection. (B) HIV gene expression (black, using transmitted light) in proliferating (MIB-1/Ki67+; red) and nonproliferating cells. Panel I shows the edge of a germinal center (GC, subject 503, 18 days postinfection) with the RNA-producing, Ki67+ cell. Panel II depicts the extrafollicular lymphoid tissue (subject 502, 19 days postinfection) showing a Ki67+ cell with low grain count (red arrow) and a Ki67− cell with a high grain count (black arrow). Original magnification, ×100. (C) Panel I shows an HLA-DR (red)-expressing cell containing HIV-1 RNA (black, transmitted light). A sample from subject 502 at (estimated) 19 days postinfection is shown. Original magnification, ×100. Panel II depicts the same study subject. The HIV-1 RNA+ cell (blue-green signal, reflected light) does not express HLA-DR. Original magnification, ×100.
Despite a numerical depletion of GI memory CD4+ T cells, there is an increase in the percentage of activated, memory CD4+ T-cell subsets within the GI tract.
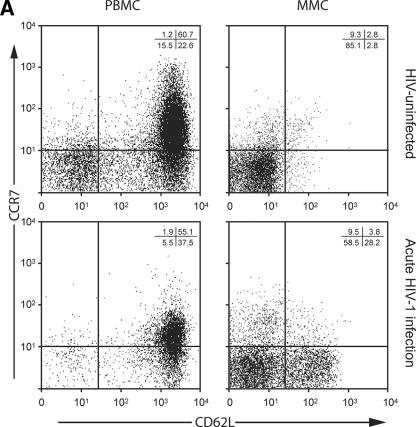
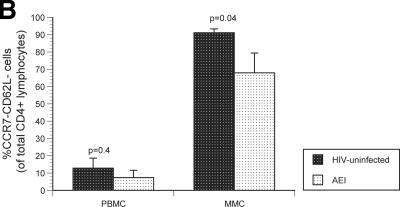
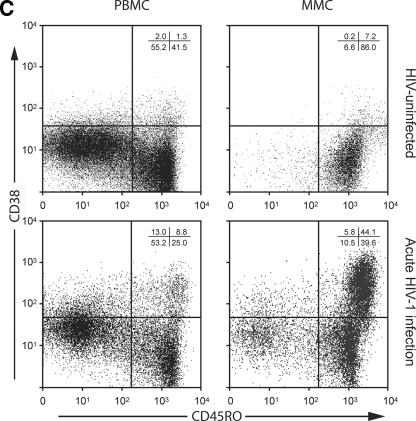
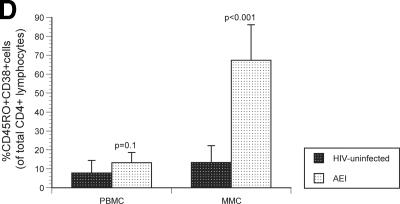
Having studied virological parameters in the PB and GI tract, we sought to examine the immunological characteristics of CD4+ and CD8+ T cells derived from both compartments. Markers of immunological memory (CD45RO) and activation (CD38) were assessed on MMCs and PBMC from HIV-1-uninfected and -infected subjects. As previously established, the levels of memory CD4+ T cells were significantly lower in the PBMC (28.7% ± 3.8%) and MMC (88.5% ± 5.5%) compartments in AEI subjects compared to HIV-uninfected controls (50.5% ± 16.8% memory CD4+ PBMC [P = 0.04] and 96.2% ± 3.1% memory CD4+ MMCs [P = 0.01], respectively). Among memory cells, depletion was most significant in the effector memory (CD62L− CCR7−) subsets of MMCs (91.2% ± 1.1% in HIV-uninfected versus 67.9% ± 11.9% in AEI subjects, P = 0.04) but not the PBMC (12.9% ± 5.8% in HIV-uninfected versus 7.5% ± 4.2% in AEI subjects, P = 0.4) (Fig. 3A). Although there was depletion in the overall percentage and effector memory subsets of CD4+ T cells, significant expansion was noted in activated memory CD4+ T cells (CD4+ T cells coexpressing HLA-DR and CD38) in the GI tract. Of CD4+ PBMC, 7.8% ± 6.6% expressed CD45RO/CD38 in HIV-uninfected versus 13.2% ± 5.4% in AEI, P = 0.1. Among CD4+ MMCs, 13.3% ± 8.9% expressed CD45RO/CD38 in HIV-uninfected versus 67.3% ± 18.8 (P < 0.001) (Fig. 3B).
FIG. 3.
Immunological phenotype of PBMC and MMCs during acute and early HIV-1 infection. (A) Representative flow cytometry plots comparing effector memory cells between an HIV-uninfected control (upper panels) and a subject with acute HIV-1 infection (lower panels). PBMC (left column) and MMCs (right column) were initially identified on the basis of forward- and side-scatter characteristics. CD3+/CD4+ gated PBMC and MMCs were then analyzed for the expression of CD62L (x axis) and CCR7 (y axis). (B) Cumulative data from HIV-uninfected controls and AEI subjects comparing effector memory cells (CCR7-CD62L-, depicted on the Y-axis) between PBMC and MMCs (both shown on the X-axis). As described above, CD3+CD4+ gated PBMC and MMCs were flow cytometrically analyzed for coexpression of CCR7 and CD62L here. (C) Representative flow cytometry plots comparing activated memory cells between an HIV-uninfected control (upper panels) and a subject with acute HIV-1 infection (lower panels). PBMC (left column) and MMCs (right column) were initially identified on the basis of forward and side scatter characteristics. CD3+/CD4+ gated PBMC and MMCs were then analyzed for the expression of CD45RO (x axis) and CD38 (y axis). (D) Cumulative data from HIV-uninfected controls and AEI subjects comparing activated memory CD4+ T cells (CD3+/CD4+ gated PBMC and MMCs coexpressing CD45RO and CD38, depicted on the y axis).
Gastrointestinal CD4+ lymphocytes proliferate preferentially compared to PB CD4+ lymphocytes in acute and early HIV-1 infection.
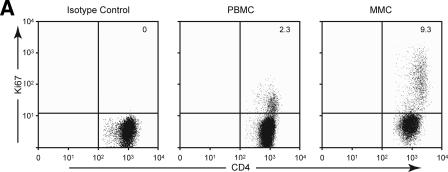
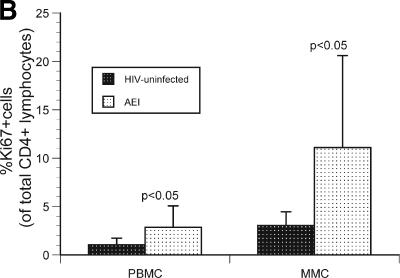
To examine whether decreased CD4+ T-cell proliferation played a role in mucosal CD4+ T-cell depletion, we examined the expression of Ki67 by flow cytometry. CD4+ T cells derived from the PBMC and MMC compartments of HIV-uninfected and HIV-1-infected subjects were studied (Fig. 4A). Among PBMC, 1.1% ± 0.6% CD4+ T cells were Ki67+ in HIV-uninfected individuals compared to 2.9% ± 2.2% Ki67+ CD4+ T cells in HIV-1-infected individuals (P < 0.05). In comparison, among MMCs 3.1% ± 1.4% CD4+ T cells were Ki67+ in HIV-uninfected individuals compared to 11.1% ± 9.5% Ki67+ CD4+ T cells in the HIV-1-infected individuals (P < 0.05) (Fig. 4B).
FIG. 4.
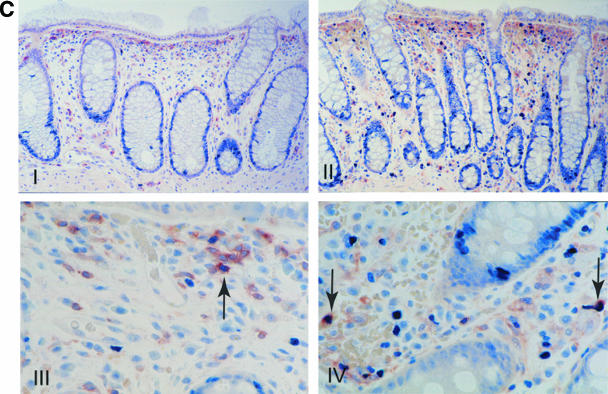
Increase in proliferating CD4+ T cells in the GI tract during acute and early HIV-1 infection. (A) Representative flow cytometry plot from a subject with acute HIV-1 infection (subject 147) comparing CD4+ T cells (shown on the x axis) and Ki67 (shown on the y axis). The left panel depicts the isotype control for Ki67, the middle panel represents the PBMC compartment, and the right panel shows the MMC compartment. (B) CD3+/CD4+ gated PBMC and MMCs (shown on the x axis) were flow cytometrically examined for the percentage of Ki67+ cells (shown on the y axis) in HIV-uninfected controls and AEI subjects. (C) Examination of proliferating cells (MIB-1/Ki67+) within the gastrointestinal lamina propria by immunohistochemistry during AEI. Double labeling for CD4 (brown) and Ki-67 (blue) demonstrates cycling CD4+ lymphocytes (arrows). Panels I and III depict low (×50)- and high (×160)-power views, respectively, from an HIV-uninfected control. Panels II and IV show low- and high-power views from a subject with acute HIV-1 infection.
To confirm that the observed increase in the percentage of Ki67+ CD4+ T cells in the GI tract reflected an increase in the absolute numbers of proliferating CD4+ T cells, we used immunohistochemistry to compare the numbers of Ki67+ CD4+ T cells in the GI tracts of HIV-1-infected and uninfected subjects. Since a depletion of lamina propria CD4+ T cells resulted in significant variability in the cell count per unit area, we determined cells coexpressing CD4 and MiB (Ki67) and expressed these them as the percent Ki67+ cells (as a percentage of CD4+ T cells per unit area). The mean percentage of Ki67+ CD4+ cells in the lamina propria in AEI subjects was 17.7% ± 9.8% cells compared to 8.6% ± 1.6% cells per unit area in the HIV-uninfected controls (P = 0.01). In each case examined, sections from HIV-1-infected subjects contained more proliferating CD4+ cells than sections from HIV-uninfected subjects (Fig. 4C). Thus, by two separate and complementary methods we demonstrated that there is an increase in proliferating CD4+ T cells in the GI tract of subjects with primary HIV-1 infection.
Cells expressing cytotoxic granules are significantly increased in the GI tract during AEI compared to HIV-uninfected controls.
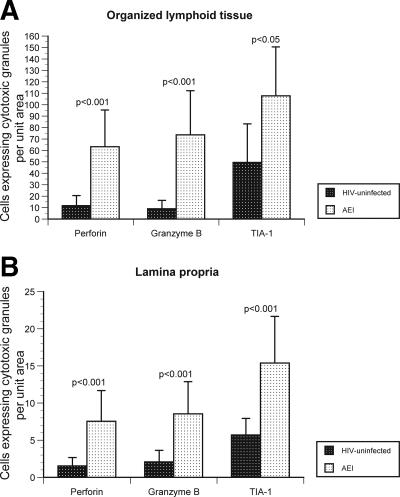
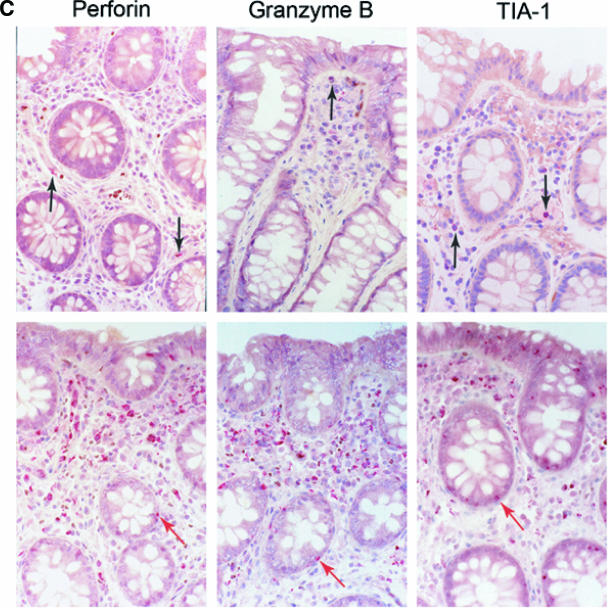
We studied the expression of three cytotoxic granules—perforin, granzyme B, and TIA-1—to examine cytotoxic T-cell activity in situ during AEI (Fig. 5). It needs to be emphasized that the HIV-1 specificity of these cytotoxic cells was not determined in the present study and is a subject of ongoing experiments. In the organized lymphoid tissue, a significant increase in the levels of granzyme B (73.6 cells/unit area ± 38.7) and TIA-1 (107.8 cells/unit area ± 42.8) was noted during AEI compared to HIV-uninfected controls (8.9 cells/unit area ± 7.3 [P < 0.001] and 49.5 cells/unit area ± 33.6 [P < 0.05]). In the lamina propria (LP), a similar increase in granzyme B (8.6 cells/unit area ± 4.1) and TIA-1 (15.4 cells/unit area ± 6.3) levels was noted during AEI compared to HIV-uninfected controls (2.1 cells/unit area ± 1.5 [P < 0.001] and 5.7 cells/unit area ± 2.2 [P < 0.001]). In contrast to previous reports, we observed a marked increase in the levels of perforin in both, the organized lymphoid tissue (63.2 cells/unit area ± 33.2) and LP (7.6 cells/unit area ± 4.1) during AEI compared to HIV-uninfected controls (11.7 cells/unit area ± 8.7 [P < 0.001] and 1.5 cells/unit area ± 1.3 [P < 0.001], respectively).
FIG. 5.
Significant increase in the cytotoxic granules perforin, granzyme B, and TIA-1 in the GI tract during AEI. (A and B) Cells expressing cytotoxic granules perforin, granzyme B, and TIA-1 (represented on the x axis) per unit area (shown on the y axis) were examined by immunohistochemistry within mucosal inductive (Fig. 5A) and effector (Fig. 5B) sites in HIV-uninfected controls and AEI subjects. (C) Panel I depicts representative sections from an HIV-uninfected control showing the few cytotoxic granule-positive cells (black arrows). Original magnification, ×100. Panel II shows representative biopsy sections from a subject with AEI depicting abundant cells expressing perforin, granzyme B, and TIA-1 in the GI lamina propria. Red arrows indicate intraepithelial cells expressing perforin, granzyme B, and TIA-1, respectively. Original magnification, ×100.
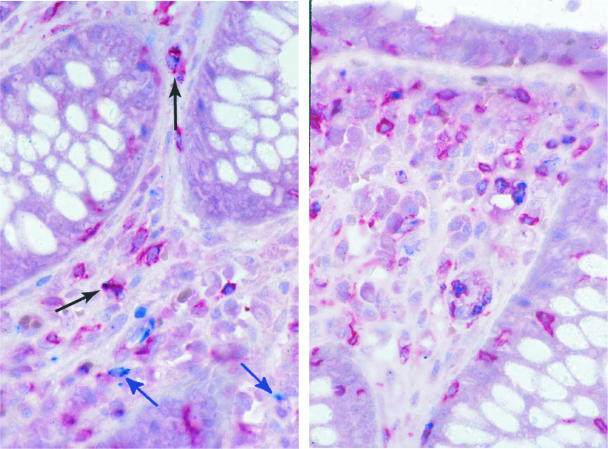
To further characterize these cytotoxic cells, we coexamined the expression of CD8 receptor and perforin expression in situ (Fig. 6). In HIV-uninfected subjects, 11.7% ± 8.1% CD8+ cells coexpressed perforin. In comparison, during AEI 26.6% ± 12.6% CD8+ cells coexpressed perforin (P = 0.05), signifying an expansion of perforin-expressing cytotoxic CD8+ cells in the GI tract during AEI. Of interest was the fact that, among the perforin-expressing cells, 41% were negative for CD8 expression (Table 2).
FIG. 6.
Phenotypic characterization of perforin expressing cells. Immunohistochemical double labeling for CD8 (red) and perforin (blue) shows that a proportion of perforin containing cells are CD8+ T cells (black arrows). Cells that are negative for CD8 but contain perforin are also present (blue arrows). Original magnification, ×160.
TABLE 2.
Percentage of cells coexpressing perforin
| Study subject | % Cells coexpressing perforina:
|
|
|---|---|---|
| CD8+ | CD8− | |
| 104 | 17.3 | 41.8 |
| 109 | 34.2 | 35.5 |
| 131 | 55.6 | 21.2 |
| 137 | 24.9 | 42.2 |
| 141 | 24.3 | 28.4 |
| 142 | 12.4 | 49.3 |
| 143 | 25.6 | 27.2 |
| 357 | 27.5 | 39.8 |
| 502 | 43.0 | 39.4 |
| 503 | 31.7 | 47.2 |
| 516 | 39.6 | 36.8 |
| 512 | 22.4 | 39.0 |
| 368 | 6.5 | 51.9 |
| 519 | 30.0 | 47.0 |
| 518 | 18.6 | 53.4 |
| 520 | 11.6 | 54.9 |
The mean values for CD8+ and CD8− cells were 26.5% ± 12.6% and 40.9% ± 9.7%, respectively.
DISCUSSION
We undertook the present study to explore putative virological and immunological factors associated with selective depletion of mucosal gastrointestinal CD4+ T cells during acute and early HIV-1 infection.
We demonstrate conclusively here that the HIV-1 viral burden is consistently greater in the GI CD4+ T-cell population than in the PB. This was demonstrated for both viral DNA and HIV-1 RNA by using PCR-based methods. By combining in situ hybridization and immunohistochemistry, we found both activated and nonactivated cells expressing HIV-1 mRNA at (estimated) days 18 to 19 postinfection. Furthermore, we observed that high levels of virus in the GI tract are associated with activation and proliferation of mucosal lymphocytes and a rather dramatic increase in cytotoxic cells, both CD8+ and CD8−. Based on these observations, we propose that mucosal CD4+ T-cell depletion during AEI is multifactorial and is due to, though not limited to, a combination of direct viral infection, activation induced cell death and host-derived cytotoxic cellular response.
Our data are consistent with the SIV-macaque experiments described above (16, 17) in that, during AEI with HIV-1, GI CD4+ lymphocytes are preferentially infected and have a greater viral burden than PB CD4+ lymphocytes. The results presented here show higher levels of both HIV-1 viral DNA and RNA content within intestinal derived CD4+ T cells than within PB CD4+ T cells. Although our studies represent snapshots of post-peak viremia events, the fact that up to 102-fold-greater HIV-1 RNA levels were observed in GI CD4+ T cells than in PB CD4+ T cells supports the concept that the GI tract preferentially supports early events during acute infection. This is likely to be due to the presence of densely clustered memory CD4+ T cells expressing high levels of CCR5 in the GI tract (21, 23). Finally, we believe that the high correlation between cell-associated HIV-1 RNA and plasma RNA both validates our assay and is consistent with established models of HIV-1 viral dynamics confirming that the plasma viral load is a reflection of the numbers of infected cells (20).
Although prior studies have documented the presence of virus in the GI tract during acute (3, 8, 18) and chronic (5, 13, 19, 26) stages of HIV-1 infection, viral quantification was performed here in separated CD4+ T cells and not biopsy tissue to avoid confounding variables such as quantification of trapped virus in mucosal inductive sites (4, 11) and to have the same denominator in comparing the GI tract and PB.
We determined the phenotype of infected mucosal cells in two patients who were biopsied earliest in order to compare our findings to what has been observed in the SIV model. We observed that there is no clear difference in virus production between “activated” and “nonactivated cells” at (estimated) days 18 to 19 postinfection, and this is consistent with the notion put forth by Li et al. of a switch from nonactivated to activated cells accounting for viral production as acute infection evolves (16). It should be noted that in both the present study and the study by Li et al. the assessment of activated versus nonactivated cells was done on formalin-fixed tissues (and not fresh-frozen tissue, which could potentially produce different results).
HIV-1 infection is known to trigger a brisk innate and adaptive cytotoxic immune response in the infected host (14). We document a robust cytotoxic response in the GI tract during AEI, visible as early as day 18 postinfection. As part of this response, we observed significantly elevated levels of perforin expression in the GI tract during AEI, which is evident in both the immune inductive and the effector sites. These findings differ from previous reports describing a deficiency of perforin production in mucosal CD8+ T cells (1, 2, 25). The precise nature of these mucosal cytotoxic cells is unclear (we did not determine whether the cytotoxic cells were HIV-1 specific or not) and will be characterized in subsequent studies. However, we do believe that HIV-1-specific cells are likely to be contained within the overall cytotoxic cellular pool. Importantly, we also identified CD8-negative cytotoxic cells in the GI mucosa during acute HIV-1 infection. Although not yet characterized, these cells are likely to be innate immune cells, such as natural killer cells. The role of the cytotoxic T-cell response in the pathogenesis of HIV-1 infection and the observed mucosal CD4+ T-cell depletion need to be further defined.
Immune activation is a characteristic feature of untreated HIV-1 infection and is associated with a progressive depletion of CD4+ T cells (9, 10). Here we demonstrate that during AEI there is a significant increase in activated memory cells (CD45RO+/CD38+) within the GI tract. While not in itself surprising, this observation has two potential consequences. First, the majority of mucosal cells are terminally differentiated effector cells(23) and are much more likely to apoptose when activated than are PB-derived naive cells. Therefore, given that about two-thirds of mucosal CD4+ T cells express markers of activation (CD38) during AEI (Fig. 3B), it is likely that activation-induced cell death plays an important role in GI CD4+ T-cell depletion during acute infection. Second, activated CD4+ T cells represent the “preferred cellular targets” for HIV-1(24). Thus, HIV-1 infection generates an expanding population of cellular targets within the GI tract by triggering activation of densely packed mucosal mononuclear cells. There have been conflicting reports regarding the relationship between proliferation and CD4+ T-cell depletion during HIV infection. Using ex vivo labeling with bromodeoxyuridine, Lane and coworkers demonstrated a significant increase in dividing CD4+ and CD8+ T cells during untreated HIV-1 infection(15). In contrast, Pantaleo and coworkers, using Ki67 as a marker of proliferation, suggested that the total number of proliferating CD4+ T cells is not significantly different between HIV-infected and uninfected subjects (6). In studies of the GI tract during AEI, some groups have demonstrated an increase in lymphocyte proliferation (8), whereas others have not (3). To address this issue conclusively, we examined AEI-associated GI lymphocytic proliferation by two different and complementary techniques: flow cytometry and immunohistochemistry. We conclude that there is a significant increase in proliferating lymphocytes (as measured by the absolute number and percentage of Ki67+ cells) in the mucosa during AEI and that decreased lymphocyte proliferation is not a factor in mucosal CD4+ T-cell depletion.
Based on the present study, we propose that mucosal CD4+ T-cell depletion is multifactorial. It is likely that direct viral infection is responsible for the earliest loss of CD4+ T cells demonstrated by the increased viral burden. Moreover, we believe that ongoing infection of susceptible CD4+ T cells, along with activation-induced cellular death and a host-derived cytotoxic cellular response, is responsible for the persistence of the lesion. We cannot exclude alterations in mucosal cell recruitment and homing that may contribute to this process, an area of ongoing investigation.
The present findings extend our understanding of the early events within the human GI tract during HIV-1 infection. It is plausible that disruption of these events could have a significant impact on viral pathogenesis. It is important that such interventions be the focus of future research.
Acknowledgments
We thank the patients for their participation. We acknowledge the nursing staff at Rockefeller University and Bellevue Hospitals for clinical assistance. We thank Petra Meyer, Birgit Raschdorff, and Gudrun Grosschupff for technical assistance with the immunohistochemistry and in situ hybridization; Russell Chieffe, Melissa Lamar, and Jorge Ortiz for data management; and Wendy Chen for help with the figures and tables.
This study was supported in part by grants from the AIEDRP (AI-41534) and the American Foundation for AIDS Research (106717-40-RGRL) with support from Concerned Parents for AIDS, as well as by a General Clinical Research Center grant from the National Center for Research Resources at the National Institutes of Health (M01-RR00102), German Ministry of Education and Research Contract KompNet 01KI0211 (P.R. and K.T.-R.), an Irma T Hirschl/Monique Weill-Caulier Trust Award, the Empire Clinical Research Investigators Program, and The Michael Saperstein Medical Scholars Research Fund.
The authors do not have commercial or other associations that might pose a conflict of interest.
Footnotes
Published ahead of print on 25 October 2006.
REFERENCES
- 1.Andersson, J., H. Behbahani, J. Lieberman, E. Connick, A. Landay, B. Patterson, A. Sonnerborg, K. Lore, S. Uccini, and T. E. Fehniger. 1999. Perforin is not coexpressed with granzyme A within cytotoxic granules in CD8 T lymphocytes present in lymphoid tissue during chronic HIV infection. Aids 13:1295-1303. [DOI] [PubMed] [Google Scholar]
- 2.Andersson, J., S. Kinloch, A. Sonnerborg, J. Nilsson, T. E. Fehniger, A. L. Spetz, H. Behbahani, L. E. Goh, H. McDade, B. Gazzard, H. Stellbrink, D. Cooper, and L. Perrin. 2002. Low levels of perforin expression in CD8+ T lymphocyte granules in lymphoid tissue during acute human immunodeficiency virus type 1 infection. J. Infect. Dis. 185:1355-1358. [DOI] [PubMed] [Google Scholar]
- 3.Brenchley, J. M., T. W. Schacker, L. E. Ruff, D. A. Price, J. H. Taylor, G. J. Beilman, P. L. Nguyen, A. Khoruts, M. Larson, A. T. Haase, and D. C. Douek. 2004. CD4+ T-cell depletion during all stages of HIV disease occurs predominantly in the gastrointestinal tract. J. Exp. Med. 200:749-759. [DOI] [PMC free article] [PubMed] [Google Scholar]
- 4.Estes, J. D., B. F. Keele, K. Tenner-Racz, P. Racz, M. A. Redd, T. C. Thacker, Y. Jiang, M. J. Lloyd, S. Gartner, and G. F. Burton. 2002. Follicular dendritic cell-mediated up-regulation of CXCR4 expression on CD4 T cells and HIV pathogenesis. J. Immunol. 169:2313-2322. [DOI] [PubMed] [Google Scholar]
- 5.Fackler, O. T., M. Schafer, W. Schmidt, T. Zippel, W. Heise, T. Schneider, M. Zeitz, E. O. Riecken, N. Mueller-Lantzsch, and R. Ullrich. 1998. HIV-1 p24 but not proviral load is increased in the intestinal mucosa compared with the peripheral blood in HIV-infected patients. AIDS 12:139-146. [DOI] [PubMed] [Google Scholar]
- 6.Fleury, S., G. P. Rizzardi, A. Chapuis, G. Tambussi, C. Knabenhans, E. Simeoni, J. Y. Meuwly, J. M. Corpataux, A. Lazzarin, F. Miedema, and G. Pantaleo. 2000. Long-term kinetics of T-cell production in HIV-infected subjects treated with highly active antiretroviral therapy. Proc. Natl. Acad. Sci. USA 97:5393-5398. [DOI] [PMC free article] [PubMed] [Google Scholar]
- 7.Fox, C. H., K. Tenner-Racz, P. Racz, A. Firpo, P. A. Pizzo, and A. S. Fauci. 1991. Lymphoid germinal centers are reservoirs of human immunodeficiency virus type 1 RNA. J. Infect. Dis. 164:1051-1057. [DOI] [PubMed] [Google Scholar]
- 8.Guadalupe, M., E. Reay, S. Sankaran, T. Prindiville, J. Flamm, A. McNeil, and S. Dandekar. 2003. Severe CD4+ T-cell depletion in gut lymphoid tissue during primary human immunodeficiency virus type 1 infection and substantial delay in restoration following highly active antiretroviral therapy. J. Virol. 77:11708-11717. [DOI] [PMC free article] [PubMed] [Google Scholar]
- 9.Hazenberg, M. D., D. Hamann, H. Schuitemaker, and F. Miedema. 2000. T-cell depletion in HIV-1 infection: how CD4+ T cells go out of stock. Nat. Immunol. 1:285-289. [DOI] [PubMed] [Google Scholar]
- 10.Hazenberg, M. D., S. A. Otto, B. H. van Benthem, M. T. Roos, R. A. Coutinho, J. M. Lange, D. Hamann, M. Prins, and F. Miedema. 2003. Persistent immune activation in HIV-1 infection is associated with progression to AIDS. AIDS 17:1881-1888. [DOI] [PubMed] [Google Scholar]
- 11.Heath, S. L., J. G. Tew, J. G. Tew, A. K. Szakal, and G. F. Burton. 1995. Follicular dendritic cells and human immunodeficiency virus infectivity. Nature 377:740-744. [DOI] [PubMed] [Google Scholar]
- 12.Janssen, R. S., G. A. Satten, S. L. Stramer, B. D. Rawal, T. R. O'Brien, B. J. Weiblen, F. M. Hecht, N. Jack, F. R. Cleghorn, J. O. Kahn, M. A. Chesney, and M. P. Busch. 1998. New testing strategy to detect early HIV-1 infection for use in incidence estimates and for clinical and prevention purposes. JAMA 280:42-48. [DOI] [PubMed] [Google Scholar]
- 13.Kotler, D. P., S. Reka, A. Borcich, and W. J. Cronin. 1991. Detection, localization, and quantitation of HIV-associated antigens in intestinal biopsies from patients with HIV. Am. J. Pathol. 139:823-830. [PMC free article] [PubMed] [Google Scholar]
- 14.Koup, R. A., J. T. Safrit, Y. Cao, C. A. Andrews, G. McLeod, W. Borkowsky, C. Farthing, and D. D. Ho. 1994. Temporal association of cellular immune responses with the initial control of viremia in primary human immunodeficiency virus type 1 syndrome. J. Virol. 68:4650-4655. [DOI] [PMC free article] [PubMed] [Google Scholar]
- 15.Lempicki, R. A., J. A. Kovacs, M. W. Baseler, J. W. Adelsberger, R. L. Dewar, V. Natarajan, M. C. Bosche, J. A. Metcalf, R. A. Stevens, L. A. Lambert, W. G. Alvord, M. A. Polis, R. T. Davey, D. S. Dimitrov, and H. C. Lane. 2000. Impact of HIV-1 infection and highly active antiretroviral therapy on the kinetics of CD4+ and CD8+ T-cell turnover in HIV-infected patients. Proc. Natl. Acad. Sci. USA 97:13778-13783. [DOI] [PMC free article] [PubMed] [Google Scholar]
- 16.Li, Q., L. Duan, J. D. Estes, Z. M. Ma, T. Rourke, Y. Wang, C. Reilly, J. Carlis, C. J. Miller, and A. T. Haase. 2005. Peak SIV replication in resting memory CD4+ T cells depletes gut lamina propria CD4+ T cells. Nature 434:1148-1152. [DOI] [PubMed] [Google Scholar]
- 17.Mattapallil, J. J., D. C. Douek, B. Hill, Y. Nishimura, M. Martin, and M. Roederer. 2005. Massive infection and loss of memory CD4+ T cells in multiple tissues during acute SIV infection. Nature 434:1093-1097. [DOI] [PubMed] [Google Scholar]
- 18.Mehandru, S., M. A. Poles, K. Tenner-Racz, A. Horowitz, A. Hurley, C. Hogan, D. Boden, P. Racz, and M. Markowitz. 2004. Primary HIV-1 infection is associated with preferential depletion of CD4+ T lymphocytes from effector sites in the gastrointestinal tract. J. Exp. Med. 200:761-770. [DOI] [PMC free article] [PubMed] [Google Scholar]
- 19.Nelson, J. A., C. A. Wiley, C. Reynolds-Kohler, C. E. Reese, W. Margaretten, and J. A. Levy. 1988. Human immunodeficiency virus detected in bowel epithelium from patients with gastrointestinal symptoms. Lancet i:259-262. [DOI] [PubMed] [Google Scholar]
- 20.Perelson, A. S., A. U. Neumann, M. Markowitz, J. M. Leonard, and D. D. Ho. 1996. HIV-1 dynamics in vivo: virion clearance rate, infected cell life-span, and viral generation time. Science 271:1582-1586. [DOI] [PubMed] [Google Scholar]
- 21.Poles, M. A., J. Elliott, P. Taing, P. A. Anton, and I. S. Chen. 2001. A preponderance of CCR5+ CXCR4+ mononuclear cells enhances gastrointestinal mucosal susceptibility to human immunodeficiency virus type 1 infection. J. Virol. 75:8390-8399. [DOI] [PMC free article] [PubMed] [Google Scholar]
- 22.Quigley, M. F., K. Abel, B. Zuber, C. J. Miller, J. K. Sandberg, and B. L. Shacklett. 2006. Perforin expression in the gastrointestinal mucosa is limited to acute simian immunodeficiency virus infection. J. Virol. 80:3083-3087. [DOI] [PMC free article] [PubMed] [Google Scholar]
- 23.Schieferdecker, H. L., R. Ullrich, H. Hirseland, and M. Zeitz. 1992. T-cell differentiation antigens on lymphocytes in the human intestinal lamina propria. J. Immunol. 149:2816-2822. [PubMed] [Google Scholar]
- 24.Schnittman, S. M., S. M. Denning, J. J. Greenhouse, J. S. Justement, M. Baseler, J. Kurtzberg, B. F. Haynes, and A. S. Fauci. 1990. Evidence for susceptibility of intrathymic T-cell precursors and their progeny carrying T-cell antigen receptor phenotypes TCRαβ+ and TCRγδ+ to human immunodeficiency virus infection: a mechanism for CD4+ (T4) lymphocyte depletion. Proc. Natl. Acad. Sci. USA 87:7727-7731. [DOI] [PMC free article] [PubMed] [Google Scholar]
- 25.Shacklett, B. L., C. A. Cox, M. F. Quigley, C. Kreis, N. H. Stollman, M. A. Jacobson, J. Andersson, J. K. Sandberg, and D. F. Nixon. 2004. Abundant expression of granzyme A, but not perforin, in granules of CD8+ T cells in GALT: implications for immune control of HIV-1 infection. J. Immunol. 173:641-648. [DOI] [PubMed] [Google Scholar]
- 26.Smith, P. D., C. H. Fox, H. Masur, H. S. Winter, and D. W. Alling. 1994. Quantitative analysis of mononuclear cells expressing human immunodeficiency virus type 1 RNA in esophageal mucosa. J. Exp. Med. 180:1541-1546. [DOI] [PMC free article] [PubMed] [Google Scholar]
- 27.Stahl-Hennig, C., R. M. Steinman, P. Ten Haaft, K. Uberla, N. Stolte, S. Saeland, K. Tenner-Racz, and P. Racz. 2002. The simian immunodeficiency virus deltaNef vaccine, after application to the tonsils of Rhesus macaques, replicates primarily within CD4+ T cells and elicits a local perforin-positive CD8+ T-cell response. J. Virol. 76:688-696. [DOI] [PMC free article] [PubMed] [Google Scholar]
- 28.Tenner-Racz, K., C. Stahl Hennig, K. Uberla, H. Stoiber, R. Ignatius, J. Heeney, R. M. Steinman, and P. Racz. 2004. Early protection against pathogenic virus infection at a mucosal challenge site after vaccination with attenuated simian immunodeficiency virus. Proc. Natl. Acad. Sci. USA 101:3017-3022. [DOI] [PMC free article] [PubMed] [Google Scholar]
- 29.Tenner-Racz, K., H. J. Stellbrink, J. van Lunzen, C. Schneider, J. P. Jacobs, B. Raschdorff, G. Grosschupff, R. M. Steinman, and P. Racz. 1998. The unenlarged lymph nodes of HIV-1-infected, asymptomatic patients with high CD4 T-cell counts are sites for virus replication and CD4 T-cell proliferation. The impact of highly active antiretroviral therapy. J. Exp. Med. 187:949-959. [DOI] [PMC free article] [PubMed] [Google Scholar]
- 30.Veazey, R. S., M. DeMaria, L. V. Chalifoux, D. E. Shvetz, D. R. Pauley, H. L. Knight, M. Rosenzweig, R. P. Johnson, R. C. Desrosiers, and A. A. Lackner. 1998. Gastrointestinal tract as a major site of CD4+ T-cell depletion and viral replication in SIV infection. Science 280:427-431. [DOI] [PubMed] [Google Scholar]


