Abstract
Reliable measures of antifungal drug susceptibility are needed. We tested the susceptibility of Cryptococcus neoformans from patients treated with amphotericin B. In vitro susceptibility employed a modified broth macrodilution method. We demonstrate a strong correlation between the quantitative measures of in vitro amphotericin B susceptibility and the quantitative response observed in patients.
Physicians have long searched for a laboratory test that could predict the treatment response in patients with systemic fungal infections. Unfortunately, despite several decades of effort, no standard method for testing the susceptibility of Cryptococcus neoformans to antifungal drugs has been established (2, 5). A reproducible method for susceptibility testing has been proposed, but no interpretive guidelines have been identified (8-11).
(This work was presented in part at the 6th International Conference on Cryptococcus and Cryptococcosis, Boston, MA, June 2005.)
Patients.
Data and isolates were from patients in Thailand (1). Fifteen patients were treated with intravenous amphotericin B (AmB) alone at 0.7 mg/kg of body weight daily for 14 days. The patients' pretreatment severity of meningitis and quantitative responses at 14 days were measured by the numbers of C. neoformans isolates per milliliter of cerebrospinal fluid (CSF).
Mycology.
C. neoformans isolates recovered from CSF prior to treatment were stored at −20°C until use. The MICs for AmB for isolates from the 13 patients alive at day 14 were determined using the standard CLSI (formerly NCCLS) microtiter method and employing a broth macrodilution method modified to count the viable organisms after 48 h of incubation (9). Susceptibility for each isolate was measured on at least two separate occasions using a standard inoculum (500 CFU/ml) and an inoculum that corresponded to the numbers of CFU per milliliter in the pretreatment CSF (“patient-specific inoculum”). The inoculum was confirmed by quantitative culture. Susceptibility was retested if the inoculum was not within 8% of the target. Following 48 h of incubation, the number of CFU per milliliter at each concentration was determined. AmB concentrations ranged from 0 to 2.0 mg/liter.
Statistical analysis.
Local nonparametric regression was used to estimate the AmB concentration-response curve for each isolate (3, 4). If the 99% confidence intervals (CIs) for the response curves for the replicates for a given isolate did not overlap or if the CI width was greater than 2 log10, the susceptibility test was repeated. For each patient, the concentration of AmB that produced that patient's response was estimated by the point on the in vitro response curve where the in vitro response matched the patient response. Spearman's rank correlation was used to evaluate the association between in vitro response and patient response (6).
Results.
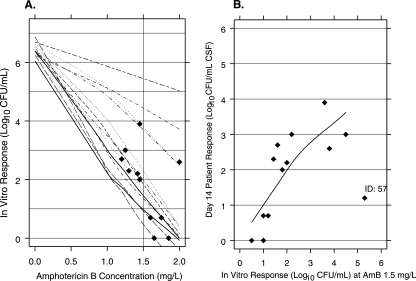
The number of CFU per milliliter in the pretreatment CSF ranged from 14,250 to 7,200,000 (4 to 7 log10). For the 13 patients alive at day 14, the number of CFU per milliliter in the CSF ranged from 0 to 7,800 (0 to 4 log10). Figure 1A shows the AmB concentration-response curve for each isolate. Each curve at the point where the in vitro response matches the patient response was indicated (Fig. 1A). The AmB concentration producing this response estimates the in vitro equivalent concentration (EC) that predicts the response in patients treated with AmB for 14 days. The two curves in Fig. 1A without a diamond are for isolates where the observed patient responses were lower than the in vitro responses at the highest concentration tested. Linear extrapolation was used to estimate the AmB EC for these two patients.
FIG. 1.
(A) Loess fit of the individual AmB concentration-response curve for each isolate using an in vitro inoculum corresponding to the baseline CFU per milliliter of CSF for each subject. A filled diamond shows the in vitro response matching the observed patient response at day 14, and the vertical line is drawn at 1.5 mg/liter of AmB, the estimated equivalent concentration. (B) Association between patient quantitative response at day 14 (vertical axis) and the in vitro responses to AmB at 1.5 mg/liter using patient-specific inocula (Spearman's rank correlation = 0.7 [P < 0.02]).
The median of the estimated concentrations was 1.5 mg/liter (95% CI, 1.3 to 1.7). The reproducibility of this estimated EC was assessed by measuring the susceptibility in the replicate (data not shown). In the replicates, the median concentration of AmB that predicts the patient's response was 1.5 mg/liter (95% CI, 1.3 to 1.7). Figure 1B shows the association between the in vitro responses at the AmB EC (1.5 mg/liter) and the patient responses. Spearman's rank correlation is 0.7, rejecting the null hypothesis of no association (P < 0.02).
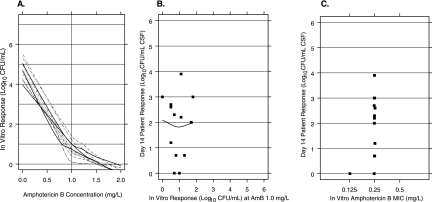
The susceptibility to AmB was also measured using a standard inoculum of 500 CFU/ml (Fig. 2A). The concentration-response curves for all isolates were similar. At an AmB concentration of 1.5 mg/liter, the responses for all isolates were less than 5 CFU. There was no association between in vitro response and patient response (Spearman's rank correlation, −0.08 [P = 0.77]) (Fig. 2B).
FIG. 2.
(A) Loess fit of the individual AmB concentration-response curve for each isolate using the standard inoculum (500 CFU/ml). The vertical line is drawn at 1.0 mg/liter of AmB, the concentration with the greatest range in the observed in vitro response. (B) Association between patient quantitative response at day 14 (vertical axis) and the in vitro responses to AmB at 1.0 mg/liter using the standard inocula (Spearman's rank correlation = −0.08 [P = 0.77]). (C) AmB MICs at 48 h.
The MICs obtained from the CLSI microdilution method are shown in Fig. 2C. The AmB MIC was 0.125 mg/liter for one isolate and 0.25 mg/liter for the others. This narrow range limits the use of MICs to predict patient response.
Discussion.
The goal of in vitro susceptibility testing is to predict patient response. We have previously demonstrated that the baseline severity of meningitis has a strong association with patient response (2, 12). It seems reasonable that the response of an individual patient could be affected by both the baseline fungal burden and the susceptibility of the patient's isolate. When susceptibility is measured using a standard inoculum, our results show no association with patient response. Thus, the challenge for susceptibility testing is to develop an in vitro model that measures the susceptibility of the individual strain in the context of the patient's fungal burden.
In this report, using the patient-specific inoculum, there was a strong association between in vitro response and patient response. In contrast, when a standard inoculum was employed, there was no correlation between in vitro response and patient response. To our knowledge, this is the first study to demonstrate an association between AmB susceptibility and treatment response for patients with cryptococcal meningitis. These results need to be confirmed in a prospective clinical trial, in which isolates are collected and quantitative measures of baseline fungal burden and response are recorded.
Our method for measuring susceptibility requires an estimate of the number of CFU per milliliter in the pretreatment CSF. In most clinical environments, this is not obtained. However, these counts can be obtained easily even in modestly equipped laboratories (see the supplemental material). However, our current methods are labor intensive. The association we demonstrate is based on the in vitro response at a single concentration of AmB (1.5 mg/liter). With additional isolates and clinical data, it may be possible to simplify the procedures to employ fewer concentrations.
The quantitative measure of in vitro susceptibility that we describe, if confirmed, could predict patient response to treatment with AmB alone in AIDS-associated cryptococcal meningitis. This will greatly facilitate decisions regarding treatment. For example, if the susceptibility for a patient indicates that a large number of viable organisms will remain after 14 days of AmB treatment alone, it may be prudent to combine AmB with another agent or to increase the duration of therapy (7, 13).
Supplementary Material
Acknowledgments
This work was supported in part by the Lancet International Fellowship (A.E.B.), Wellcome Trust Training Fellowship (A.E.B.), Netherlands Foundation of the Advancement of Tropical Research (WOTRO to A.E.B.), Wellcome Trust Advanced Training Fellowship (T.S.H.), St. George's Hospital Trustees, Wellcome Trust of Great Britain (support to Wellcome Trust-Mahidol University-Oxford Tropical Medicine Research Program), and the Infectious Diseases Society of America Pfizer Mycology Postdoctoral Fellowship Award (A.S.).
Footnotes
Published ahead of print on 23 October 2006.
Supplemental material for this article may be found at http://aac.asm.org/.
REFERENCES
- 1.Brouwer, A. E., A. Rajanuwong, W. Chierakul, G. E. Griffin, R. A. Larsen, N. J. White, and T. S. Harrison. 2004. Combination antifungal therapies for HIV-associated cryptococcal meningitis: a randomized trial. Lancet 363:1764-1767. [DOI] [PubMed] [Google Scholar]
- 2.Brouwer, A. E., P. Teparrukkul, S. Pinpraphaporn, R. A. Larsen, W. Chierakul, S. Peacock, N. Day, N. J. White, and T. S. Harrison. 2005. Baseline correlation and comparative kinetics of cerebrospinal colony-forming unit counts and antigen titers in cryptococcal meningitis. J. Infect. Dis. 192:681-684. [DOI] [PubMed] [Google Scholar]
- 3.Cleveland, W. S. 1993. Visualizing data. Hobart, Summit, NJ.
- 4.Cleveland, W. S., E. Grosse, and W. M. Shyu. 1991. Local regression models, p. 309-376. In J. M. Chambers and T. Hastie (ed.), Statistical models in S. Chapman and Hall, New York, NY.
- 5.Dannaoui, E., M. Abdul, M. Arpin, A. Michel-Nguyen, M. A. Piens, A. Favel, O. Lortholary, F. Dromer, and the French Cryptococcosis Study Group. 2006. Results obtained with various antifungal susceptibility testing methods do not predict early clinical outcome in patients with cryptococcosis. Antimicrob. Agents Chemother. 50:2464-2470. [DOI] [PMC free article] [PubMed] [Google Scholar]
- 6.Hollander, M., and D. A. Wolfe. 1973. Nonparametric statistical methods. Wiley, New York, NY.
- 7.Larsen, R. A., M. Bauer, A. M. Thomas, and J. R. Graybill. 2004. Amphotericin B and fluconazole, a potent combination therapy for cryptococcal meningitis. Antimicrob. Agents Chemother. 48:985-991. [DOI] [PMC free article] [PubMed] [Google Scholar]
- 8.Larsen, R. A., M. Bauer, A. M. Thomas, A. Sanchez, D. Citron, M. Rathbun, and T. S. Harrison. 2005. Correspondence of in vitro and in vivo fluconazole dose-response curves for Cryptococcus neoformans. Antimicrob. Agents Chemother. 49:3297-3301. [DOI] [PMC free article] [PubMed] [Google Scholar]
- 9.National Committee for Clinical Laboratory Standards. 2002. Reference method for broth dilution antifungal susceptibility testing of yeasts, 2nd ed. Approved standard M27-A2. National Committee for Clinical Laboratory Standards, Wayne, PA.
- 10.Pfaller, M. A., and W. L. Yu. 2001. Antifungal susceptibility testing. New technology and clinical applications. Infect. Dis. Clin. N. Am. 15:1227-1261. [DOI] [PubMed] [Google Scholar]
- 11.Rex, J. H., M. A. Pfaller, J. N. Galgiani, M. S. Bartlett, A. Espinel-Ingroff, M. A. Ghannoum, M. Lancaster, F. C. Odds, M. G. Rinaldi, T. J. Walsh, A. L. Barry, and the Subcommittee on Antifungal Susceptibility Testing of the National Committee for Clinical Laboratory Standards. 1997. Development of interpretive breakpoints for antifungal susceptibility testing: conceptual framework and analysis of in vitro-in vivo correlation data for fluconazole, itraconazole, and Candida infections. Clin. Infect. Dis. 24:235-247. [DOI] [PubMed] [Google Scholar]
- 12.Robinson, P. A., M. Bauer, M. A. Leal, S. G. Evans, P. D. Holtom, D. A. Diamond, J. M. Leedom, and R. A. Larsen. 1999. Early mycological treatment failure in AIDS-associated cryptococcal meningitis. Clin. Infect. Dis. 28:82-92. [DOI] [PubMed] [Google Scholar]
- 13.van der Horst, C. M., M. S. Saag, G. A. Cloud, R. J. Hamill, J. R. Graybill, J. D. Sobel, P. C. Johnson, C. U. Tuazon, T. Kerkering, B. L. Moskovitz, W. G. Powderly, and W. E. Dismukes. 1997. Treatment of cryptococcal meningitis associated with the acquired immunodeficiency syndrome. National Institute of Allergy and Infectious Diseases Mycoses Study Group and AIDS Clinical Trials Group. N. Engl. J. Med. 337:15-21. [DOI] [PubMed] [Google Scholar]
Associated Data
This section collects any data citations, data availability statements, or supplementary materials included in this article.


