

Abstract
Activation of the oxidative burst is one of the earliest biochemical events in microglial activation, but it is not understood yet how free radicals participate in inflammatory signaling. To determine the role that specific reactive oxygen species play in microglial activation, the levels of SOD1 were manipulated in N9 murine microglia. Stable overexpression of SOD1 caused significant decreases in superoxide and nitric oxide production, with concurrent increases in hydrogen peroxide following LPS. However, LPS-induced activation of NFκB, and release of TNFα and IL-6 were significantly attenuated in SOD1 overexpressing cells, as was the ability of microglia to induce toxicity in cultured neurons. Conversely, acute inhibition of SOD1 with disulfiram was associated with increased nitric oxide and cytokine release, and increased neurotoxicity. Together, these data suggest that superoxide radicals in microglia play important roles in directing redox-sensitive inflammatory signaling and initiating neurotoxic inflammation.
Keywords: cytokines, inflammation, NFκB, oxidative stress, redox signaling
1. INTRODUCTION
The microglial cell is a member of the monocyte/macrophage family, and is the brain-resident immunocompetent cell. In the normal adult CNS, microglia display a quiescent phenotype, characterized by low expression of the leukocyte common antigen (CD45), absent endolytic and phagocytic activity, and low/undetectable expression of cell surface immune effector ligands (Aloisi, 2001). While the function of resting microglia is not understood, microglial cells rapidly transform to an activated state in response to brain injury or infection (Nelson et al., 2002), (Ling et al., 2001), (Streit et al., 1999). Indeed, activated microglia are important participants in local cell-mediated immunity, as these cells are both phagocytic and potent sources of reactive oxygen and nitrogen intermediates (Colton and Gilbert, 1987), (Banati et al., 1993), (Banati et al., 1993), (Gehrmann et al., 1995), (Piani and Fontana, 1994). While it is generally accepted that reactive microglia are involved in the removal of debris from degenerating neurons (Rozemuller et al., 1989), (Moller et al., 1996), it is hypothesized that microglial activation can exacerbate neuronal injury (McGeer et al., 1988), (Itagaki et al., 1989), (Giulian et al., 1995). The oxidative, or respiratory, burst is the metabolic production of reactive oxygen species (ROS) that occurs in phagocytes, as part of their anti-microbial arsenal. However, accumulating experimental evidence suggests that free radical production in brain-resident immune cells plays important roles not just in anti-microbial functions but also in orchestrating intracellular proinflammatory signaling cascades (for review see (Forman and Torres, 2001), (Droge, 2002)). For instance, activation of the oxidative burst system has been specifically implicated in the induction of well-known inflammatory signaling pathways, including activation of NFκB, and synthesis of TNFα (Kaul and Forman, 1996) and prostaglandin E2 (Wang et al., 2004). Similarly, levels of reduced glutathione in macrophages tightly regulate the release of many immune mediators, including prostaglandins, interleukin-4, interleukin-6, and interleukin-12 (Murata et al., 2002), (Dobashi et al., 2001).
A major endogenous antioxidant in mammalian cells is the enzyme superoxide dismutase (SOD), which catalyzes the dismutation of the superoxide anion (O2-) into hydrogen peroxide (H2O2) and molecular oxygen (O2). Many studies have shown that increased expression of CuZnSOD (SOD1) in cells or animals can attenuate neuronal injury (Barkats et al., 1996), (Chan et al., 1998) but the exact mechanisms of such protection remain unclear. Hence, it is possible that the neuroprotective properties of SOD1 could be related to altered or attenuated brain inflammation. Indeed, it has been shown that transient overexpression of SOD1 in microglial cells leads to decreased cytokine release, suggesting that SOD1 could act to attenuate or control microglial reactivity (Chang et al., 2001). However, other published reports suggest that superoxide radicals themselves act to decrease microglial reactivity in either peritoneal macrophages (Marikovsky et al., 2003), or in intestinal neutrophils (Keenan et al., 2005). Thus, a thorough and careful study of the role of SOD1 in microglial reactivity that accounts for both inflammatory signaling and evoked neurotoxicity is well warranted. Indeed, as microglia are rapidly activated and recruited to sites of inflammation or neurodegeneration in the brain, it is essential to determine under which circumstances SOD could act to control or attenuate prevent destructive inflammatory processes in these cells. In the present study, SOD1 activity was modulated in N9 microglial cells either via pharmacological inhibition with disulfiram or via stable overexpression of a human SOD1 clone, and the resultant effects of SOD1 manipulation on both intracellular and intercellular oxidative and inflammatory signaling were determined. Specifically, the balance of superoxide, hydrogen peroxide, and nitric oxide production was measured, as was NFκB activation in response to inflammatory stimuli. Additionally, cytokine release and microglial-mediated neuronal toxicity were also determined.
2. MATERIALS AND METHODS
Cell culture
N9 murine microglial cells (kindly provided by Dr. Paola Ricciardi-Castagnoli, University of Milano-Bicocca, Milan, Italy) were cultured in Iscove's Modified Dulbecco's Medium (IMDM, GIBCO Inc., Gaithersburg, MD) supplemented with 10% heat-inactivated FBS (GIBCO), 1% v/v antibiotic-antimycotic (GIBCO), and 25 μM β-mercaptoethanol (Sigma, St. Louis, MO). N2a cells (ATCC, Manassas, VA) were grown using the same culture conditions above except for the substitution of 50% Opti-MEM (GIBCO) + 50% Dulbecco's Minimal Essential Medium (DMEM, GIBCO) in place of the IMDM.
Generation of cells with stable overexpression of human SOD1
N9 cells were cultured in 60 mm dishes at a starting concentration of 3 × 10⁶ cells per dish for 24 h. A solution of 2 μg of empty vector DNA (pBR322) or the construct containing the human SOD1 genomic DNA (Elroy-Stein et al., 1986) and 6 μl Fugene 6 (GIBCO) in 100 μl serum-free IMDM was pre-incubated at 37°C for 45 min before it was added to N9 cells. Cells were kept for 4 h to allow transfection in a 37°C incubator and 1 ml IMDM + 20% FBS was then added to each dish. Cultures were grown for 24 h, after which the medium was replaced with complete IMDM-10% FBS supplemented with 600 μg/ml G418 antibiotic. The cells were then grown until 80% confluency, and then transferred into T-75 culture flasks and kept in medium with G418 to maintain the transfectants.
Western Blot
N9 cells transfected with either the empty vector (N9-pBR) or human SOD1-cDNA (N9-SOD1) were harvested, pelleted, and lysed by freeze/thaw followed by sonication. Equivalent amounts of protein were electrophoretically separated on 10% SDS-PAGE gels (BioRad Laboratories, Hercules, CA) as described previously (Bruce-Keller et al., 2000). Separated proteins were transferred to nitrocellulose membranes, immunoreacted with a polyclonal antibody (clone G-FL154) to human SOD1 (sc1147, Santa Cruz Biotechnology, Santa Cruz, CA), and incubated in horseradish peroxidase-conjugated secondary polyclonal antibody to rabbit Ig (Vector Laboratories, Burlingame, CA). The membranes were developed using an enhanced chemiluminescence kit (Amersham, Piscataway, NJ) for autoradiography.
Analysis of cell growth and viability
Viability and growth patterns of the N9-pBR and N9-SOD1 cells was determined under both basal and LPS-stimulated conditions using both 3-[4,5-dimethylthiazol-2-yl]-2,5-diphenyl tetrazolium bromide (MTT) conversion and trypan blue dye exclusion techniques. The percentage of viable cells was enumerated by suspending cells with 0.01% trypan blue (Sigma) and counting the numbers of bright colorless cells (viable) and blue cells (dead) to determine % viability. The proliferation rate of viable cells was also assessed using MTT after increasing times of treatment in vitro, as described previously (Dimayuga et al., 2003).
Analyses of free radical production
N9-pBR and N9-SOD1 cells were harvested by incubation with warm 0.05% EDTA and suspended at 1 × 10⁷ cells per ml. The cells were incubated for 20 min at 37°C and 5% CO2 in the dark with either 10 μM 2′, 7′-dichlorofluorescein diacetate (H2DCFDA, Molecular Probes, Eugene, OR) for the measurement of hydrogen peroxide (H2O2), 2 μM dihydroethidium (DHE, Molecular Probes) for the measurement of superoxide, or 10 μM dihydrorhodamine 123 (DHR) for the detection of peroxynitrite. The cells were washed again, and 100 μl of dye-loaded cells (1 × 10⁶ total cell number) were incubated with 100 μl of appropriate dilutions (equivalent to 2x final concentration) of lipopolysaccharide (LPS), phorbol myristate acetate (PMA), or interferon gamma (IFNγ) for 15 min at 37°C in the dark. Treated cells were then immediately analyzed for oxidant production. Superoxide production was assessed using a MOFlo cytometer (Cytomation, Inc., Fort Collins, CO) with the argon laser set at wavelength excitation of 488 nm and detection of emitted fluorescence at >650nm. DCF and DHR oxidation was assessed with detection settings between 500 and 530 nm on a BD FACSCalibur cytometer (BD Biosciences, San Jose, CA) and flow cytometric analysis of a minimum of 3 × 10⁴ cells for each data point was performed using CellQuest Pro software.
NO assay
N9-pBR and N9-SOD1 cells were cultured with serum- and phenol-red-free IMDM and stimulated with 1 μg/ml LPS for 24 h at 37°C. The culture supernatant was then collected and mixed with an equivalent volume of Griess reagent (0.1% naphthylethylenediamine dihydrochloride and 1% sulfanilamide in 5% phosphoric acid) in 96-well plates. Absorbance was read on a plate reader at 540 nm against a series of sodium nitrite (Sigma) standards ranging from 1 to 100 μM.
Electrophoretic mobility shift assays (EMSAs)
Cell cultures were treated for various times with 1 μg/ml LPS and harvested for preparation of subcellular fractions using a nuclear extraction kit (Active Motif, Calsbad, CA). Aliquots of 10 μg of nuclear extract were incubated with 5 μl reaction buffer (10 mM Tris-HCl, pH 7.5, 50 mM NaCl, 1 mM DTT, 1 mM EDTA, 5% glycerol, 2 μg poly(dI-dC).poly(dI-dC), 0.3% NP-40 and 1μg BSA) in the absence and presence of competitor for 20 min on ice, after which the radiolabelled probe (>20,000 cpm) was added to the mixture and incubated for an additional 10 min at RT. The labeled reaction mixtures were then electrophoretically separated on 5% TBE non-denaturing polyacrylamide gels (Criterion, BioRad). Gels were then dried on 3M Whatman filter paper and exposed to film for autoradiographic analysis.
To create the κB sequence probes, 1 μg each of plus(+) and minus (−) single-stranded oligonucleotides (Invitrogen) were heated to 95° C in 70 μl volume of 1x T4 polynucleotide kinase (PNK) buffer for 10 min and allowed to anneal by gradually cooling to room temperature (RT). The kinase labeling reaction was carried out for 2 h at 37° C on 2 μl annealed oligonucleotide in 20 μl volume (1x PNK buffer, 100 mM DTT, 0.15 μg T4 polynucleotide kinase (Promega Biosciences, San Luis Obispo, CA), 600 Ci/mmol [γ-32P] ATP (Perkin-Elmer, Boston, MA). The labeled oligos were purified from unincorporated radiolabel by passing through a G50 column.
Enzyme linked immunosorbent assays (ELISA)
Cell culture media was collected after cell treatments, centrifuged to remove cells, and frozen at −20°C until used for measurement of cytokine levels as described previously (Bruce-Keller et al., 2001) by sandwich ELISA. IL-6 and TNF-α was measured in cell supernatants by sandwich ELISA method using a Duoset kit (R&D Systems, Minneapolis, MN) performed in accordance with manufacturer's suggestions.
Conditioned medium and neuronal viability assay
N9-pBR and N9-SOD1 cells were seeded into 96-well plates and then switched to a serum-free co-culture medium composed to 50% IMDM/25% DMEM/25% Opti-MEM after 24 h. Cells were then exposed to 100 ng/ml and 1μg/ml of LPS for 4 h with or without 0.3 μM DSF, after which cells were rinsed to remove LPS, and then allowed to incubate for an additional 24 h in fresh serum-free medium. This conditioned medium was then collected and applied immediately to N2a cells for 18 h, after which N2a cell viability was determined using MTT.
Co-culture apoptosis assay
Microglia (N9)-neuronal (N2a) co-cultures were set by culturing 5 × 10⁵ viable N9 cells with 5 × 10⁵ viable N2a cells in 1 ml co-culture medium for 12 h at 37°C. Co-cultured cells were then harvested with 0.05% EDTA and assayed for apoptosis using a modified version of a previously described protocol (Reid et al., 1996) using dual staining for live cells with the DNA stain Hoechst 33342 (Sigma) and Merocyanin 540 (Molecular Probes). Briefly, cells were suspended in 0.9 ml phenol-red free IMDM-2% FBS to which 100 μl of 50 μg/ml Hoechst 342 was added and incubated for 30 min at 37°C. Cells were then washed and resuspended in 100 μl medium, after which Merocyanin 540 (0.5 μg/ml final concentration) was added to each tube and incubated at room temperature in the dark for 20 min. Cells were then washed again, and 1 μg/ml F4/80-FITC antibody (Serotec, Raleigh, NC) was added to each tube and incubated in the dark for 30 min on ice to stain microglial cells. After a final wash, cell suspensions were stored on ice until data acquisition on a MoFlo cytometer with the argon laser set at 488 nM to detect MC540 and the UV laser excitation at 351 nM to detect Hoechst from N2a cells from each sample, while gating out the N9 microglia by their FITC staining at 610nM.
Statistical analyses
All data were analyzed using one-way ANOVA followed by Bonferroni/Dunn's post-hoc analysis to determine statistical significance. P-values < 0.05 were designated as statistically significant and are indicated in the text as *, **, or *** corresponding to p values < 0.05, < 0.01, or < 0.001, respectively.
3. RESULTS
Generation of microglial cells that overexpress human SOD1
N9 microglia were stably transfected with either an empty pBR vector or the hSOD1-DNA (Elroy-Stein, Bernstein et al., 1986) as outlined in Methods. To verify increased expression of SOD1 in the transfected cells, cell lysates were prepared from naïve N9 cells, empty vector-transfected cells (N9-pBR), and from SOD1-transfected cells (N9-SOD1) for analysis by Western blot. SOD1 protein expression was markedly increased in SOD1 cells as compared to either naïve N9 or N9-pBR cells (Fig. 1). Densitometric quantification of band intensity of over 9 independent samples revealed a significant increase in SOD1 expression in SOD1 transfected cells that was on average increased 2-3 fold over levels detected in N9-pBR cells (data not shown).
Figure 1.
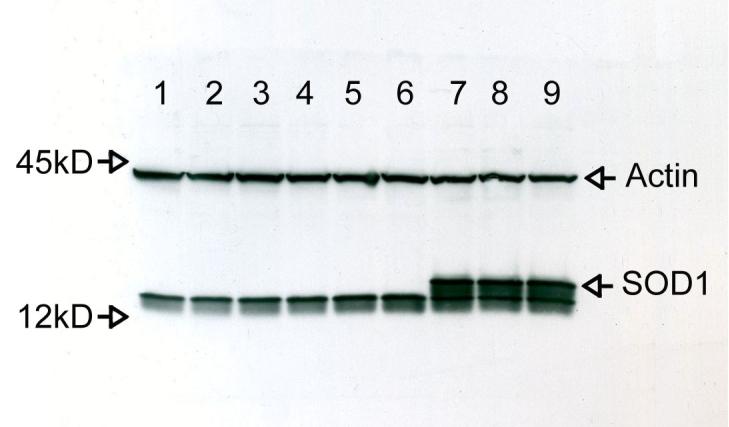
SOD1 expression in naïve and transfected N9 microglia. Naive N9, N9-pBR cells, and N9-SOD1 cells were generated as outlined in Methods. Cell lysates were prepared and samples containing 30 μg of total protein were separated on 15% SDS-PAGE gels and blotted on nitrocellulose membranes. Naive N9 were loaded in lanes 1-3, N9-pBR in lanes 4-6, and N9-SOD1 in lanes 7-9. As a loading control, the blot was then stripped and immunoreacted with anti-actin antibody. These images are representative of three experiments with identical trends in protein expression levels detected.
Cellular viability and proliferation are not affected by manipulation of SOD1
As SOD1 is one of the major free radical scavenging enzymes, it was first determined if modulation of SOD1 affected either the viability or proliferation of N9 cells. To determine if N9 cell proliferation was affected by overexpression of SOD1, naïve N9, N9-pBR, and N9-SOD1 cells were plated at an exact density of 2 × 10⁵ cells/ml, and allowed to proliferate. Cell number was assessed at 24, 48, and 72 h using MTT, as described in Methods. Overexpression of SOD1 did not affect basal proliferation of cells in culture as measured by MTT (Fig. 2A). To next determine if cell viability in response to LPS stimulation was altered by SOD1 overexpression, naïve N9, N9-pBR, and N9-SOD1 cells were exposed to 100 ng/ml or 1 μg/ml LPS for 24 h. Cell viability was based on analyses of trypan blue exclusion as described in Methods, and data show that SOD1 overexpression did not significantly affect cell viability/integrity following LPS exposure (Fig. 2B). Finally, to verify that acute SOD inhibition with DSF did not adversely affect microglial viability, naïve N9, N9-pBR, and N9-SOD1 cells were exposed to 0.3 μM DSF for 6h, followed by exposure to 1 μg/ml LPS for 24 h. DSF is a dithiocarbamate has been shown to inhibit SOD1 activity both in vivo (Frank et al., 1977), (Marikovsky et al., 2002) and in vitro (Marikovsky, Ziv et al., 2003), presumably through interaction and/or chelation of the copper moieties. This regimen of DSF is associated with an approximate 50% decrease in SOD activity in both N9-pBR and N9-SOD1 cells (data not shown). Cell viability following DSF/LPS exposure was based on analyses of trypan blue exclusion as described in Methods, and data show that SOD1 inhibition did not significantly affect cell viability/integrity following LPS exposure (Fig. 2C).
Figure 2.

Proliferation and viability in naïve N9, N9-pBR, and N9-SOD1 cells. (A) Naïve N9, N9-pBR, and N9-SOD1 cells were plated at an exact density of 2 × 10⁵ cells/ml, and allowed to proliferate for 24, 48, and 72 h. Cell number was assessed using MTT as described in Methods, and data represent the mean of three or more separate experiments. (B) Naïve N9, N9-pBR, and N9-SOD1 cells were exposed to 0.1 or 1 μg/ml LPS for 24 h, after which the percent viable population was determined based on cell counts of the number of trypan blue positive (injured) and negative (non-injured) cells. Data represent means ± S.E.M. of 4 separate experiments, with all data points measured in triplicate. (C) Naïve N9, N9-pBR, and N9-SOD1 cells were exposed to 0.3 μM DSF for 6h, followed by exposure to 1 μg/ml LPS for 24 h. The percent viable population was then determined by trypan blue exclusion, as described in Methods. Data represent means ± S.E.M. of 2 separate experiments, with all data points measured in triplicate.
SOD1 overexpression disrupts ROS production in response to inflammatory stimuli
To evaluate the levels of oxidant species in cells overexpressing SOD1, superoxide anion, hydrogen peroxide, and peroxynitrite production was measured in control and transfected cells, using dihydroethidium (DHE), dichlorofluorescein (H2-DCFDA), and dihydrorhodamine 123 (DHR), respectively. N9-pBR and N9-SOD1 were loaded with either DHE, H2-DCFDA, or DHR, and then stimulated with LPS, PMA, or IFNγ for 15 min, and analyzed by flow cytometry as described in Methods. Analysis of free radical production from DHE-loaded N9-pBR and N9-SOD1 cells demonstrated that superoxide (O2·-) levels in N9-SOD1 microglia were significantly decreased in comparison to control N9-pBR cells at all concentrations of LPS tested (Fig. 3A). Conversely, FACS analysis of H2-DCFDA, which measures predominantly the production of hydrogen peroxide (H2O2), indicated that peroxide levels were significantly increased in SOD1-overexpressing microglia compared to the control N9-pBR cells (Fig. 3B). Finally, as superoxide is known to react with nitric oxide (·NO) resulting in peroxynitrite anion production, which has been shown to occur in CNS pathology (Beckman and Crow, 1993), we calculated peroxynitrite formation via DHR labeling of N9-pBR and N9-SOD1 cells. Data show that overexpression of SOD1 significantly attenuates peroxynitrite production following administration of IFNγ or LPS+IFNγ (Fig. 3C).
Figure 3.

Superoxide and hydrogen peroxide production in N9-pBR and N9-SOD1 cells. N9-pBR and N9-SOD1 were grown as described in Methods, and incubated with the dye probes at 37°C for 20 min, and then dye-loaded cells were exposed to 0, 1, 10, 20, 40 μg/ml LPS, or 1 μg/ml PMA for 15 min at 37°C as described in Methods. (A) To measure superoxide production, cells loaded with 2 μM dihydroethidium (DHE) were analyzed for superoxide production by measurement of fluorescence on a MOFlo cytometer, as described in Methods. (B) To measure H2O2 production, cells were loaded with 10 μM 2′, 7′-dichlorofluorescein diacetate (H2DCFDA), and after LPS stimulation, green fluorescence of oxidized DCF was measured by flow cytometric analysis as outlined in Methods. (C) Peroxynitrite levels were also assayed using dihydrorhodamine (DHR) labeling of IFN-γ and LPS-stimulated cells by flow cytometric analysis as outlined in Methods. Data represent mean fluorescence intensity (MFI) reading acquired from 2 × 10⁴ cells from each sample, and are representative of results from 3 experiments, with data point resulting from the average of 3 samples per treatment. *** indicates significant (p<0.001) differences between N9-SOD1 MFI values compared to corresponding N9-pBR values. ### indicates significant (p<0.001) increases in MFI induced by LPS-, PMA-, or IFNγ-treatment as compared to untreated control cells.
In addition to ROS, reactive nitrogen species (RNS) from activated or damaged microglia can be a major cause of oxidative stress and altered signaling in the nervous system. We therefore determined both basal and LPS-stimulated nitrite levels in the supernatants of N9-pBR and N9-SOD1 cells as described in Methods. Data show that basal release of nitrite was similar from both types of cells (Fig. 4). However, in response to LPS stimulation, nitrite production by N9-SOD1 cells was significantly decreased in comparison to N9-pBR cells (Fig. 4). Furthermore, inhibition of SOD1 activity by exposure to 0.3 μM DSF for 6h prior to LPS exposure significantly increased LPS-induced nitrite release from both N9-pBR and N9-SOD1 cells (Fig. 4).
Figure 4.

LPS-stimulated nitric oxide production in N9-pBR and N9-SOD1 microglia. N9 cell lines were plated and exposed to 1 μg/ml LPS for 24 h. Nitrite production was measured using Griess reagents and absorbance was read at 540 nm against a series of sodium nitrite standards as described in Methods. Each data point represents the mean ± S.E.M. of three or more separate experiments, with all values measured in quadruplicate sets. *** indicates significant (p<0.001) differences between nitrite release from N9-SOD1 cells compared to corresponding N9-pBR cells. ### and ## indicate significant (p<0.01 and p<0.001, respectively) increases in nitrite release LPS as compared to untreated cells, while ‡ and ‡‡ indicate significant (p<0.05 and p<0.01, respectively) increases in nitrite release in cells treated with combined LPS and DSF compared to cells treated with LPS alone.
SOD1 overexpression attenuates NFκB activation and cytokine release in response to inflammatory stimuli
A number of studies have begun to unravel the signal transduction pathways responsible for mediating microglial activation, demonstrating important roles for NFκB activation in this process (reviewed in (Mattson and Camandola, 2001)). As NFκB is known to be responsive to oxidative burst activity (Kaul and Forman, 1996), (Westendorp et al., 1995), we analyzed the pattern of NFκB activation in both N9-pBR and N9-SOD1 cells following treatment with 1 μg/ml LPS for 0, 15, 30, 45 and 60 min by EMSA, as described in Methods. Evaluation of gel shifts indicated that while LPS did elicit the rapid and sustained activation of NFκB in N9-pBR cells, there was no clear increase in NFκB binding in nuclear lysates from N9-SOD1 cells following LPS treatment (Fig. 5).
Figure 5.

LPS-stimulated NFκB activation in N9-pBR and N9-SOD1 microglia. Subcellular fractions were prepared as outlined in Methods from N9 cell lines treated with 1 μg/ml LPS for 0, 15, 30, 45, and 60 min. 10 μg nuclear extract was incubated with reaction buffer with or without competitor antibody for 20 min on ice, radiolabelled probe was added to the mix, and then incubated for another 10 min at RT. The labeled reaction mixtures were then electrophoretically separated on 5% non-denaturing polyacrylamide gels which were dried on filter paper and autoradiographed. This gel image is representative of 2 separate experiments performed under identical conditions.
To test how SOD1 activity affects microglial cytokine production, N9-pBR and N9-SOD1 cells were treated with 1 μg/ml LPS for 0, 24 or 48 h and the supernatants were tested for TNF-α and IL-6 using ELISA as described in Methods. LPS caused significant, time-dependent increases in both TNF-α and IL-6 secretion from control pBR microglia (Fig. 6A, B). However, LPS-induced release of both TNF-α and IL-6 was significantly reduced in N9-SOD1 cells as compared to N9-pBR cells (Fig. 6A and B). Conversely, treatment of both N9-pBR and N9-SOD1 cells with 0.3 μM DSF to inhibit SOD activity significantly increased LPS-induced TNF release from both N9-pBR and N9-SOD1 cells (Fig. 6C), but did not significantly affect LPS-induced IL-6 secretion (Fig. 6D).
Figure 6.

LPS-stimulated cytokine production in N9-pBR and N9-SOD1 microglia. N9 cell culture supernatants were applied to (A) anti-TNFα or (B) anti-IL-6 antibody-coated plates and processed for ELISA testing as elaborated in Methods to determine cytokine levels after 0, 24, and 48 h treatment with 1 ug/ml LPS or vehicle (IMDM). Alternatively, cells were treated with either vehicle or 0.3 μM DSF for 6 h before exposure to 1 ug/ml LPS for 24 hours, and supernatants applied to (C) anti-TNFα or (D) anti-IL-6 antibody-coated plates. Data are the mean ± SEM of at least 2 separate experiments with each sample measured in triplicate. Raw experimental data were analyzed by ANOVA as described in Methods. *** indicates significant (p<0.001) differences between cytokine release from N9-SOD1 cells compared to release from N9-pBR cells. ### and ## indicate significant (p<0.01 and p<0.001, respectively) increases in cytokine release LPS as compared to untreated cells, while ‡ and ‡‡ indicate significant (p<0.05 and p<0.01, respectively) increases in TNFα release in cells treated with combined LPS and DSF compared to cells treated with LPS alone.
Overexpression of human SOD1 decreases microglial-mediated neuronal injury
Microglial activation has been repeatedly documented in the context of brain injury in vivo, with many investigators proposing a critical role for microglia in promoting neuronal injury (reviewed in (Nelson, Soma et al., 2002)). To determine if the inhibitory properties of SOD1 on inflammatory signaling translated to a decreased ability of these cells to induce neuronal injury, we analyzed microglial-mediated neuronal injury using both conditioned medium and cell contact-based assays. Microglial-mediated cell death was first assessed using conditioned medium-based assays, as described in Methods. For these experiments, N9-pBR and N9-SOD1 cells were treated with 100 ng/ml or 1 μg/ml of LPS for 4 h, and then allowed to condition serum-free medium for 24 h. Neuronal N2a cells were then exposed to this conditioned medium for 18 h, after which cell viability was measured by MTT as described in Methods. LPS caused significant, dose-dependent toxic effects in N9-pBR cells to decrease MTT in N2a cells, with significant toxicity induced by both doses of LPS used (Fig. 7A). However, medium conditioned by N9-SOD1 cells was significantly less toxic to N2a cells, with no toxicity induced by 100 ng/ml LPS (Fig. 7A). Conversely, when N9-pBR and N9-SOD1 cells were treated with 0.3 μM DSF to inhibit SOD activity prior to LPS exposure, LPS-induced microglial-mediated neurotoxicity was significantly exacerbated in control pBR cells, but not N9-SOD1 cells (Fig. 7B).
Figure 7.
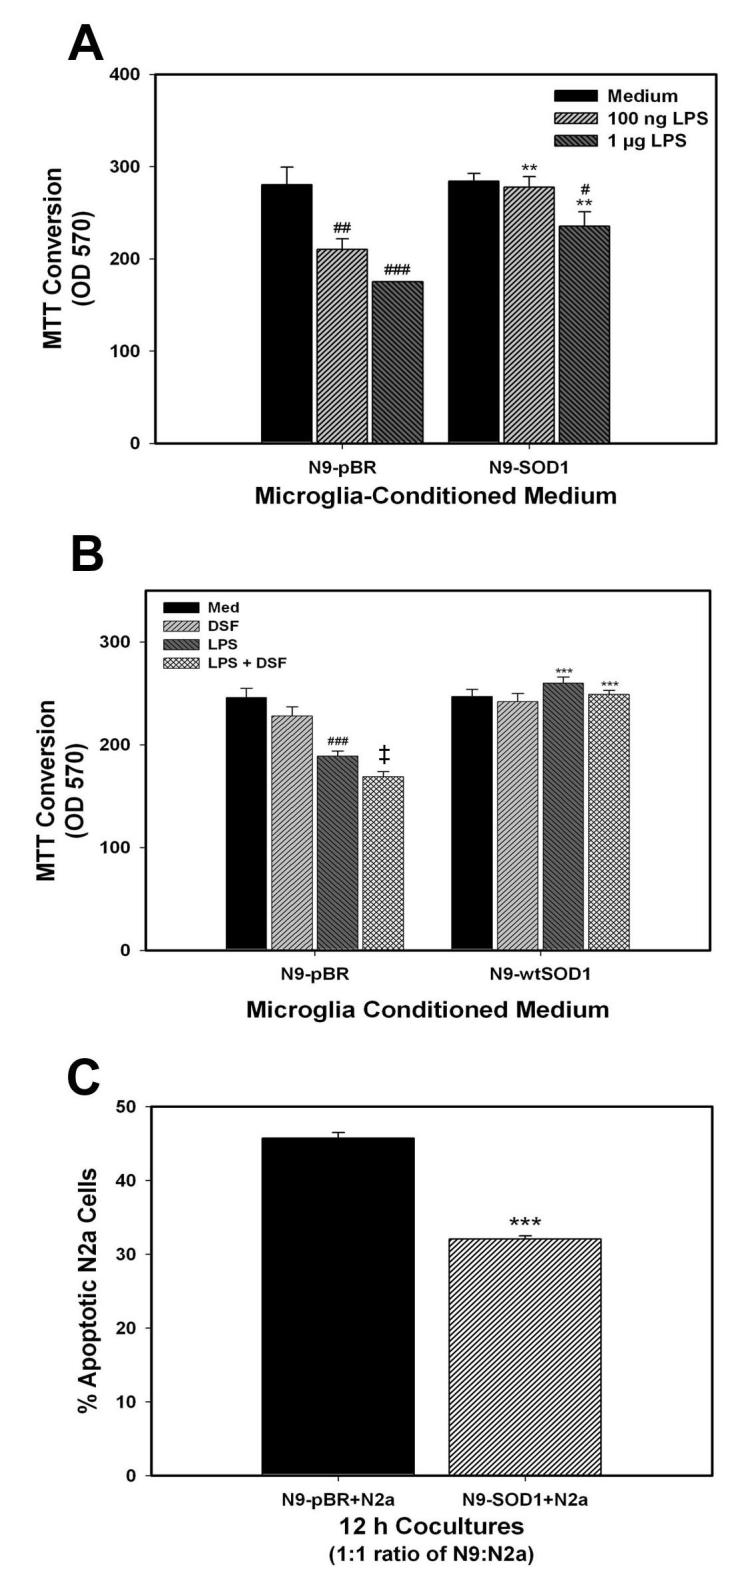
Neurotoxicity induced by N9-pBR and N9-SOD1 microglia. (A) For conditioned medium experiments, N9-pBR and N9-SOD1 were cultured in 96-well plates, and exposed to vehicle (Medium), 100 ng/ml LPS, or 1μg/ml of LPS for 4 h as described in Methods. The N9 cells were rinsed to remove LPS, and then incubated in fresh serum-free medium for another 24 h to generate the conditioned medium. The microglial-conditioned media were harvested from the N9 cultures and immediately applied to N2a cells into 96-well plates for an additional 18 h as described in Methods. Microglial-mediated neurotoxicity was measured using MTT. Data represent the mean ± S.E.M. of 3 separate experiments, with all data points measured in triplicate. Raw experimental data were analyzed by ANOVA as described in Methods. ** indicates significant (p<0.01) differences between MTT values of N2a cells treated with N9-SOD1 conditioned medium compared to the cells treated with N9-pBR conditioned medium. #, ##, and ### indicate significant (p<0.05, p<0.01. and p<0.001, respectively) decreases in N2a viability induced by exposure to medium conditioned by LPS-treated cells. (B) To determine the effect of SOD1 inhibition on microglial-mediated neurotoxicity, N9-pBR and N9-SOD1 were treated with vehicle (Med) or 0.3 μM DSF for 6 h before exposure to 100 ng/ml LPS for 4 h. Microglial-mediated neurotoxicity was measured using MTT as described, and data represent the mean ± S.E.M. of 2 separate experiments, with all data points measured in triplicate. *** indicates significant (p<0.001) differences between MTT values of N2a cells treated with N9-SOD1 conditioned medium compared to the cells treated with the corresponding N9-pBR conditioned medium. ### indicates significant (p<0.001) decreases in N2a viability induced by exposure to medium conditioned by LPS-treated cells, while ‡ indicates significant (p<0.05) increases in microglia-mediated neurotoxicity from cells treated with combined LPS and DSF compared to cells treated with LPS alone. (C) For direct co-culture experiments, 5 × 10⁵ N9 cells were co-incubated with 5 × 10⁵ N2a cells in 1 ml co-culture medium for 12 h at 37°C. The cells were then harvested, pelleted by centrifugation, and resuspended in 1 ml phenol-red-free IMDM + 2% FBS. Cells were then further processed by sequential staining steps using Hoechst 33342, Merocyanin-540, and anti-F4/80-FITC antibody. Using flow cytometry, the N9 cells were gated out, and the percentage of the N2a population that were apoptotic was determined as described in Methods. Data represent the mean ± S.E.M. of 3 separate experiments, with all data points measured in triplicate samples. Each separate reading (% apoptotic N2a cells) was acquired from 5 - 6 × 10⁴ cells from the co-culture sample. Results were analyzed by ANOVA as described in Methods and *** indicates statistically significant (p>0.001) decreases in the percentage of apoptotic N2a cells co-cultured with N9-SOD1 compared to the control N2a co-cultured with N9-pBR.
Microglia-mediated neurotoxicity was also measured using a co-culture paradigm. In this system, microglial N9 and neuronal N2a cells are co-cultured together at a 1:1 ratio for 12 h, after which the microglia are gated out and neuronal apoptosis measured via FACS, as described in Methods. The percentage of N2a cells undergoing apoptosis following 12 h exposure to N9-pBR cells was approximately 45% (Fig. 7C). However, expression of SOD1 by N9 cells significantly reduced apoptosis in co-cultured N2a cells to near 30% (Fig. 7C).
4. DISCUSSION
This manuscript documents the significant role that superoxide dismutase plays in inflammatory signaling in microglia. Specifically, we show that overexpression of SOD1 in microglial cells leads to significant decreases in superoxide levels, with corresponding increases in hydrogen peroxide levels. LPS-induced activation of NFκB is blunted in SOD1 overexpressing cells, illustrating the critical role of superoxide anion in inflammatory signal transduction. Release of the pro-inflammatory cytokines TNFα and IL-6 is also significantly attenuated by overexpression of SOD1, as is the ability of the cells to elicit neuronal injury. Conversely, acute inhibition of SOD1 activity with disulfiram was associated with increased nitric oxide and cytokine release, and increased neurotoxicity. Overall, these data support a specific and central role for superoxide anion in directing inflammatory signaling in microglia, with critical implications for microglial/neuronal interactions.
ROS, including superoxide anion, hydroxyl radical, and hydrogen peroxide may have multiple roles in neurodegenerative diseases. While intended to kill invading pathogens, ROS generated specifically by activated microglia could very logically contribute to brain injury by inducing lipid peroxidation, DNA fragmentation and protein oxidation in surrounding cells – a phenomena called “bystander lysis” (McGeer and McGeer, 1997). It is important to note that while microglial activation has been repeatedly documented in the context of brain injury in vivo, exact cause and effect relationships between microglial activation and neuronal injury have not been completely established. However, our cell culture data clearly show that cultured microglia can induce significant toxicity in cultured neurons, both through conditioned medium and direct contact-based assays. There are several mechanisms whereby an altered redox environment in microglia could evoke neuronal injury in these model systems, but a relevant and attractive theory involves microglial-mediated excitotoxicty. Indeed, while microglia have been reported to take up extracellular glutamate through specific transporters (Nakajima et al., 2001), these cells release physiologically relevant concentrations of glutamate via action of a membrane associated cystine-glutamate anti-porter (Xc) whose expression is significantly upregulated in activated cells (Piani et al., 1992), (Piani and Fontana, 1994), (Sato et al., 1999). As upregulation of the Xc antiporter in immunocompetent cells is thought to be a self-protective mechanism to increase intracellular cysteine and glutathione so that the cells are not damaged by their own oxidative burst, it can be proposed that any stimulus that increases microglial free radical production will also increase glutamate release, In support of this potential scenario, several elegant reports have indeed shown that microglial activation is associated with the release of neurotoxic levels of glutamate (Barger and Basile, 2001), (Qin et al., 2006).
In light of the multi-faceted toxic potential of ROS, it is not surprising that cells have developed multiple antioxidant systems to regulate these signals. SOD1 is a specific scavenger of superoxide anion, and is one of the major antioxidant enzymes in mammalian cells. SOD1, originally described by Fridovich as CuZnSOD, catalyses the dismutation of superoxide anion to hydrogen peroxide and molecular oxygen, using hydrogen ions as co-factors (Fridovich, 1975). Overexpression of SOD1 in transgenic mice has been shown to be highly protective in multiple models of brain injury, including trauma, ischemia/reperfusion injury, mitochondrial inhibition, and methamphetamine-induced neurotoxicity (Huang et al., 1992), (Beal et al., 1995), (Nakao et al., 1995), (Andrews et al., 1996), (Mikawa et al., 1996), (Murakami et al., 1997). It has been generally assumed that neuroprotection in these models is based on reductions in neuronal ROS production and oxidative stress. While data presented in this manuscript do not discount this possibility, they underscore that increased SOD1 activity could also lessen brain injury by decreasing neurotoxic microglial activation. In support of this scenario, published reports have shown that treating microglial cells with SOD or SOD mimetics can reduce COX2 expression and prostaglandin E2 release (Wang et al., 2004). Likewise, cytokine release from cultured microglia has been shown to be attenuated by transient increases in SOD1 (Chang, Kao et al., 2001). Interestingly, however, other published reports suggest that superoxide radicals themselves act to decrease microglial reactivity in either peritoneal macrophages (Marikovsky et al., 2003), or in intestinal neutrophils (Keenan, Peterson et al., 2005), indicating that the role of ROS in immune signaling may be complex and cell-type specific.
These data clearly support a specific role for superoxide anion, rather than hydrogen peroxide, in directing inflammatory signaling in microglia. Superoxide anion is produced in mammalian cells by many different systems, including the mitochondrial electron transport chain, xanthine oxidase, cyclooxgenase, and monoamine oxidase. However, in phagocytic cells such as microglia, superoxide anion is deliberately produced in large quantities by the oxidative burst, an oxygen-requiring metabolic production of reactive species that is involved in the killing of engulfed microorganisms. Oxidative bust activity is carried out by NADPH oxidase, a superoxide-producing enzyme system consisting of membrane (gp91phox and p22phox) and cytosolic (p47phox, p67phox, and p40phox) components (DeLeo and Quinn, 1996), (Babior, 1999). Upon activation, the cytosolic component p47phox becomes heavily phosphorylated and the entire cytosolic complex migrates to the membrane, where p67phox interacts via its activation domain with the membrane-bound subunits. This interaction is required for oxidase activation and drives the transfer of electrons from NADPH to oxygen (reviewed in (Vignais, 2002). Activation of NADPH oxidase and increased oxidative burst activity are characteristic features of microglial activation both in vitro and in vivo. While many investigators have proposed that microglial free radical production contributes to brain injury by increasing brain-resident oxidative stress (reviewed in (Dringen, 2005), experimental evidence also suggests that free radical production in immune cells may also be critical to intracellular inflammatory signaling and the promulgation of the inflammatory cascade in the brain. For instance, the activity of the NADPH-driven oxidative burst system has been specifically implicated in the induction of a variety of important inflammatory signaling pathways, particularly NFκB (Kaul and Forman, 1996), (Clark and Valente, 2004), (Bai et al., 2005). In addition to activation and nuclear translocation, the actual composition of NFκB is responsive to changes in the intracellular oxidative environment (Kim et al., 2000), (Zhou et al., 2001), and the expression of p50 homodimers, which do not posses transactivation domains, could be an important mechanism to control inflammatory signaling. While the exact intracellular mechanisms are not fully resolved, our data show quite clearly that increasing superoxide scavenging alters attenuates NFκB activation and cytokine release, and accordingly decreases microglial-mediated neuronal death. Hence, while these data provide support for existing theories on the important role that NADPH oxidase plays in microglial activation, our data further suggest that augmented superoxide scavenging may be as protective as NADPH oxidase inhibition in models of brain injury. This is a critical observation as individuals with genetic deficiencies in NADPH oxidase are afflicted with the severe and often fatal immunodeficiency syndrome of chronic granulomatous disease (Babior, 1991), (Jurkowska et al., 2004), which could hinder the clinical potential of NADPH oxidase as a therapeutic target.
ACKNOWLEDGEMENTS
The authors are grateful to Drs. David Borchelt and Devin Gary for the human SOD1 constructs and to Dr. Greg Bauman and Jennifer Strange in the Flow Cytometry Facility of the University of Kentucky College of Medicine for their help in FACS analysis. Additional gratitude goes to Dr. P. Ricciardi-Castagnoli of the Department of Biotechnology and Bioscience, Piazza della Scienza 2, University of Milano-Bicocca, Milan, Italy for the N9 cell line. This work was supported by grants from the NIH (NS046267, NS45601, PO1 DA19398, and P20 RR15592).
Abbreviations
- CNS
central nervous system
- COX 2
cyclooxygenase 2
- DCF
dichlorofluorescin
- DCFDA
dichlorofluorescin diacetate
- DHE
dihydroethidium
- DMEM
Dulbecco's Minimal Essential Medium
- DSF
disulfiram
- FACS
Fluorescence Activated Cell Sorting
- FBS
Fetal Bovine Serum
- FITC
fluorescin isothiocyanate
- ECL
electrogenerated chemiluminescence
- EDTA
ethylenediaminetetraacetic acid
- ELISA
enzyme-linked immunoabsorbence
- EMSA
Electrophoretic Mobility Shift Assay
- HBSS
Hank's Buffered Saline Solution
- HRP
Horse Radish Peroxidase
- IFN-γ
interferon gamma
- IL-6
interleukin 6
- IL-1β
interleukin 1 beta
- IMDM
Iscove's Modified Dulbecco's Medium
- LPS
lipopolysaccharide
- MFI
Mean Fluorescence Intensity
- MC540: Merocyanine 540 MTT
3-[4,5 dimethylthiazol-2-yl]-2,5-diphenyl tetrazolium bromide
- NADPH
nicotinamide adenine dinucleotide phosphate, reduced form
- NFκB
nuclear factor κB
- pBR
peripheral benzodiazepine receptor
- PBS
phosphate buffered solution
- PMA
phorbol myristate acetate
- PNK
polynucleotide kinase
- PVDF
polyvinylidene fluoride
- ROS
reactive oxygen species
- RNS
reactive nitrogen species
- RT
room temperature
- SDS-PAGE
sodium dodecyl sulfate-polyacrylamide gel electrophoresis
- SOD
superoxide dismutase
- TNF-α
tumor necrosis factor-alpha
Footnotes
Publisher's Disclaimer: This is a PDF file of an unedited manuscript that has been accepted for publication. As a service to our customers we are providing this early version of the manuscript. The manuscript will undergo copyediting, typesetting, and review of the resulting proof before it is published in its final citable form. Please note that during the production process errors may be discovered which could affect the content, and all legal disclaimers that apply to the journal pertain.
REFERENCES
- Aloisi F. Immune function of microglia. Glia. 2001;36:165–179. doi: 10.1002/glia.1106. [DOI] [PubMed] [Google Scholar]
- Andrews AM, Ladenheim B, Epstein CJ, Cadet JL, Murphy DL. Transgenic mice with high levels of superoxide dismutase activity are protected from the neurotoxic effects of 2′-NH2-MPTP on serotonergic and noradrenergic nerve terminals. Mol. Pharmacol. 1996;50:1511–9. [PubMed] [Google Scholar]
- Babior BM. The respiratory burst oxidase and the molecular basis of chronic granulomatous disease. Am. J. Hematol. 1991;37:263–6. doi: 10.1002/ajh.2830370410. [DOI] [PubMed] [Google Scholar]
- Babior BM. NADPH oxidase: an update. Blood. 1999;93:1464–1476. [PubMed] [Google Scholar]
- Bai SK, Lee SJ, Na HJ, Ha KS, Han JA, Lee H, Kwon YG, Chung CK, Kim YM. beta-Carotene inhibits inflammatory gene expression in lipopolysaccharide-stimulated macrophages by suppressing redox-based NF-kappaB activation. Exp. Mol. Med. 2005;37:323–34. doi: 10.1038/emm.2005.42. [DOI] [PubMed] [Google Scholar]
- Banati RB, Gehrmann J, Schubert P, Kreutzberg GW. Cytotoxicity of microglia. Glia. 1993;7:111–118. doi: 10.1002/glia.440070117. [DOI] [PubMed] [Google Scholar]
- Banati RB, Rothe G, Valet G, Kreutzberg GW. Detection of lysosomal cysteine proteinases in microglia: flow cytometric measurement and histochemical localization of cathepsin B and L. Glia. 1993;7:183–191. doi: 10.1002/glia.440070208. [DOI] [PubMed] [Google Scholar]
- Barger SW, Basile AS. Activation of microglia by secreted amyloid precursor protein evokes release of glutamate by cystine exchange and attenuates synaptic function. J. Neurochem. 2001;76:846–854. doi: 10.1046/j.1471-4159.2001.00075.x. [DOI] [PubMed] [Google Scholar]
- Barkats M, Bemelmans A-P, Geoffroy M-C, Robert J-J, Loquet I, Horellou P, Revah F, Mallet J. An adenovirus encoding CuZnSOD protects cultured striatal neurones against glutamate toxicity. Neuroreport. 1996;7:497–501. doi: 10.1097/00001756-199601310-00029. [DOI] [PubMed] [Google Scholar]
- Beal MF, Ferrante RJ, Henshaw R, Matthews RT, Chan PH, Kowall NW, Ebstain CJ, Schulz JB. 3-NP neurotoxicity is attenuated in copper/zinc superoxide dismutase transgenic mice. J. Neurochem. 1995;65:919–922. doi: 10.1046/j.1471-4159.1995.65020919.x. [DOI] [PubMed] [Google Scholar]
- Beckman JS, Crow JP. Pathological implications of nitric oxide, superoxide and peroxynitrite formation. Biochem. Soc. Trans. 1993;21:330–334. doi: 10.1042/bst0210330. [DOI] [PubMed] [Google Scholar]
- Bruce-Keller AJ, Barger SW, Moss NI, Pham JT, Keller JN, Nath A. Pro-inflammatory and pro-oxidant properties of the HIV protein Tat in a microglial cell line: attenuation by 17beta-estradiol. J. Neurochem. 2001;78:1315–1324. doi: 10.1046/j.1471-4159.2001.00511.x. [DOI] [PubMed] [Google Scholar]
- Bruce-Keller AJ, Keeling JL, Keller JN, Huang FF, Camondola S, Mattson MP. Anti-inflammatory effects of estrogen on microglial activation. Endocrinology. 2000;141:3646–3656. doi: 10.1210/endo.141.10.7693. [DOI] [PubMed] [Google Scholar]
- Chan PH, Kawase M, Murakami K, Chen SF, Li Y, Calagui B, Reola L, Carlson E, Epstein CJ. Overexpression of SOD1 in transgenic rats protects vulnerable neurons against ischemic damage after global cerebral ischemia and reperfusion. J. Neurosci. 1998;18:8292–8299. doi: 10.1523/JNEUROSCI.18-20-08292.1998. [DOI] [PMC free article] [PubMed] [Google Scholar]
- Chang SC, Kao MC, Fu MT, Lin CT. Modulation of NO and cytokines in microglial cells by Cu/Zn-superoxide dismutase. Free Radic. Biol. Med. 2001;31:1084–9. doi: 10.1016/s0891-5849(01)00691-8. [DOI] [PubMed] [Google Scholar]
- Clark RA, Valente AJ. Nuclear factor kappa B activation by NADPH oxidases. Mech. Ageing Dev. 2004;125:799–810. doi: 10.1016/j.mad.2004.08.009. [DOI] [PubMed] [Google Scholar]
- Colton AC, Gilbert DL. Production of superoxide by a CNS macrophage, the microglia. FEBS Lett. 1987;223:284–288. doi: 10.1016/0014-5793(87)80305-8. [DOI] [PubMed] [Google Scholar]
- DeLeo FR, Quinn MT. Assembly of the phagocyte NADPH oxidase: molecular interaction of oxidase proteins. J. Leukoc. Biol. 1996;60:677–691. doi: 10.1002/jlb.60.6.677. [DOI] [PubMed] [Google Scholar]
- Dimayuga FO, Ding Q, Keller JN, Marchionni MA, Seroogy KB, Bruce-Keller AJ. The neuregulin GGF2 attenuates free radical release from activated microglial cells. J Neuroimmunol. 2003;136:67–74. doi: 10.1016/s0165-5728(03)00003-1. [DOI] [PubMed] [Google Scholar]
- Dobashi K, Aihara M, Araki T, Shimizu Y, Utsugi M, Iizuka K, Murata Y, Hamuro J, Nakazawa T, Mori M. Regulation of LPS induced IL-12 production by IFN-gamma and IL-4 through intracellular glutathione status in human alveolar macrophages. Clin. Exp. Immunol. 2001;124:290–296. doi: 10.1046/j.1365-2249.2001.01535.x. [DOI] [PMC free article] [PubMed] [Google Scholar]
- Dringen R. Oxidative and antioxidative potential of brain microglial cells. Antioxid. Redox Signal. 2005;7:1223–33. doi: 10.1089/ars.2005.7.1223. [DOI] [PubMed] [Google Scholar]
- Droge W. Free radicals in the physiological control of cell function. Physiol. Rev. 2002;82:47–95. doi: 10.1152/physrev.00018.2001. [DOI] [PubMed] [Google Scholar]
- Elroy-Stein O, Bernstein Y, Groner Y. Overproduction of human Cu/Zn-superoxide dismutase in transfected cells: extenuation of paraquat-mediated cytotoxicity and enhancement of lipid peroxidation. EMBO J. 1986;5:615–22. doi: 10.1002/j.1460-2075.1986.tb04255.x. [DOI] [PMC free article] [PubMed] [Google Scholar]
- Forman HJ, Torres M. Redox signaling in macrophages. Mol. Aspects Med. 2001;22:189–216. doi: 10.1016/s0098-2997(01)00010-3. [DOI] [PubMed] [Google Scholar]
- Frank L, Wood DL, Roberts RJ. Effect of diethyldithiocarbamate on oxygen toxicity and lung enzyme activity in immature and adult rats. Biochem. Pharmacol. 1977;27:251–254. doi: 10.1016/0006-2952(78)90311-8. [DOI] [PubMed] [Google Scholar]
- Fridovich I. Superoxide Dismutases. Ann. rev. Biochem. 1975;44:17–159. doi: 10.1146/annurev.bi.44.070175.001051. [DOI] [PubMed] [Google Scholar]
- Gehrmann J, Matsumoto Y, Kreutzberg GW. Microglia: intrinsic immuneffector cell of the brain. Brain Res. Rev. 1995;20:269–287. doi: 10.1016/0165-0173(94)00015-h. [DOI] [PubMed] [Google Scholar]
- Giulian D, Haverkamp LJ, Li J, Karshin WL, Yu J, Tom D, Li X, Kirkpatrick JB. Senile plaques stimulate microglia to release a neurotoxin found in Alzheimer brain. Neurochem. Int. 1995;27:119–137. doi: 10.1016/0197-0186(95)00067-i. [DOI] [PubMed] [Google Scholar]
- Huang TT, Carlson EJ, Leadon SA, Epstein CJ. Relationship of resistance to oxygen free radicals to CuZn-superoxide dismutase activity in transgenic, transfected, and trisomic cells. FASEB J. 1992;6:903–10. doi: 10.1096/fasebj.6.3.1740238. [DOI] [PubMed] [Google Scholar]
- Itagaki S, McGeer PL, Akiyama H, Zhu S, Selkoe D. Relationship of microglia in and around senile (neuritic) plaques in Alzheimer brain. J. Neurimmunol. 1989;24:173–182. doi: 10.1016/0165-5728(89)90115-x. [DOI] [PubMed] [Google Scholar]
- Jurkowska M, Bernatowska E, Bal J. Genetic and biochemical background of chronic granulomatous disease. Arch. Immunol. Ther. Exp. (Warsz) 2004;52:113–20. [PubMed] [Google Scholar]
- Kaul N, Forman HJ. Activation of NF kappa B by the respiratory burst of macrophages. Free Radic. Biol. Med. 1996;21:401–405. doi: 10.1016/0891-5849(96)00178-5. [DOI] [PubMed] [Google Scholar]
- Keenan JI, Peterson R.A.n., Hampton MB. NADPH oxidase involvement in the pathology of Helicobacter pylori infection. Free Radic. Biol. Med. 2005;38:1188–96. doi: 10.1016/j.freeradbiomed.2004.12.025. [DOI] [PubMed] [Google Scholar]
- Kim H, Seo JY, Roh KH, Lim JW, Kim KH. Suppression of NF-kappaB activation and cytokine production by N-acetylcysteine in pancreatic acinar cells. Free Radic. Biol. Med. 2000;29:674–83. doi: 10.1016/s0891-5849(00)00368-3. [DOI] [PubMed] [Google Scholar]
- Ling EA, Ng YK, Wu CH, Kaur C. Microglia: its development and role as a neuropathology sensor. Prog. Brain Res. 2001;132:61–79. doi: 10.1016/S0079-6123(01)32066-6. [DOI] [PubMed] [Google Scholar]
- Marikovsky M, Nevo N, Vadai E, Harris-Cerruti C. Cu/Zn superoxide dismutase plays a role in angiogenesis. Int. J. Cancer. 2002;97:34–41. doi: 10.1002/ijc.1565. [DOI] [PubMed] [Google Scholar]
- Marikovsky M, Ziv V, Nevo N, Harris-Cerruti C, Mahler O. Cu/Zn superoxide dismutase plays important role in immune response. J. Immunol. 2003;170:2993–3001. doi: 10.4049/jimmunol.170.6.2993. [DOI] [PubMed] [Google Scholar]
- Mattson MP, Camandola S. NF-kappaB in neuronal plasticity and neurodegenerative disorders. J. Clin. Invest. 2001;107:247–54. doi: 10.1172/JCI11916. [DOI] [PMC free article] [PubMed] [Google Scholar]
- McGeer PL, Itagaki S, Boyes BE, McGeer EG. Reactive microglia are positive for HLA-DR in the substancia nigra of Parkinson's and Alzheimer's disease brains. Neurology. 1988;38:1285–1291. doi: 10.1212/wnl.38.8.1285. [DOI] [PubMed] [Google Scholar]
- McGeer PL, McGeer EG. The role of the immune system in neurodegenerative disorders. Mov. Disord. 1997;12:855–8. doi: 10.1002/mds.870120604. [DOI] [PubMed] [Google Scholar]
- Mikawa S, Kinouchi H, Kamii H, Gobbel GT, Chen SF, Carlson E, Epstein CJ, Chan PH. Attenuation of acute and chronic damage following traumatic brain injury in copper, zinc-superoxide dismutase transgenic mice. J. Neurosurg. 1996;85:885–9. doi: 10.3171/jns.1996.85.5.0885. [DOI] [PubMed] [Google Scholar]
- Moller JC, Klein MA, Haas S, Jones LL, Kreutzberg GW, Raivich G. Regulation of thrombospondin in the regenerating mouse facial nucleus. Glia. 1996;17:121–132. doi: 10.1002/(SICI)1098-1136(199606)17:2<121::AID-GLIA4>3.0.CO;2-5. [DOI] [PubMed] [Google Scholar]
- Murakami K, Kondo T, Epstein CJ, Chan PH. Overexpression of CuZn-superoxide dismutase reduces hippocampal injury after global ischemia in transgenic mice. Stroke. 1997;28:1797–804. doi: 10.1161/01.str.28.9.1797. [DOI] [PubMed] [Google Scholar]
- Murata Y, Shimamura T, Hamuro J. The polarization of T(h)1/T(h)2 balance is dependent on the intracellular thiol redox status of macrophages due to the distinctive cytokine production. Int Immunol. 2002;14:201–212. doi: 10.1093/intimm/14.2.201. [DOI] [PubMed] [Google Scholar]
- Nakajima K, Tohyama Y, Kohsaka S, Kurihara T. Ability of rat microglia to uptake extracellular glutamate. Neurosci. Lett. 2001;307:171–174. doi: 10.1016/s0304-3940(01)01943-7. [DOI] [PubMed] [Google Scholar]
- Nakao N, Frodl E, Widner H, Carlson E, Eggerding F, Epstein C, Brundin P. Overexpressing Cu/Zn superoxide dismutase enhances survival of transplanted neurons in a rat model of Parkinson's disease. Nat. Med. 1995;1:226–3. doi: 10.1038/nm0395-226. [DOI] [PubMed] [Google Scholar]
- Nelson P, Soma L, Lavi E. Microglia in diseases of the central nervous system. Ann. Med. 2002;34:491–500. doi: 10.1080/078538902321117698. [DOI] [PubMed] [Google Scholar]
- Piani D, Fontana A. Involvement of the cystine transport system Xc in the macrophage-induced glutamate-dependent cytotoxicity to neurons. J. Immunol. 1994;153:3578–3585. [PubMed] [Google Scholar]
- Piani D, Spranger M, Frei K, Schaffner A, Fontana A. Macrophage-induced cytotoxicity of N-methyl-D-aspartate receptor positive neurons involves excitatory amino acids rather than reactive oxygen intermediates and cytokines. Eur. J. Immunol. 1992;22:2429–2436. doi: 10.1002/eji.1830220936. [DOI] [PubMed] [Google Scholar]
- Qin S, Colin C, Hinners I, Gervais A, Cheret C, Mallat M. System Xc- and apolipoprotein E expressed by microglia have opposite effects on the neurotoxicity of amyloid-beta peptide 1-40. J. Neurosci. 2006;26:3345–56. doi: 10.1523/JNEUROSCI.5186-05.2006. [DOI] [PMC free article] [PubMed] [Google Scholar]
- Reid S, Cross R, Snow C. Combined hoechst 33342 and merocyanine 540 staining to examine murine B cell cycle stage, viability and apoptosis. J. Immuno. Meth. 1996;192:43–54. doi: 10.1016/0022-1759(96)00004-x. [DOI] [PubMed] [Google Scholar]
- Rozemuller JM, Eikelenboom P, Stam FC, Beyreuther K, Masters CL. A4 protein in AD: primary and secondary cellular events in extracellular amyloid deposits. J. Neuropath. Exp. Neurol. 1989;48:647–663. doi: 10.1097/00005072-198911000-00009. [DOI] [PubMed] [Google Scholar]
- Sato H, Tamba M, Ishii T, Bannai S. Cloning and expression of a plasma membrane cystine/glutamate exchange transporter composed of two distinct proteins. J. Biol. Chem. 1999;274:11455–11459. doi: 10.1074/jbc.274.17.11455. [DOI] [PubMed] [Google Scholar]
- Streit WJ, Walter SA, Pennell NA. Reactive microgliosis. Prog. Neurobiol. 1999;57:563–581. doi: 10.1016/s0301-0082(98)00069-0. [DOI] [PubMed] [Google Scholar]
- Vignais PV. The superoxide-generating NADPH oxidase: structural aspects and activation mechanism. Cell. Mol. Life Sci. 2002;59:1428–1459. doi: 10.1007/s00018-002-8520-9. [DOI] [PMC free article] [PubMed] [Google Scholar]
- Wang T, Qin L, Liu B, Liu Y, Wilson B, Eling T, Langenbach R, Taniura S, Hong J. Role of reactive oxygen species in LPS-induced production of prostaglandin E2 in microglia. J Neurochem. 2004;88:939–47. doi: 10.1046/j.1471-4159.2003.02242.x. [DOI] [PubMed] [Google Scholar]
- Westendorp MO, Shatrov VA, Schulze-Osthoff K, Frank R, Kraft M, Los M, Krammer PH, Droge W, Lehmann V. HIV-1 Tat potentiates TNF-induced NF-kappa B activation and cytotoxicity by altering the cellular redox state. EMBO. J. 1995;14:546–554. doi: 10.1002/j.1460-2075.1995.tb07030.x. [DOI] [PMC free article] [PubMed] [Google Scholar]
- Zhou LZ, Johnson AP, Rando TA. NF kappa B and AP-1 mediate transcriptional responses to oxidative stress in skeletal muscle cells. Free Radic. Biol. Med. 2001;31:1405–16. doi: 10.1016/s0891-5849(01)00719-5. [DOI] [PubMed] [Google Scholar]