Abstract
Background
Membrane‐bound glucocorticoid receptors (mGCR) are up regulated on monocytes after in vitro stimulation and in patients with rheumatoid arthritis. Caveolin‐1 is critical for the transport of plasma membrane oestrogen receptors to the cell surface.
Objectives
To investigate the expression of mGCR in patients with systemic lupus erythematosus (SLE)—a disease with different aetiopathogenesis and treatment regimens—and to examine whether caveolin‐1 is critical for the transport of mGCR to the cell surface.
Methods
Frequencies of mGCR+ peripheral blood mononuclear cells were measured using high‐sensitivity immunofluorescent staining and tested for correlation with SLE disease activity and glucocorticoid treatment. Semiquantitative polymerase chain reaction, immunofluorescence, recombinant expression and confocal laser‐scanning microscopy were used to search for an association of mGCR with caveolin‐1.
Results
The frequencies of mGCR+ monocytes (CD14+) were considerably higher in patients with SLE (n = 33) than in healthy controls (n = 58), whereas B cells (CD19+) were not different in this regard. T cells (CD3+) were always mGCR−. The frequency of mGCR+ monocytes in patients with SLE did not correlate with disease activity, but did inversely correlate with glucocorticoid dosages; this inverse correlation was confirmed by corresponding in vitro experiments with stimulated monocytes. The induced up regulation of mGCR was not accompanied by an up regulation of caveolin‐1, and mGCR are not colocalised with caveolin‐1 in plasma membrane caveolae.
Conclusion
mGCR are (a) up regulated in patients with SLE and by inflammatory stimuli and (b) down regulated by glucocorticoids, suggesting a negative feedback loop to control glucocorticoid action. Drugs binding selectively to mGCR may in future prove to be of therapeutic value.
Glucocorticoids mainly exert their important therapeutic effects by genomic mechanisms through cytosolic glucocorticoid receptors (cGCR).1 However, some effects are too rapid to be explained by genomic actions.2,3,4 Unspecific non‐genomic effects are caused by membrane interactions at high concentrations.1 Specific non‐genomic effects are thought to be mediated by (a) specific interactions with intracellular receptors5,6 or by (b) binding to membrane‐bound glucocorticoid receptors (mGCR).1,2,3 The existence of mGCR has been shown for amphibian neuronal membranes7 and human leukaemic and lymphoma cells.8,9 We have recently shown the physiological presence of mGCR on the surface of human monocytes and B lymphocytes.10 Furthermore, we presented evidence for the up regulation of mGCR on monocytes after stimulation with bacterial lipopolysaccharide (LPS) and in patients with active rheumatoid arthritis.10 The observation in patients with active rheumatoid arthritis gave rise to the hypothesis that drugs binding selectively to mGCR may turn out to be of therapeutic value, as mGCR may modulate symptoms of rheumatoid arthritis and other diseases.1 Therefore, in this study we investigated mGCR expression in patients with systemic lupus erythematosus (SLE)—a rheumatic disease of diverse aetiopathogenesis, pathophysiological background and treatment regimens.
mGCR are considered to be a splice variant of the cGCR,10,11 whereas the assumption that cGCR and mGCR are coded by two different genes (as shown for membrane progesterone receptors12) is rather unlikely.10 However, a hydrophobic transmembrane domain has not yet been identified for any glucocorticoid receptor (GCR) protein or splice variant.10 Oestrogen receptors have been localised in plasma membrane caveolae and are associated with the caveolae marker protein, caveolin‐1.13,14 Caveolin‐1 facilitates oestrogen receptor translocation to the membrane and forms scaffolding domains for association with signalling molecules.14 These findings led us to investigate whether mGCR are localised in caveolae, too, and whether their membrane appearance is dependent on the caveolin‐1 expression of the cell.
Participants and methods
Patients and controls
We investigated blood samples from 33 patients with SLE (27 women and 6 men, mean age 42.7 years) and 58 healthy controls (22 women and 36 men, mean age 31.8 years). Part of the controls had served for establishing standard values in a previous publication.10 The Ethics Committee of Charité University Hospital, Berlin, Germany, approved the study. Informed consent was obtained each time. Signs of infection had to have been absent for the past 3 weeks. All patients met the American College of Rheumatology criteria for classification of SLE.15 Disease activity was assessed by SLE Disease Activity Index (SLEDAI)16 and European Consensus Lupus Activity Measurement (ECLAM) scales.17 We divided the patients into three groups, depending on the currently received glucocorticoid dosage.18 Initial experiments indicated that in vivo regulation of mGCR expression is rather slow (not shown). Therefore, we predefined that patients had to receive glucocorticoid treatment for at least 7 days at dosages in a given range. This was fulfilled in 29 patients. Group 1 consisted of 16 women and 2 men receiving ⩽7.5 mg prednisolone‐equivalent/day (mean age 40.0 years; calculated cumulative glucocorticoid dose 14.3 g). Group 2 consisted of 4 women and 3 men receiving 7.5–30 mg prednisolone‐equivalent/day (45.7 years; 27.1 g). Group 3 consisted of 3 women and 1 man receiving 30–100 mg prednisolone‐equivalent/day (47.8 years; 12.0 g). The cumulative glucocorticoid dose was highest in group 2, because of a greater percentage of patients with long‐term treatment.
Preparation of peripheral blood mononuclear cells
Peripheral blood mononuclear cells (PBMC) were isolated by density gradient centrifugation. The isolation procedure was as described previously10 and is available online at http://www.annrheumdis.com/supplemental.
Stimulation with lipopolysaccharide and treatment with dexamethasone
PBMC were incubated with 2 μg/ml lipopolysaccharide (LPS; Sigma) for 24 h. The incubation procedure was as described previously10 and is available online at http://www.annrheumdis.com/supplemental. Dexamethasone (water soluble, Sigma, Steinheim, Germany) was added after 24‐h LPS stimulation at final concentrations of 10−5, 10−7, 10−9 or 10−11 mol/l, and incubation was continued for further 24 h. A control was incubated in parallel without adding dexamethasone.
Isolation of monocytes
For isolation of monocytes, blood samples from three patients with SLE (2 women and 1 man; mean age 44.0 years) and buffy coats from healthy donors were acquired. Monocytes were isolated from PBMC by magnetic activated cell sorting by anti‐CD14‐conjugated magnetic microbeads (Miltenyi Biotec Bergisch‐Gladbach, Germany) and incubated with LPS as described for PBMC.
Flow cytometric analysis
For immunofluorescence analysis, a monoclonal immunoglobulin G1 (IgG1) antibody anti‐GCR 5E419 directed against the conserved regulatory sequence of human GCR (amino acids 150–176) was used. These antibodies were conjugated to digoxigenin (Dig; Roche, Mannheim, Germany). mGCR were detected by high‐sensitivity immunofluorescent staining with anti‐GCR‐Dig followed by anti‐Dig‐magnetofluorescent liposomes.20 For control of specificity in each experiment, cells were incubated (a) without hapten‐labelled mGCR antibody and (b) with a 50–100‐fold excess of unlabelled mGCR antibody before staining with the anti‐GCR‐Dig conjugate. The frequency of mGCR+ cells was calculated from the positive sample by subtracting the background signals obtained by blocking. We also used anti‐CD14‐PE, anti‐CD19‐APC and anti‐CD3‐PerCP (Becton Dickinson, San Jose, USA) to identify the different cell types. To identify dead cells, propidium iodide (Sigma) was added. Intracellular cGCR were detected by intracellular staining of fixed and permeabilised cells with anti‐GCR‐Dig and anti‐Dig‐fluorescein Fab fragments (Roche). We acquired data using a fluorescence activated cell sorter‐Calibur (Becton Dickinson). Further details on antibodies and antibody conjugates, incubation and acquisition have been previously reported10 and are available online at http://www.annrheumdis.com/supplemental.
Reverse transcriptase‐polymerase chain reaction analysis
Total RNA from various cell populations (Jurkat, K562, Hep2, HeLa and human primary monocytes) was isolated and reverse transcribed into cDNA. Polymerase chain reaction (PCR) was carried out for the semiquantification of transcripts. Further details and primer sets are available online at http://www.annrheumdis.com/supplemental.
Transfection of human caveolin‐1 cDNA
Human caveolin‐1 cDNA was transfected into K562 cells. After 24 h, transfected cells were either stained for mGCR or sorted for enhanced green fluorescence protein‐positive cells at a fluorescence activated cell sorter Diva (Becton Dickinson) and subsequently lysed for sodium dodecyl sulphate‐polyacrylamide gel electrophoresis. Western blotting was carried out using mouse IgG2a anti‐caveolin‐1 monoclonal antibody (clone 2234, BD Transduction Laboratories, San Diego, USA). Further details are available online at http://www.annrheumdis.com/supplemental.
Immunofluorescence labelling and confocal laser‐scanning microscopy
Immunofluorescence staining was based on the method described previously.21 HeLa cells were grown on coverslips. After fixation, cells were incubated sequentially with anti‐caveolin‐1 (N20; Santa Cruz, Santa Cruz, USA) and anti‐GCR (5E4)19 antibodies, and then with either Cy5‐conjugated goat anti‐rabbit IgG or Cy3‐conjugated goat anti‐mice IgG antibody (Molecular Probes, Eugene, USA). We carried out analysis by using a Leica TCS NT confocal laser‐scanning microscope (Wetzlar, Germany). A detailed description of the analysis is available online at http://www.annrheumdis.com/supplemental.
Statistical analysis
The correlation of the frequency of mGCR+ cells with ECLAM and SLEDAI Scores was tested using Spearman's test. Because our data were not normally distributed, we chose non‐parametric tests for group comparisons: the Friedman test for multiple comparison of different dexamethasone concentrations, and the Mann–Whitney U test to compare patients with SLE with controls, groups with different glucocorticoid dosages and the group showing a control ⩽50% with that showing >50% mGCR+ monocytes; p<0.05 was considered to be significant.
Results
mGCR expression in patients with SLE
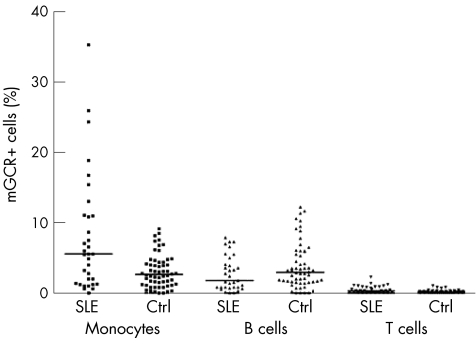
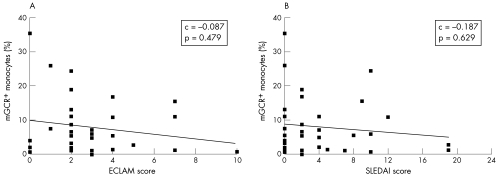
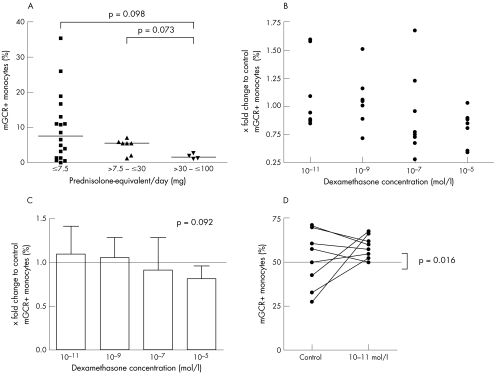
The frequencies of mGCR+ cells among monocytes (CD14+) were significantly higher in patients with SLE than in healthy controls (range 0–35.4%, median 5.6%, mean 8.0 (standard deviation (SD) 8.4%), n = 33 versus range 0–9.2%, median 2.7%, mean 3.1 (2.3%), n = 58; p = 0.006). The mean fluorescence intensity of mGCR+ monocytes was also considerably higher in patients with SLE (data not shown). The frequency of mGCR+ B cells (CD19+) was not significantly different (p = 0.145), although the median was slightly lower in the group with SLE (range 0.0–7.9%, median 1.8%, mean 2.8 (2.5%), n = 33) than in controls (range 0.0–12.3%, median 3.0%, mean 3.9 (3.3%), n = 58). Likewise, mean fluorescence intensity was not different. In T cells (CD3+), we could not detect significant mGCR expression (fig 1). The frequency of mGCR+ cells among monocytes (CD14+) did not correlate with SLE disease activity as assessed by SLEDAI and ECLAM scores (fig 2). Also, there was no correlation in B cells (CD19+; data not shown). However, with regard to glucocorticoid treatment, we found the highest mean frequency of mGCR+ cells among monocytes (CD14+) in group 1 (⩽7.5 mg prednisolone‐equivalent/day), whereas it was lower in group 2 (7.5–30 mg prednisolone‐equivalent/day) and lowest in group 3 (30–100 mg prednisolone‐equivalent/day, median 7.7% v 5.6% v 1.8%; fig 3A). This indicates a dose‐dependent down regulation of mGCR by glucocorticoid treatment. The data fall just short of significance, presumably because of the low number of patients with SLE and long‐term high‐dose treatment, which fulfilled our inclusion criteria. The groups were not different with regard to CD19+ B cells.
Figure 1 Frequency of membrane‐bound glucocorticoid receptor positive (mGCR+) cells among monocytes (CD14+), B cells (CD19+) and T cells (CD3+) in patients with systemic lupus erythematosus (SLE, n = 33) and healthy controls (Ctrl, n = 58). Bars are medians.
Figure 2 Frequency of membrane‐bound glucocorticoid receptor (mGCR+) monocytes (CD14+) is not correlated to systemic lupus erythematosus (SLE) disease activity. Disease activity assessed by (A) European Consensus Lupus Activity Measurement (ECLAM) and (B) SLE Disease Activity Index (SLEDAI). C, correlation.
Figure 3 Effects of glucocorticoids on the frequency of membrane‐bound glucocorticoid receptor positive (mGCR+) monocytes (CD14). (A) Effect of glucocorticoid treatment in patients with systemic lupus erythematosus (SLE). Frequency of mGCR+ monocytes in patients with SLE, according to the different glucocorticoid dosages. Bars are medians. (B–D) Effect of dexamethasone (dex) treatment on lipopolysaccharide (LPS)‐stimulated monocytes. Change in the frequency of mGCR+ monocytes relative to control: (B) dot plot and (C) means and SD. (D) Frequency of mGCR+ monocytes of controls and patients treated with 10–11 mol/l dexamethasone.
Effect of dexamethasone in vitro
These data correspond with those from our in vitro model. We stimulated PBMC with LPS for 24 h to obtain a high frequency of mGCR+ monocytes.10 Thereafter, dexamethasone was added at different concentrations and incubation was extended for 24 h. Eleven experiments were carried out and complete data for all concentrations were acquired for eight blood samples. Figure 3 (B,C) shows the change in the frequency of mGCR+ monocytes (CD14+) relative to control. We found a trend towards an increase in the frequency of mGCR+ monocytes at very low concentrations (10−11 mol/l) and towards a decrease at high dexamethasone concentrations (10−7and 10−5 mol/l; p = 0.092; n = 8; fig 3C). Therefore, there seems to be a concentration‐dependent effect. Interestingly, at 10–11 mol/l dexamethasone, we found only an increase, when the control showed a frequency of ⩽50% mGCR+ monocytes (⩽50% v >50%: median 1.59 v 0.89; p = 0.016; n = 9; fig 3D). This supports the argument that dexamethasone at very low concentrations is capable of further enhancing mGCR expression, if the LPS stimulation is not maximal. We found no correlation between the percentage of dead and mGCR+ cells.
Correlation of mGCR with caveolin‐1 expression
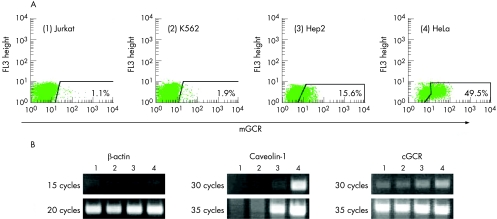
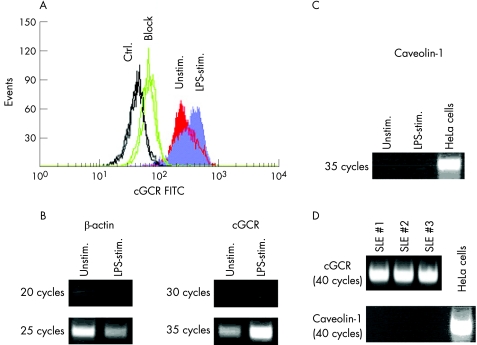
The mGCR expression level in several human cell lines (fig 4A) showed a close correlation to the amount of caveolin‐1 transcript determined by semiquantitative reverse transcriptase‐PCR (fig 4B). We also found a moderate positive correlation with the transcript amount of the cGCR. However, the findings in monocytes were contrary: freshly isolated human CD14+ monocytes or PBMC were incubated with LPS for 24 h to obtain monocytes with a high frequency of mGCR+ cells.10 Immunofluorescence analysis of cGCR protein in PBMC showed greater fluorescence intensity in LPS‐stimulated monocytes than in unstimulated cells (fig 5A). Semiquantitative PCR carried out in parallel confirmed a strong increase in cGCR transcripts (fig 5B). In contrast, we observed no detectable level of caveolin‐1 mRNA in normal and LPS‐stimulated monocytes (fig 5C). No detectable level of caveolin‐1 mRNA was observed in monocytes from three patients with SLE (fig 5D). Thus, caveolin‐1 does not seem to have a critical role in the up regulation of mGCR in LPS‐stimulated monocytes and in patients with SLE. However, the up regulation of mGCR is accompanied by an up regulation of cGCR transcript and cGCR protein.
Figure 4 Correlation between caveolin‐1 and membrane‐bound glucocorticoid receptor (mGCR) expression in different human cell lines. (A) High‐sensitivity immunofluorescence analysis of mGCR on (1) Jurkat, (2) K562, (3) Hep2 and (4) HeLa cells. The frequency of mGCR+ cells is given. The cut‐off between mGCR+ and mGCR− cells was set according to the control sample incubated with liposomes only (control sample not shown, but acquired for each experiment). (B) Semiquantitative polymerase chain reaction analysis of caveolin‐1 and cGCR transcripts in Jurkat (1), K562 (2), Hep2 (3) and HeLa cells (4).
Figure 5 Correlation of caveolin‐1 expression and cytosolic glucocorticoid receptor (cGCR) expression in freshly isolated CD14+ human primary monocytes. (A) Immunofluorescence analysis of cGCR protein in lipopolysaccharide (LPS)‐stimulated (stim.) and unstimulated (Unstim.) monocytes (CD14+). Control (Ctrl.) was without a GCR antibody, and “block” refers to a parallel incubation with unlabelled anti‐GCR antibody in excess. (B) Semiquantitative polymerase chain reaction (PCR) analysis of cGCR transcript in normal monocytes (unstimulated and LPS stimulated). (C) Semiquantitative PCR analysis of caveolin‐1 transcript in normal monocytes (unstimulated and LPS stimulated). cDNA of HeLa cells was used as a positive control. (D) Semiquantitative PCR analysis of cGCR and caveolin‐1 transcript in monocytes from patients with systemic lupus erythematosus. FITC, fluorescein isothiocyanate.
In accordance with these results, overexpression of the recombinant caveolin‐1 transcript in human K562 chronic myelogenous leukaemia cells did not lead to an up regulation of mGCR appearance (data not shown). This suggests that caveolin‐1 is not the limiting factor for the membrane transport of the GCR, without ruling out the possibility that it is a component of the transport machinery. Western blot (data not shown) verified recombinant caveolin‐1 expression.
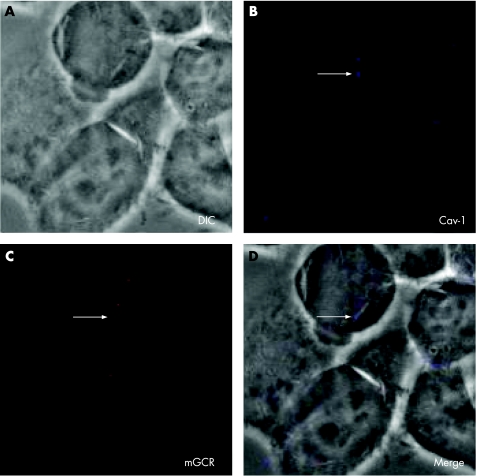
Finally, we used confocal immunofluorescent laser‐scanning microscopy to determine whether mGCR colocalise with the structure‐determining protein of caveolar microdomains, caveolin‐1. Superimposition of transmission microscopy and immunofluorescence of caveolin‐1 (blue) and mGCR (red) did not appear as purple. This shows that there is no colocalisation of caveolin‐1 and mGCR in HeLa cells (fig 6).
Figure 6 Confocal laser‐scanning microscopy of HeLa cells that were grown for 3 days and stained with anti‐glucocorticoid receptor (GCR) antibody and anti‐caveolin‐1 antibody. (A) Transmission microscopy (differential interference contrast (DIC)). (B) Immunofluorescence of caveolin‐1 (Cav‐1). (C) Immunofluorescence of membrane‐bound glucocorticoid receptor (mGCR). (D) Superimposition of transmission microscopy (DIC) and immunofluorescence of caveolin‐1 and mGCR (Merge).
Discussion
mGCR have been detected recently in human monocytes and B cells.10 We detected mGCR by high‐sensitivity immunofluorescent staining. The validity of this technique was shown by (a) specificity controls obtained in each experiment, (b) the fact that our liposomes do not pass into the cytoplasm20,22 and (c) the confirmation by fluorescence microscopy.10 The use of this technique was driven by the idea that mGCR—like other important molecules20—are expressed only in small numbers and therefore are not detectable by conventional methods.
mGCR are actively up regulated and transported through the cell after immunostimulation and in patients with rheumatoid arthritis.10 We examined mGCR expression in patients with SLE. We expected to find similar results, but possibly with B cells associated, as they seem to have an important role in SLE.23 Moreover, high doses of glucocorticoids are often and successfully used in the treatment of SLE. In this regard, non‐specific non‐genomic actions are assumed to have therapeutic implications, whereas the clinical relevance of mGCR‐mediated specific non‐genomic glucocorticoid actions is yet undefined.1,4 Also, patients with SLE showed a higher frequency of mGCR+ monocytes (accompanied by higher mean fluorescence intensity) than healthy controls. We found even higher maximum levels in patients with SLE (up to 35% positive cells) than in patients with active rheumatoid arthritis in comparable experiments (up to 20% positive cells).10 But as in rheumatoid arthritis, the frequency of mGCR+ B cells was neither markedly different from that in healthy controls nor correlated with SLE disease activity (fig 1). However, in contrast with rheumatoid arthritis, there was no correlation between the frequency of mGCR+ monocytes and disease activity (fig 2). One explanation for these results may be that in rheumatoid arthritis, the activation of blood monocytes has an important role.24 In SLE, however, the production of macrophage‐activating Th1‐type cytokines, such as tumour necrosis factor α and interferon γ, is decreased25 and cytokine patterns in patients with SLE are known to be generally heterogeneous according to the clinical manifestations in the patients.26 Monocytes from patients with SLE are considered to have several defective functions, such as an impaired clearance of apoptotic cells or a decreased release of arachidonic acid.27,28 A correlation of these observations with the expression of mGCR is speculative. Another interesting hypothesis is that low cortisol levels or glucocorticoid resistance may have an influence on or may result from an altered expression of mGCR. The corresponding data regarding cGCR are ambiguous. Gladman et al29 investigated cGCR in PBMC from patients with SLE who were not treated with glucocorticoid. Similar to our study, the number of cGCR was considerably higher in patients with SLE than in controls, and there was also no correlation with disease activity. Tanaka et al30 did not find any difference in cGCR levels between PBMC from patients with SLE with nephrotic syndrome and from controls, with a wide variability. Other reports on cGCR levels in patients with chronic diseases show either an increase or a decrease, even in rheumatoid arthritis.31,32
The second key result of our study is that mean frequencies of mGCR+ monocytes are lower in patients with SLE treated with medium and high doses of glucocorticoids than in those treated with ⩽7.5 mg prednisolone‐equivalent/day (fig 3A). This observation corresponds well with data from our in vitro experiments using LPS‐stimulated monocytes. Here, we also found a trend for a decrease in the frequency of mGCR+ monocytes relative to the control at higher dexamethasone levels (fig 3C). Initial experiments with actinomycin D (inhibits RNA/DNA synthesis) and cycloheximide (inhibits protein synthesis) showed that both drugs decrease the percentage of mGCR+ monocytes compared with LPS alone. This suggests the regulation of mGCR expression to be dependent on transcription and translation, but these data must be interpreted with caution, as the viability of the cells considerably decreased in the presence of these drugs.
Taken together, we consider the most likely explanation to be that glucocorticoids down regulate the expression of mGCR. This effect is speculated to be of therapeutic relevance—especially in patients treated with higher dosages. We still do not have data supporting this assumption, but down regulation of receptors by homologous hormones in the sense of a negative feedback regulation or autoregulation is known for many hormones.33,34 In addition, a glucocorticoid‐induced down regulation is well known for cGCR.35,36,37 With regard to the underlying mechanisms, glucocorticoids are known to cause a decrease in GCR mRNA (either by cGCR promoter repression or by promotor‐independent cGCR gene repression) and to decrease the stability of cGCR mRNA and cGCR protein.38 We suggest similar mechanisms to account for the observed mGCR down regulation, but other mechanisms, such as mGCR‐mediated apoptosis, also need to be considered.
We draw attention to another detail. We found 10–11 mol/l dexamethasone to increase the frequency of mGCR+ monocytes relative to the control, but only when the control value was ⩽50% (fig 3D). This leads us to the hypothesis that dexamethasone at very low concentrations is capable of further enhancing mGCR expression, if the LPS stimulation is not maximal. Glucocorticoids at very low (physiological) concentrations sometimes seem to have (rather small) effects opposite to those observed at high concentrations, which is occasionally called a paradox.39,40,41 Follicle‐stimulating hormone is another hormone that is capable of positively or negatively regulating its own receptor, depending on the concentration and ambient situation.42 A positive autoregulation of GCR has been shown in the human leukaemic T cell line CEM‐C7.43,44 Gametchu et al8,9 reported a positive correlation between mGCR levels and glucocorticoid‐induced apoptosis in another T cell line. Taken together, glucocorticoids at low levels may facilitate mGCR expression to sensitise the cells for mGCR‐mediated apoptosis, which prevents the immune system from over‐reaction. However, this is speculative and further experimental work is needed.
The current focus is on how membrane‐bound steroid receptors find their way to the cell surface. As a transmembrane domain is not known,10 there have to be other post‐translational modifications or transport mechanisms that facilitate membrane insertion of the mGCR protein. For the membrane oestrogen receptor, an association with the membrane protein caveolin‐1 has been found.14 Therefore, we hypothesised caveolin‐1 to be associated with the transport of mGCR to the cell surface. Our data, however, clearly indicate that caveolin‐1 is not the limiting factor of mGCR expression and that mGCR and caveolin‐1 are not colocalised in caveolae. Recently, a palmitoylation‐dependent plasma membrane oestrogen receptor recruitment has been reported.45 This mechanism needs to be investigated in further experiments regarding its relevance for mGCR transport.
We conclude:
Frequencies of mGCR+ monocytes (CD14+) are considerably higher in patients with SLE than in healthy controls.
mGCR are up regulated by inflammatory stimuli and down regulated by glucocorticoids, suggesting a negative feedback loop to control glucocorticoid action.
mGCR are not associated with caveolin‐1 in plasma membrane caveolae.
The first two conclusions give rise to the assumption that drugs binding selectively to the mGCR may prove to be of therapeutic value in the future.
Details of the procedures are available at http://www.annrheumdis.com/supplemental
Acknowledgements
This work was supported by grants from the Deutsche Forschungsgemeinschaft (Bu 1015/1‐1, Bu 1015/4‐1) to FB. We thank Luzie Reiners‐Schramm and Timo Gaber for expert technical assistance.
Abbreviations
cGCR - cytosolic glucocorticoid receptor
Dig - digoxigenin
ECLAM - European Consensus Lupus Activity Measurement
GCR - glucocorticoid receptor
LPS - lipopolysaccharide
mGCR - membrane‐bound glucocorticoid receptors
PBMC - peripheral blood mononuclear cells
PCR - polymerase chain reaction
SLE - systemic lupus erythematosus
SLEDAI - SLE Disease Activity Index
Footnotes
Competing interests: None.
Details of the procedures are available at http://www.annrheumdis.com/supplemental
References
- 1.Buttgereit F, Straub R H, Wehling M, Burmester G R. Glucocorticoids in the treatment of rheumatic diseases: an update on the mechanisms of action. Arthritis Rheum 2004503408–3417. [DOI] [PubMed] [Google Scholar]
- 2.Losel R, Wehling M. Nongenomic actions of steroid hormones. Nat Rev Mol Cell Biol 2003446–56. [DOI] [PubMed] [Google Scholar]
- 3.Cato A C, Nestl A, Mink S. Rapid actions of steroid receptors in cellular signaling pathways. Sci STKE 20022002RE9. [DOI] [PubMed] [Google Scholar]
- 4.Buttgereit F, Scheffold A. Rapid glucocorticoid effects on immune cells. Steroids 200267529–534. [DOI] [PubMed] [Google Scholar]
- 5.Croxtall J D, Choudhury Q, Flower R J. Glucocorticoids act within minutes to inhibit recruitment of signaling factors to activated EGF receptors through a receptor‐dependent, transcription‐independent mechanism. Br J Pharmacol 2000130289–298. [DOI] [PMC free article] [PubMed] [Google Scholar]
- 6.Hafezi‐Moghadam A, Simoncini T, Yang E, Limbourg F P, Plumier J C, Rebsamen M C.et al Acute cardiovascular protective effects of corticosteroids are mediated by non‐transcriptional activation of endothelial nitric oxide synthase. Nat Med 20028473–479. [DOI] [PMC free article] [PubMed] [Google Scholar]
- 7.Orchinik M, Murray T F, Moore F L. A corticosteroid receptor in neuronal membranes. Science 19912521848–1851. [DOI] [PubMed] [Google Scholar]
- 8.Gametchu B, Watson C S, Wu S. Use of receptor antibodies to demonstrate membrane glucocorticoid receptor in cells from human leukemic patients. FASEB J 199371283–1292. [DOI] [PubMed] [Google Scholar]
- 9.Sackey F N, Watson C S, Gametchu B. Cell cycle regulation of membrane glucocorticoid receptor in CCRF‐CEM human ALL cells: correlation to apoptosis. Am J Physiol 1997273E571–E583. [DOI] [PubMed] [Google Scholar]
- 10.Bartholome B, Spies C M, Gaber T, Schuchmann S, Berki T, Kunkel D.et al Membrane glucocorticoid receptors (mGCR) are expressed in normal human peripheral blood mononuclear cells and up‐regulated after in vitro stimulation and in patients with rheumatoid arthritis. FASEB J 20041870–80. [DOI] [PubMed] [Google Scholar]
- 11.Diba F, Watson C S, Gametchu B. 5′UTR sequences of the glucocorticoid receptor 1A transcript encode a peptide associated with translational regulation of the glucocorticoid receptor. J Cell Biochem 200181149–161. [PubMed] [Google Scholar]
- 12.Falkenstein E, Meyer C, Eisen C, Scriba P C, Wehling M. Full‐length cDNA sequence of a progesterone membrane‐binding protein from porcine vascular smooth muscle cells. Biochem Biophys Res Commun 199622986–89. [DOI] [PubMed] [Google Scholar]
- 13.Chambliss K L, Yuhanna I S, Anderson R G, Mendelsohn M E, Shaul P W. ERbeta has nongenomic action in caveolae. Mol Endocrinol 200216938–946. [DOI] [PubMed] [Google Scholar]
- 14.Razandi M, Oh P, Pedram A, Schnitzer J, Levin E R. ERs associate with and regulate the production of caveolin: implications for signaling and cellular actions. Mol Endocrinol 200216100–115. [DOI] [PubMed] [Google Scholar]
- 15.Tan E M, Cohen A S, Fries J F, Masi A T, McShane D J, Rothfield N F.et al The 1982 revised criteria for the classification of systemic lupus erythematosus. Arthritis Rheum 1982251271–1277. [DOI] [PubMed] [Google Scholar]
- 16.Bombardier C, Gladman D D, Urowitz M B, Caron D, Chang C H. Derivation of the SLEDAI. A disease activity index for lupus patients. The Committee on Prognosis Studies in SLE. Arthritis Rheum 199235630–640. [DOI] [PubMed] [Google Scholar]
- 17.Vitali C, Bencivelli W, Isenberg D A, Smolen J S, Snaith M L, Sciuto M.et al Disease activity in systemic lupus erythematosus: report of the Consensus Study Group of the European Workshop for Rheumatology Research. II. Identification of the variables indicative of disease activity and their use in the development of an activity score. The European Consensus Study Group for Disease Activity in SLE. Clin Exp Rheumatol 199210541–547. [PubMed] [Google Scholar]
- 18.Buttgereit F, da Silva J A, Boers M, Burmester G R, Cutolo M, Jacobs J.et al Standardised nomenclature for glucocorticoid dosages and glucocorticoid treatment regimens: current questions and tentative answers in rheumatology. Ann Rheum Dis 200261718–722. [DOI] [PMC free article] [PubMed] [Google Scholar]
- 19.Berki T, Kumanovics G, Kumanovics A, Falus A, Ujhelyi E, Nemeth P. Production and flow cytometric application of a monoclonal anti‐glucocorticoid receptor antibody. J Immunol Methods 199821419–27. [DOI] [PubMed] [Google Scholar]
- 20.Scheffold A, Assenmacher M, Reiners‐Schramm L, Lauster R, Radbruch A. High‐sensitivity immunofluorescence for detection of the pro‐ and anti‐inflammatory cytokines gamma interferon and interleukin‐10 on the surface of cytokine‐secreting cells. Nat Med 20006107–110. [DOI] [PubMed] [Google Scholar]
- 21.Dehio C, Meyer M, Berger J, Schwarz H, Lanz C. Interaction of Bartonella henselae with endothelial cells results in bacterial aggregation on the cell surface and the subsequent engulfment and internalisation of the bacterial aggregate by a unique structure, the invasome. J Cell Sci 1997110(Pt 18)2141–2154. [DOI] [PubMed] [Google Scholar]
- 22.Scheffold A, Miltenyi S, Radbruch A. Magnetofluorescent liposomes for increased sensitivity of immunofluorescence. Immunotechnology 19951127–137. [DOI] [PubMed] [Google Scholar]
- 23.Chan O T, Madaio M P, Shlomchik M J. The central and multiple roles of B cells in lupus pathogenesis. Immunol Rev 1999169107–121. [DOI] [PubMed] [Google Scholar]
- 24.Burmester G R, Stuhlmuller B, Keyszer G, Kinne R W. Mononuclear phagocytes and rheumatoid synovitis. Mastermind or workhorse in arthritis? Arthritis Rheum 1997405–18. [DOI] [PubMed] [Google Scholar]
- 25.Horwitz D A, Gray J D, Behrendsen S C, Kubin M, Rengaraju M, Ohtsuka K.et al Decreased production of interleukin‐12 and other Th1‐type cytokines in patients with recent‐onset systemic lupus erythematosus. Arthritis Rheum 199841838–844. [DOI] [PubMed] [Google Scholar]
- 26.Dean G S, Tyrrell‐Price J, Crawley E, Isenberg D A. Cytokines and systemic lupus erythematosus. Ann Rheum Dis 200059243–251. [DOI] [PMC free article] [PubMed] [Google Scholar]
- 27.Potter P K, Cortes‐Hernandez J, Quartier P, Botto M, Walport M J. Lupus‐prone mice have an abnormal response to thioglycolate and an impaired clearance of apoptotic cells. J Immunol 20031703223–3232. [DOI] [PubMed] [Google Scholar]
- 28.Sipka S, Szanto S, Szucs K, Kovacs I, Kiss E, Antal‐Szamas P.et al Decreased arachidonic acid release in peripheral blood monocytes of patients with systemic lupus erythematosus. J Rheumatol 2001282012–2017. [PubMed] [Google Scholar]
- 29.Gladman D D, Urowitz M B, Doris F, Lewandowski K, Anhorn K. Glucocorticoid receptors in systemic lupus erythematosus. J Rheumatol 199118681–684. [PubMed] [Google Scholar]
- 30.Tanaka H, Akama H, Ichikawa Y, Makino I, Homma M. Glucocorticoid receptor in patients with lupus nephritis: relationship between receptor levels in mononuclear leukocytes and effect of glucocorticoid therapy. J Rheumatol 199219878–883. [PubMed] [Google Scholar]
- 31.Schottelius A, Wedel S, Weltrich R, Rohde W, Buttgereit F, Schreiber S.et al Higher expression of glucocorticoid receptor in peripheral mononuclear cells in inflammatory bowel disease. Am J Gastroenterol 2000951994–1999. [DOI] [PubMed] [Google Scholar]
- 32.Schlaghecke R, Kornely E, Wollenhaupt J, Specker C. Glucocorticoid receptors in rheumatoid arthritis. Arthritis Rheum 199235740–744. [DOI] [PubMed] [Google Scholar]
- 33.LaPolt P S, Jia X C, Sincich C, Hsueh A J. Ligand‐induced down‐regulation of testicular and ovarian luteinizing hormone (LH) receptors is preceded by tissue‐specific inhibition of alternatively processed LH receptor transcripts. Mol Endocrinol 19915397–403. [DOI] [PubMed] [Google Scholar]
- 34.Syvala H, Vienonen A, Zhuang Y H, Kivineva M, Ylikomi T, Tuohimaa P. Evidence for enhanced ubiquitin‐mediated proteolysis of the chicken progesterone receptor by progesterone. Life Sci 1998631505–1512. [DOI] [PubMed] [Google Scholar]
- 35.Cidlowski J A, Cidlowski N B. Regulation of glucocorticoid receptors by glucocorticoids in cultured HeLa S3 cells. Endocrinology 19811091975–1982. [DOI] [PubMed] [Google Scholar]
- 36.Pujols L, Mullol J, Perez M, Roca‐Ferrer J, Juan M, Xaubet A.et al Expression of the human glucocorticoid receptor alpha and beta isoforms in human respiratory epithelial cells and their regulation by dexamethasone. Am J Respir Cell Mol Biol 20012449–57. [DOI] [PubMed] [Google Scholar]
- 37.Sanden S, Tripmacher R, Weltrich R, Rohde W, Hiepe F, Burmester G R.et al Glucocorticoid dose dependent downregulation of glucocorticoid receptors in patients with rheumatic diseases. J Rheumatol 2000271265–1270. [PubMed] [Google Scholar]
- 38.Schaaf M J, Cidlowski J A. Molecular mechanisms of glucocorticoid action and resistance. J Steroid Biochem Mol Biol 20028337–48. [DOI] [PubMed] [Google Scholar]
- 39.Leech M, Metz C, Hall P, Hutchinson P, Gianis K, Smith M.et al Macrophage migration inhibitory factor in rheumatoid arthritis: evidence of proinflammatory function and regulation by glucocorticoids. Arthritis Rheum 1999421601–1608. [DOI] [PubMed] [Google Scholar]
- 40.Morand E F, Leech M. Glucocorticoid regulation of inflammation: the plot thickens. Inflamm Res 199948557–560. [DOI] [PubMed] [Google Scholar]
- 41.Munck A, Guyre P M. Glucocorticoid physiology, pharmacology and stress. Adv Exp Med Biol 198619681–96. [DOI] [PubMed] [Google Scholar]
- 42.LaPolt P S, Tilly J L, Aihara T, Nishimori K, Hsueh A J. Gonadotropin‐induced up‐ and down‐regulation of ovarian follicle‐stimulating hormone (FSH) receptor gene expression in immature rats: effects of pregnant mare's serum gonadotropin, human chorionic gonadotropin, and recombinant FSH. Endocrinology 19921301289–1295. [DOI] [PubMed] [Google Scholar]
- 43.Eisen L P, Elsasser M S, Harmon J M. Positive regulation of the glucocorticoid receptor in human T‐cells sensitive to the cytolytic effects of glucocorticoids. J Biol Chem 198826312044–12048. [PubMed] [Google Scholar]
- 44.Pedersen K B, Vedeckis W V. Quantification and glucocorticoid regulation of glucocorticoid receptor transcripts in two human leukemic cell lines. Biochemistry 20034210978–10990. [DOI] [PubMed] [Google Scholar]
- 45.Li L, Haynes M P, Bender J R. Plasma membrane localization and function of the estrogen receptor alpha variant (ER46) in human endothelial cells. Proc Natl Acad Sci USA 20031004807–4812. [DOI] [PMC free article] [PubMed] [Google Scholar]


