Abstract
Reactive oxygen species are involved in the aging process and diseases. Despite the important role of Cu/Zn SOD (superoxide dismutase) encoded by SOD1, SOD1−/− mice appear to grow normally under conventional breeding conditions. In the present paper we report on a novel finding showing a distinct connection between oxidative stress in erythrocytes and the production of autoantibodies against erythrocytes in SOD1−/− mice. Evidence is presented to show that SOD1 is primarily required for maintaining erythrocyte lifespan by suppressing oxidative stress. A SOD1 deficiency led to an increased erythrocyte vulnerability by the oxidative modification of proteins and lipids, resulting in anaemia and compensatory activation of erythropoiesis. The continuous destruction of oxidized erythrocytes appears to induce the formation of autoantibodies against certain erythrocyte components, e.g. carbonic anhydrase II, and the immune complex is deposited in the glomeruli. The administration of an antioxidant, N-acetylcysteine, suppressed erythrocyte oxidation, ameliorated the anaemia, and inhibited the production of autoantibodies. These data imply that a high level of oxidative stress in erythrocytes increases the production of autoantibodies, possibly leading to an autoimmune response, and that the intake of antioxidants would prevent certain autoimmune responses by maintaining an appropriate redox balance in erythrocytes.
Keywords: anaemia, autoantibody, carbonic anhydrase, oxidative stress, SOD1 deficiency
Abbreviations: ALS, amyotrophic lateral sclerosis; CAII, carbonic anhydrase II; CAT, catalase; DCFH-DA, 2′,7′-dichlorofluorescin diacetate; DHR123, dihydrorhodamine123; GAPDH, glyceraldehyde-3-phosphate dehydrogenase; GPX, glutathione peroxidase; GR, glutathione reductase; HRP, horseradish peroxidase; NAC, N-acetylcysteine; NHS-LC-biotin, N-succinimidyl-6-(biotinamide)hexanoate; Prx, peroxiredoxin; RBC, red blood cell; ROS, reactive oxygen species; SOD, superoxide dismutase; TBARS, thiobarbituric acid-reactive substances; TBS, Tris-buffered saline; TBST, Tris-buffered saline with Tween 20; TRX, thioredoxin
INTRODUCTION
Oxidative stress is intimately involved in aging as well as many other diseases, including inflammation and cancer. Among the known antioxidative protein, SOD (superoxide dismutase) is thought to play a central role because of its ability to scavenge superoxide anions, the primary ROS (reactive oxygen species) generated from molecular oxygen in cells [1]. Constitutive SOD1 expression is a normal occurrence in most tissues, except for keratinocytes and glomerular mesangial cells in which nitrosoglutathione induces SOD1 expression [2,3], while SOD2 expression is regulated by a variety of agents, including inflammatory cytokines, lipopolysaccharide and oxidative stress [4,5]. The SOD1 protein is localized in the cytosol and the intermembrane space of mitochondria, whereas the SOD2 protein is exclusively located in mitochondria [6,7].
The finding that a mutation in SOD1 is a cause of familial ALS (amyotrophic lateral sclerosis) has attracted the interest of many neurologists and other researchers [7,8]. Transgenic mice that express human mutant SOD1 exhibit a similar phenotype to ALS, whereas wild-type mice do not [9,10]. This suggests that elevated levels of ROS are not the actual cause of the disease because SOD activity is increased in the transgenic mice. Subsequently, SOD1 knockout mice have been generated by several groups [11–13]. Unexpectedly, SOD1−/− mice grow normally but develop female infertility [12,13], cochlear hair cell loss [14] and vascular dysfunction [15]. This is in sharp contrast with SOD2−/− mice that die of dilated cardiomyopathy during the neonatal stage [16]. Intervention frequently leads to a more severe increase in pathological conditions in many organs of SOD1−/− mice than is the case for wild-type mice [11,17–19]. Reports on the phenotype related to genetic instability have been published recently [20,21]. Hepatocarcinogenesis occurs later in life [20] and the rate of spontaneous mutation increases in SOD1-deficient mice [21].
During careful, long-term observation we have become aware of some abnormalities in SOD1−/− mice and have found a causal connection between enhanced oxidative stress in erythrocytes and autoantibody production against erythrocytes. This finding may provide insight into the roles of oxidative stress in the autoimmune response.
EXPERIMENTAL
Animals
Three pairs of B6 SOD1+/− mice, originally established by Matzuk et al. [13], were purchased through Jackson Laboratories and bred at our institute. The animal room climate was kept under specific pathogen-free conditions at a constant temperature of 20–22 °C with a 12 h light/12 h dark cycle. Animal experiments were performed in accordance with the Declaration of Helsinki under the protocol approved by the Animal Research Committee of this institution.
RBC (red blood cell) turnover assay
The RBC lifespan was assayed by in vivo- and in vitro-biotinylation followed by FACS analyses [22]. RBCs were labelled with biotin in vivo by an intravenous injection of 200 μl of a 10 mg/ml solution of NHS-LC-biotin [N-succinimidyl-6-(biotinamido)hexanoate; Pierce] in PBS (pH 7.4). Alternatively, RBC collected from SOD1+/+ and SOD1−/− mice were washed in PBS and labelled in a solution of 10 mM NHS-LC-biotin in PBS. After a 1 h incubation at 25 °C, RBC were washed and suspended in PBS, and 200 ml was then injected into the tail vein. The first blood sample used in determining the quantity of biotinylated RBCs was obtained 1 h after either the injection of NHS-LC-biotin or the transfusion of biotinylated cells. Blood samples were obtained from the tail vein at 5 day intervals for the quantification of biotin-labelled cells remaining in the circulation. For FACS analysis (FACSCalibur; Becton Dickinson), blood samples were washed with PBS and incubated with R-phycoerythrin-conjugated streptavidin solution (Wako) for 30 min at 25 °C in the dark. After washing with PBS, the RBC samples were subjected to the flow cytometric detection of phycoerythrin-labelled cells. The percentage of biotinylated cells was calculated as a ratio of positive cells to all RBCs.
Flow cytometry analyses of ROS and bound IgG to RBCs
After incubating blood with 20 μM DCFH-DA (2′,7′-dichlorofluorescin diacetate) or 25 μM DHR123 (dihydrorhodamine123; Molecular Probes), the fluorescence intensity of RBCs was measured by FACS analysis. The IgG bound to RBCs was assessed for RBC that had been washed with PBS three times followed by incubation with FITC-conjugated rabbit anti-mouse IgG (100 times dilution; Dako) [23].
Immunoblot analyses
RBCs collected from SOD1+/+ and SOD1−/− mice were washed three times with PBS, and lysed in 20 mM Tris/HCl (pH 7.4). The lysate was centrifuged at 17000 g for 10 min in a microcentrifuge. Protein concentrations of the supernatant were determined using a BCA (bicinchoninic acid) kit (Pierce). Total proteins (30 μg) were separated on SDS/PAGE (15% gels) and electroblotted on to PVDF membranes (Amersham). The blots were blocked with 10% non-fat dried skimmed milk in TBS (Tris-buffered saline) and then incubated with the polyclonal anti-rat SOD1 antiserum [24], anti-rat cytosolic GPX (glutathione peroxidase)1 [25], anti-CAT (catalase; Carbiochem), anti-rat TRX (thioredoxin) [26], anti-rat Prx (peroxiredoxin)I [27] or GAPDH (glyceraldehyde-3-phosphate dehydrogenase; Santa Cruz) diluted in TBST (TBS containing 0.1% Tween 20) overnight at 4 °C. After washing twice in TBST for 30 min, the blots were incubated with HRP (horseradish peroxidase)-conjugated goat anti-rabbit IgG antibody (Santa Cruz). After washing, the presence of bound HRP was detected by chemiluminescence with an ECL® plus detection reagent (Amersham) and exposed to X-ray film.
Immunoprecipitation
Purified bovine CAII (carbonic anhydrase II; Sigma) was used to immunize a female rabbit. RBC lysates or purified bovine CAII were pre-cleaned for non-specific binding with 30 μl Protein G–agarose. The cleaned samples were then mixed overnight at 4 °C with 30 μl Protein G–agarose incubated at 4 °C for 4 h with 2 μg/ml anti-CAII polyclonal antibody. After the addition of 30 μl of Protein G–agarose, the immunoprecipitates were mixed for a further 1 h at 4 °C. The mixture was washed three times, and the pellet, after boiling in 10 ml of SDS-loading dye, was subjected to SDS/PAGE (6% gels). The proteins were then transferred to Hybond-P membrane (Amersham), which was subsequently incubated with serum from mice (1:50 dilution) or an anti-CAII monoclonal antibody (1:1000 dilution; Santa Cruz). Detection of immuno-reactive bands was performed as described above.
ELISA
Each well of a multititre plate (Nunc) was coated with 10 μg/ml of bovine erythrocyte CAII (Sigma) in PBS and allowed to adsorb at 4 °C overnight. CAII-coated plates were then blocked with 2-fold diluted Immunoblock (Dainihonseiyaku) for 1 h at 37 °C. To quantify the autoantibody to CAII, blood plasma collected from mice was diluted 1:50 in blocking buffer. After incubation with plasma for 1 h at 37 °C, the plates were washed three times with PBS containing 0.05% Tween 20 and then reacted with an HRP-conjugated anti-mouse IgG (Santa Cruz) for 1 h. Assays were performed in duplicate and the absorbance was determined at 495 nm.
Enzyme assays
EDTA-treated blood from SOD1+/+ and SOD1−/− mice was washed in cold PBS. The plasma and buffy coat were drawn off directly after centrifugation. Packed cells were washed twice and suspended in 20 mM Tris/HCl (pH 7.4). After centrifugation at 17000 g for 15 min, the supernatant was collected and used for assaying enzyme activities. SOD activity was determined using WST-1 [2-(4-iodophenyl)-3-(4-nitrophenyl)-5-(2,4-disulfophenyl)-2H-tetrazolium] (Dojindo) for the detection of superoxide anions as described previously [24]. The reaction mixture contained an appropriate amount of diluted xanthine oxidase (Roche), 0.1 mM xanthine (Wako), 0.025 mM WST-1, 0.1 mM EDTA and 50 mM NaHCO3 (pH 10.2), in a total volume of 3 ml. The increase in the absorbance at 438 nm was monitored at 25 °C for 1 min. One unit was defined as the amount of enzyme required to inhibit 50% of an absorbance change of 0.06/min and is equivalent to 0.8 unit determined by the standard procedure using the cytochrome c assay according to the manufacture's protocol. MnSOD activities were defined as 1 mM NaCN-resistant activity. GPX activity was determined by an indirect assay that links GPX-mediated oxidation of glutathione with the recycled reduction of GSSG to GSH by GR (glutathione reductase) using NADPH as a reductant [25]. Quantification of CAT activity was assayed by measuring the decomposition of H2O2 by monitoring the absorbance at 240 nm [26]. The reaction was started by the addition of 30 μg total protein to a reaction buffer containing 50 mM Tris/HCl, (pH 7.4), 0.25 mM EDTA and 10 mM H2O2. CAT activity was defined as the rate of disappearance of H2O2 during the initial 30 s.
Immunohistochemical analysis
For detection of immune complex in the kidney, sections were reacted with FITC-conjugated rabbit anti-mouse IgG or FITC-conjugated anti-mouse C3 (Cappel, #55510). The resulting slides were then washed in water, dehydrated by passing through a series of graded ethanol solutions, and mounted. Photographs were taken using a digital camera under a light microscope BX50 (Olympus).
Methaemoglobin formation assay
Fresh RBCs collected from SOD1+/+ and SOD1−/− mice were incubated in various concentrations of xanthine oxidase (Boehringer) in PBS containing 2 mM hypoxanthine (Wako Pure Chemicals). After a 30 min incubation at 25 °C, cells were pelleted by centrifugation at 600 g and lysed with 50 mM Tris/HCl (pH 6.6). Total haemoglobin and methaemoglobin concentrations in the samples were determined spectrophotometrically.
Assay for lipid peroxidation
TBARS (thiobarbituric acid-reactive substances) were determined as described previously [24]. For each measurement, 1×10⁷ RBCs were collected and washed twice with PBS. After suspending the cell pellet in 0.3 ml PBS, a 10 ml aliquot of the suspension was retained for use in a protein determination assay. The cell suspension was combined with 0.6 ml of a reagent containing 15% trichloroacetic acid, 0.375% (w/v) thiobarbituric acid, 0.25 M HCl and 1.8 mM butylhydroxytoluene, and mixed thoroughly. The solution was heated for 15 min in boiling water, cooled in ice-cold water, and centrifuged at 10000 g for 10 min. The absorbance of the sample was measured at 535 nm. TBARS levels were calculated using an extinction coefficient of 1.56×10⁵ M−1 ·cm−1.
Statistical analysis
Statistical analyses of the data were carried out using the Mann-Whitney U-test. *P<0.05, **P<0.01.
RESULTS
Anaemic phenotype of SOD1-deficient mice
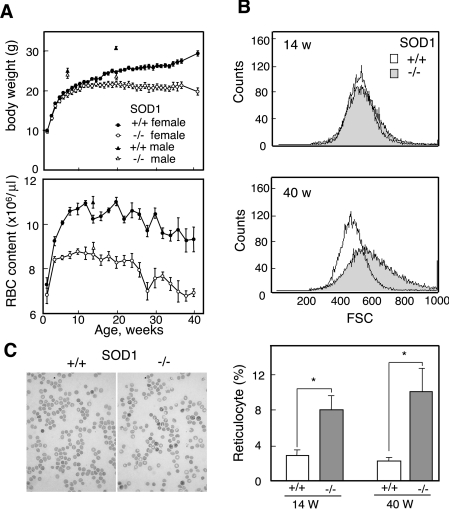
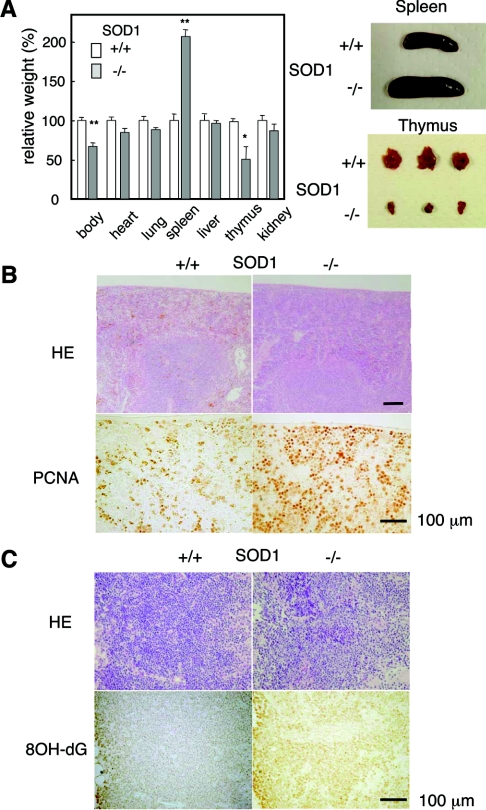
We found that SOD1−/− mice were significantly smaller than their SOD1+/− or SOD1+/+ littermates, and that their erythrocyte levels were low, even in infant mice (Figure 1A). This anaemic phenotype was supported by low haematocrit values and a low haemoglobin content (results not shown). An examination of erythrocyte size by FACS showed that the heterogeneity of erythrocyte sizes increased during aging in SOD1−/− mice and that the average sizes were larger than those in SOD1+/+ mice (Figure 1B). Since enlargement is a characteristic of aged erythrocytes that are efficiently trapped by the reticuloendothelial system followed by destructive elimination [28], these data suggest that the accelerated destruction of erythrocytes is the cause of the anaemia. In contrast with erythrocytes, the blood levels of reticulocytes (Figure 1C) as well as platelets (results not shown) were significantly high and were increased with aging. Thus elevated erythropoiesis occurs as a compensatory reaction in anaemia. The dissection of SOD1−/− mice revealed splenomegaly, which was already evident at 4 weeks of age, with the simultaneous proliferation of both red pulp and white pulp (Figures 2A and 2B), and thymic atrophy with elevated oxidation of DNA, as judged by immunohistochemical staining with 8-hydroxyguanine (Figures 2A and 2C).
Figure 1. Anaemia and elevated haematopoiesis in SOD1−/− mice.
(A) Age-dependent changes in body weight (upper panel) and erythrocyte content (lower panel) in blood of SOD1+/+ and SOD1−/− mice (n=9–25). (B) The sizes of the erythrocytes were larger in SOD1−/− mice as judged by FACS analysis. (C) RBC stained with New Methylene Blue. Comparison of population of reticulocytes in SOD1−/− and SOD1+/+ mice at 14 and 40 weeks of age.
Figure 2. Comparison of organs between SOD1+/+ and SOD1−/− mice.
(A) Relative weight ratios (%) of each organ in SOD1−/− mice to values for SOD1+/+ mice at 40 weeks of age are shown. n=7 for SOD+/+ and n=8 for SOD−/−. Examples of dissected spleen and thymus are shown on the right. (B) HE staining and immunohistochemial detection of PCNA (proliferating-cell nuclear antigen) in the spleen at 24 weeks of age. (C) Sections of the thymus stained with HE and immunostained using an anti-8-hydroxyguanine (8OH-dG) antibody.
Evidence of increased oxidative stress in RBCs
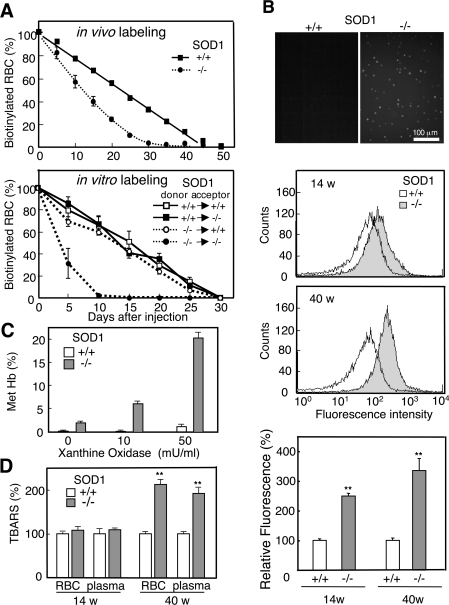
We examined the lifespan of erythrocytes in the mice to confirm the accelerated destruction of erythrocytes. In vivo-biotinylation of erythrocytes, produced by intravenously injecting NHS-LC-biotin, showed that the lifespan of erythrocytes in SOD1−/− mice was decreased to about 60% the level in SOD1+/+ mice (Figure 3A, upper panel). We also collected blood from both SOD1+/+ and SOD1−/− mice, biotinylated the erythrocytes in vitro, and injected them back into the mice (Figure 3A, lower panel). A shorter lifespan of erythrocytes in in vitro labelling compared with in vivo labelling would be caused by exposure to high oxygen and mechanical damage during the labelling process. A shortened erythrocyte lifespan was evident only in SOD1−/− mice that had received erythrocytes of SOD1−/− mice. This suggests that the short lifespan of erythrocytes in SOD1−/− mice can be attributed, not only to an endogenous factor in erythrocytes, but also to an environmental factor in circulation.
Figure 3. Elevated oxidative stress and increased vulnerability in SOD1-deficient erythrocytes.
(A) NHS-LC-biotin was intravenously injected into 12-week-old mice at day 0 (upper panel). Blood, collected from SOD1+/+ and SOD1−/− mice, was biotinylated in vitro and returned to either SOD1+/+ or SOD1−/− mice (lower panel). At the indicated time points, an aliquot of blood was reacted with phycoerythrin-conjugated streptavidin followed by FACS analysis to determine the fraction of labelled RBCs remaining. n=3 for SOD1+/+ and n=6 for SOD1−/−. (B) Blood collected from SOD1+/+ or SOD1−/− was incubated with DHR123 and observed under a fluorescent microscope (top panel). ROS levels of RBCs at 14- and 40-week-old mice were determined by DCFH-DA staining followed by FACS analysis (middle panels). Relative fluorescent intensity of RBC from SOD1+/+ and SOD1−/− mice using DCFH-DA (bottom panel). (C) After incubating erythrocytes with hypoxanthine/xanthine oxidase, the methaemoglobin content was measured. (D) Lipid peroxidation products were quantified as TBARS (n=4).
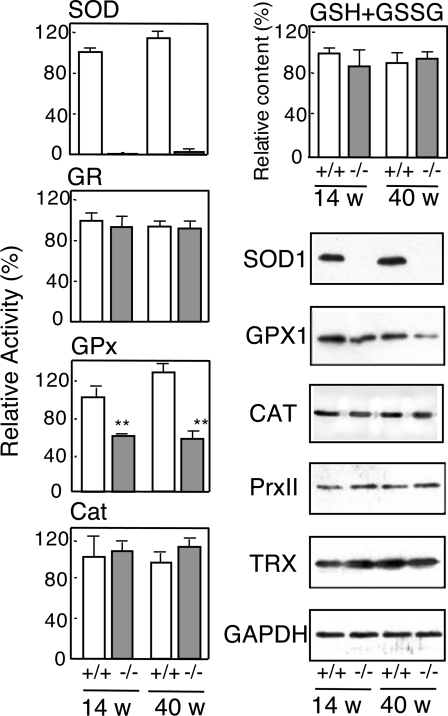
The detection of ROS by the peroxide-sensitive fluorescent probes, DHR123 and DCFH-DA, clearly indicated that ROS levels in erythrocytes were elevated in SOD1−/− mice compared with SOD1+/+ mice and that the difference was enhanced with age (Figure 3B). The aging-dependent increase in ROS levels in mice may, in part, be explained by a shift in the ratio of fresh to old erythrocytes during aging. In addition, environmental factors that accumulate in plasma during aging would be responsible for the elevated oxidative stress as discussed later. When erythrocytes were incubated in a superoxide-generating system using xanthine oxidase and hypoxanthine, ROS levels in erythrocytes were maintained at high levels (results not shown) and haemoglobin was prone to oxidation to methaemoglobin in SOD1−/− mice (Figure 3C). The products of lipid peroxidation, as judged by TBARS, were low in young mice, but were actually elevated in erythrocytes and blood plasma of aged SOD1−/− mice (Figure 3D). An examination of the major anti-oxidative enzymes in erythrocytes showed that GPX activity and the level of GPX1 protein were decreased significantly in SOD1−/− mice, while CAT levels remained unchanged (Figure 4). The levels of total glutathione, oxidized glutathione (see Figure 1 of supplementary data at http://www.BiochemJ.org/bj/402/bj4020219add.htm), GR, Trx and PrxII, a thioredoxin-dependent peroxidase, were also unchanged.
Figure 4. Levels of anti-oxidative/redox proteins in erythrocytes from SOD1+/+ and SOD1−/− mice.
Activities of SOD, GR, GPX and CAT, and levels of total glutathione (GSH+GSSG) in erythrocytes were measured (n=4). Immunoblot analyses of the samples were also performed for anti-SOD1, anti-GPX1, anti-CAT, anti-thioredoxin (TRX), anti-PrxI and anti-GAPDH.
Autoimmune responses in SOD1−/− mice
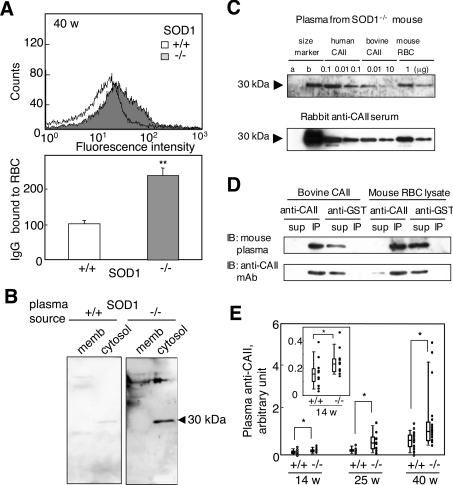
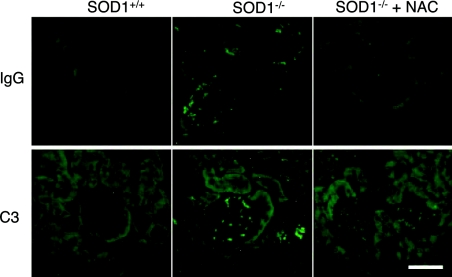
Since the binding of IgG to erythrocytes accelerates their removal by the reticuloendothelial system, we examined the levels of IgG bound to erythrocytes and found that it was significantly higher in SOD1−/− mice compared with SOD1+/+ mice (Figure 5A). When erythrocyte proteins were blotted on to a nylon membrane and incubated with plasma from SOD1+/+ and SOD1−/− mice, strongly reactive bands, especially 30 kDa in mass, were observed in plasma from SOD1−/− mice, but were observed to be weak in SOD1+/+ mice (Figure 5B). Since carbonic anhydrase within a molecular mass marker was also reactive to the plasma and the positive band matched its mass (Figure 5C), CAII, an isoform of which is present in erythrocytes, was deemed to be strong candidate for the 30 kDa antigenic protein. We then raised an antiserum against bovine CAII in rabbits and used it in an immunoprecipitation study (Figure 5D). After incubation with the antiserum, the 30 kDa immunoreactive band reactive to the mouse plasma disappeared and, instead, the immunoprecipitated protein reacted with an anti-CAII monoclonal antibody, which led us to conclude that the 30 kDa protein was identical with mouse CAII. Although it is unlikely that anti-CAII plays a role in IgG binding to RBCs because CAII is a cytosolic protein, we hypothesized that CAII became an autoantigen owing to accelerated destruction of erythrocytes, and hence we used the anti-CAII IgG as a marker of autoantibodies to erythrocytes. Purified bovine CAII was plated on to an immunoplate and incubated with blood plasma from SOD1+/+ and SOD1−/− mice. As a result, bound fractions in the plasma from SOD1−/− mice were significantly higher than that from SOD1+/+ mice and were increased in aged mice (Figure 5E). The immunofluorescent detection of IgG and C3 in the kidney indicates that the immune complex was deposited in the glomeruli (Figure 6), which is typically observed in some autoimmune diseases.
Figure 5. Production of autoantibodies to erythrocytes in SOD1-deficient mice.
(A) Detection of IgG bound to erythrocytes from SOD1−/− mice. Collected erythrocytes were reacted with FITC-labelled anti-mouse IgG followed by FACS analysis. Relative values of bound IgG are shown. n=7 for SOD1+/+ and n=5 for SOD1−/−. (B) Cytosolic and membrane fractions of RBCs were incubated with blood plasma from SOD1+/+ and SOD1−/− mice (1:50 dilution) followed by reaction with an HRP-conjugated anti-mouse IgG. (C) Immunoblot analysis using blood plasma from an SOD1−/− mouse and serum of a rabbit that had been immunized with bovine CAII. Western blot analysis of human CAII and RBCs with blood plasma from a SOD1−/− mouse at 40 weeks of age (1:50 dilution; upper panel). While mass marker b contains CAII, mass marker a does not. Characteristics of an anti-bovine CAII antibody (1:1000 dilution) raised in rabbit by immunoblotting of the same samples (lower panel); representative of several experiments. (D) Immunoprecipitation of bovine CAII and lysate of mouse RBCs with an anti-bovine CAII polyclonal antibody. Immunoblotting was performed with blood plasma from SOD1−/− mice and an anti-CAII monoclonal antibody (mAb). Representative data from several experiments. (E) The titres of the anti-CAII antibody in blood plasma were elevated, as judged by ELISA. The inset shows an enlargement of the results obtained for SOD1+/+ and SOD1−/− mice at 14 weeks of age.
Figure 6. Immunofluorescent detection of IgG and C3 in the kidney of mice.
Sections from kidney of SOD1+/+ and SOD1−/− mice at 25 weeks of age with or without administration of NAC for 20 weeks were reacted with anti-mouse IgG or anti-C3 antibodies followed by FITC-labelled anti-rabbit IgG. Bar=100 μm.
An antioxidant, NAC (N-acetylcysteine), suppressed oxidative stress, anaemia and the inflammatory response
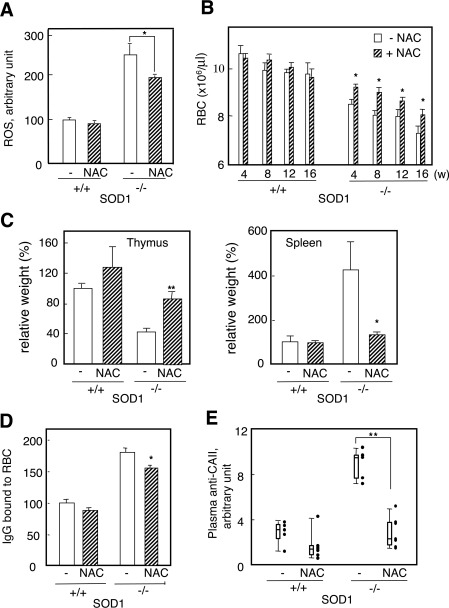
To explore a possible causal connection between the elevated production of the autoantibody and oxidative stress to erythrocytes, we examined the issue of whether an antioxidant, NAC [29], could suppress them in SOD1−/− mice. At 4–5 weeks after birth, we began to administer NAC (1.0% in the drinking water) to both SOD1+/+ and SOD1−/− mice, and bred them for a further 5 months. In the SOD1−/− mice group, NAC significantly suppressed ROS in erythrocytes (Figure 7A) and partly improved the anaemia (Figure 7B). The weights (Figure 7C) and histological appearance (results not shown) of the spleen and thymus reached near normal levels in SOD1−/− mice. The levels of the fraction of IgG bound to erythrocytes (Figure 7D) and the autoantibody against CAII (Figure 7E) were decreased in the NAC-administered SOD1−/− group. The deposition of the immune complex in the glomeruli was also suppressed by the administration of NAC (Figure 6).
Figure 7. Amelioration of oxidative stress, anaemia and autoantibody production in SOD1−/− mice by NAC treatment for 20 weeks.
(A) Treatment with NAC suppressed intracellular ROS in RBCs as judged by FACS. (B) Treatment with NAC ameliorated anaemia (n=10–12). (C) Treatment with NAC ameliorated splenomegaly and thymus degeneration. Comparison of the weights of the spleen and thymus in SOD1−/− mice with or without NAC treatment. Relative ratios (%) to values of control mice without NAC treatment are shown. (D) Treatment with NAC decreased levels of bound IgG to erythrocytes. (E) Treatment with NAC decreased the plasma level of the antibody against CAII.
DISCUSSION
In the present study we report that novel phenotypes of SOD1−/− mice become evident during aging. Anaemia appears to be caused by increased vulnerability of erythrocytes due to a SOD1 deficiency. Since mammalian erythrocytes lack nuclei, they are incapable of replacing damaged proteins. In addition, while most mammalian cells possess two intracellular SOD isoforms to protect against ROS [1], erythrocytes lack mitochondria and, as a result, carry only the SOD1 protein to scavenge superoxide anions. Erythrocytes of SOD1−/− mice, therefore, face severe oxygen toxicity compared with other tissues. This unique nature of erythrocytes in SOD1−/− mice would cause them to be more vulnerable to ROS and shorten their lifespan. Anaemia was also observed in SOD2+/+ mice with bone marrow transplanted from SOD2−/− mice [22,30], but this could be caused by a defect in the process of differentiation to erythrocytes, because SOD2 is absent in erythrocytes. A deficiency in other antioxidative proteins, PrxI [31] and PrxII [32], which catalytically function as thioredoxin-dependent peroxidases, also causes anaemia by affecting the lifespan of erythrocytes. Since levels of erythrocyte PrxII protein, which is the only Prx member in erythrocytes, were not changed, a contribution of PrxII to anaemia in SOD1−/− mice is unlikely. However, mild anaemia was also observed in young mice when ROS levels were low (Figures 1 and 3), suggesting the involvement of something else in causing anaemia in SOD1−/− mice.
In addition to a SOD1 deficiency, we found that GPX activity and protein levels of GPX1 were significantly lower in erythrocytes. Since GPX1 protein is prone to oxidative inactivation [33,34], oxidized GPX1 would be removed by the protease that degrades oxidized proteins in erythrocytes [35,36]. Attenuation of GPX activity is observed at 14 and 40 weeks in erythrocytes of SOD1−/− mice and does not exactly match the changes in ROS levels shown in Figure 3(B). The fluorescent dyes used as ROS indicators react with various ROS, including hydrogen peroxide. On the other hand, GPX1 protein mainly reacts with hydrogen peroxide. Thus it is hard to compare directly these two phenomena. Defects in two major anti-oxidative enzymes would make erythrocytes more vulnerable to oxidative stress and accelerate destructive elimination in SOD1−/− mice. Moreover, we observed the production of an autoantibody to erythrocytes in SOD1−/− mice and identified CAII as a major cytosolic autoantigen. SOD1 deficiency causes oxidative stress not only to erythrocytes but also to plasma in the cardiovascular system, as judged by elevated lipid peroxidation in plasma. Both the cytotoxic lipid peroxidation products, such as 4-hydroxynonenal, and autoantibodies to erythrocytes are present in aged SOD1−/− mice and appear to be responsible for haemolytic destruction of oxidatively modified erythrocytes from SOD1−/− mice.
A high frequency of the presence of an autoantibody to CAII has been reported in systemic lupus erythematosus and Sjögren syndrome [37], and the development of sialoadenitis, a characteristic of Sjögren syndrome, has been reported in mice that have been immunized with CAII [38]. However, it is unlikely that the anti-CAII antibody plays a role in the destruction of erythrocytes, as seen in autoimmune haemolytic anaemia, because CAII is a cytosolic protein. An anion exchanger (band 3) is a predominant autoantigen in erythrocyte membranes [39,40] and may correspond to the positive band observed at a high molecular mass in Figure 5(B). In addition, a lipid peroxidation product, 4-hydroxynonenal, and/or its protein adduct may be an antigen in oxidized erythrocytes [41].
When we examined the possible involvement of regulatory T cells, no significant difference was observed in the population of CD4+Foxp3+ regulatory T cells in the thymus (approx. 3–6%) between SOD1+/+ and SOD1−/− mice at 5 weeks of age, suggesting that the immune system was not affected. It is known that oxidation leads to an increase in the antigenicity of erythrocytes when injected into peritonea [42]. Collectively, these findings suggest that oxidation-enhanced antigenicity of erythrocytes and accelerated destruction of oxidized erythrocytes co-ordinately caused autoantibody production in SOD1−/− mice. Animals would not be immunologically tolerant to oxidized materials because the immune system matures in young age, but oxidation products are largely produced during the aging process. Thus an antibody against oxidized materials could be produced without a defect in the immunological system. Autoimmune diseases affect approx. 5% of the population, and the incidence of systemic lupus erythematosus in women is nine times greater than in men [43]. In SOD1−/− mice, however, a sex difference has not been observed for the autoantibody production. This could be explained by assuming that the degeneration of erythrocytes by elevated ROS occurs with equal ease in male and female SOD1−/− mice.
Our data show that the erythrocyte is the preferred target of oxidative modification in the blood and is prone to degradation, leading to anaemia. Since oxidized erythrocyte components are antigenic in regards to the formation of autoantibodies, a long-term exposure to severe oxidative stress consequently causes an autoimmune response to oxidized erythrocytes that can be regarded as an acquired antigen by oxidative modification. The continuous oxidation and destruction of erythrocytes would ultimately produce a sufficient amount of antibodies to generate autoimmune diseases.
Online data
Acknowledgments
This work was supported, in part, by the 21st Century COE (Centre of Expertise) Programme and by Grant-in-Aid for Scientific Research (C) (No. 16590238) from the JSPS (Japan Society for the Promotion of Science).
References
- 1.Fridovich I. Superoxide radical and superoxide dismutases. Annu. Rev. Biochem. 1995;64:97–112. doi: 10.1146/annurev.bi.64.070195.000525. [DOI] [PubMed] [Google Scholar]
- 2.Frank S., Stallmeyer B., Kampfer H., Kolb N., Pfeilschifter J. Nitric oxide triggers enhanced induction of vascular endothelial growth factor expression in cultured keratinocytes (HaCaT) and during cutaneous wound repair. FASEB J. 1999;13:2002–2014. [PubMed] [Google Scholar]
- 3.Frank S., Kampfer H., Podda M., Kaufmann R., Pfeilschifter J. Identification of copper/zinc superoxide dismutase as a nitric oxide-regulated gene in human (HaCaT) keratinocytes: implications for keratinocyte proliferation. Biochem. J. 2000;346:719–728. [PMC free article] [PubMed] [Google Scholar]
- 4.Wong G. H., Goeddel D. V. Induction of manganous superoxide dismutase by tumor necrosis factor: possible protective mechanism. Science. 1988;242:941–944. doi: 10.1126/science.3263703. [DOI] [PubMed] [Google Scholar]
- 5.Visner G. A., Dougall W. C., Wilson J. M., Burr I. A., Nick H. S. Regulation of manganese superoxide dismutase by lipopolysaccharide, interleukin-1, and tumor necrosis factor. Role in the acute inflammatory response. J. Biol. Chem. 1990;265:2856–2864. [PubMed] [Google Scholar]
- 6.Okado-Matsumoto A., Fridovich I. Subcellular distribution of superoxide dismutases (SOD) in rat liver: Cu,Zn-SOD in mitochondria. J. Biol. Chem. 2001;276:38388–38393. doi: 10.1074/jbc.M105395200. [DOI] [PubMed] [Google Scholar]
- 7.Valentine J. S., Doucette P. A., Potter S. Z. Copper-zinc superoxide dismutase and amyotrophic lateral sclerosis. Annu. Rev. Biochem. 2005;74:563–593. doi: 10.1146/annurev.biochem.72.121801.161647. [DOI] [PubMed] [Google Scholar]
- 8.Rosen D. R., Siddique T., Patterson D., Figlewicz D. A., Sapp P., Hentati A., Donaldson D., Goto J., O'Regan J. P., Deng H. X., et al. Mutations in Cu/Zn superoxide dismutase gene are associated with familial amyotrophic lateral sclerosis. Nature. 1993;362:59–62. doi: 10.1038/362059a0. [DOI] [PubMed] [Google Scholar]
- 9.Gurney M. E., Pu H., Chiu A. Y., Dal Canto M. C., Polchow C. Y., Alexander D. D., Caliendo J., Hentati A., Kwon Y. W., Deng H. X., et al. Motor neuron degeneration in mice that express a human Cu,Zn superoxide dismutase mutation. Science. 1994;264:1772–1775. doi: 10.1126/science.8209258. [DOI] [PubMed] [Google Scholar]
- 10.Wong P. C., Pardo C. A., Borchelt D. R., Lee M. K., Copeland N. G., Jenkins N. A., Sisodia S. S., Cleveland D. W., Price D. L. An adverse property of a familial ALS-linked SOD1 mutation causes motor neuron disease characterized by vacuolar degeneration of mitochondria. Neuron. 1995;14:1105–1116. doi: 10.1016/0896-6273(95)90259-7. [DOI] [PubMed] [Google Scholar]
- 11.Reaume A. G., Elliott J. L., Hoffman E. K., Kowall N. W., Ferrante R. J., Siwek D. F., Wilcox H. M., Flood D. G., Beal M. F., Brown R. H., Jr, et al. Motor neurons in Cu/Zn superoxide dismutase-deficient mice develop normally but exhibit enhanced cell death after axonal injury. Nat. Genet. 1996;3:43–47. doi: 10.1038/ng0596-43. [DOI] [PubMed] [Google Scholar]
- 12.Ho Y. S., Gargano M., Cao J., Bronson R. T., Heimler I., Hutz R. J. Reduced fertility in female mice lacking copper-zinc superoxide dismutase. J. Biol. Chem. 1998;273:7765–7769. doi: 10.1074/jbc.273.13.7765. [DOI] [PubMed] [Google Scholar]
- 13.Matzuk M. M., Dionne L., Guo Q., Kumar T. R., Lebovitz R. M. Ovarian function in superoxide dismutase 1 and 2 knockout mice. Endocrinology. 1998;139:4008–4011. doi: 10.1210/endo.139.9.6289. [DOI] [PubMed] [Google Scholar]
- 14.McFadden S. L., Ding D., Reaume A. G., Flood D. G., Salvi R. J. Age-related cochlear hair cell loss is enhanced in mice lacking copper/zinc superoxide dismutase. Neurobiol. Aging. 1999;20:1–8. doi: 10.1016/s0197-4580(99)00018-4. [DOI] [PubMed] [Google Scholar]
- 15.Didion S. P., Ryan M. J., Didion L. A., Fegan P. E., Sigmund C. D., Faraci F. M. Increased superoxide and vascular dysfunction in CuZnSOD-deficient mice. Circ. Res. 2002;91:938–944. doi: 10.1161/01.res.0000043280.65241.04. [DOI] [PubMed] [Google Scholar]
- 16.Li Y., Huang T. T., Carlson E. J., Melov S., Ursell P. C., Olson J. L., Noble L. J., Yoshimura M. P., Berger C., Chan P. H., et al. Dilated cardiomyopathy and neonatal lethality in mutant mice lacking manganese superoxide dismutase. Nat. Genet. 1995;11:376–381. doi: 10.1038/ng1295-376. [DOI] [PubMed] [Google Scholar]
- 17.Shefner J. M., Reaume A. G., Flood D. G., Scott R. W., Kowall N. W., Ferrante R. J., Siwek D. F., Upton-Rice M., Brown R. H., Jr Mice lacking cytosolic copper/zinc superoxide dismutase display a distinctive motor axonopathy. Neurology. 1999;53:1239–1246. doi: 10.1212/wnl.53.6.1239. [DOI] [PubMed] [Google Scholar]
- 18.Yoshida T., Maulik N., Engelman R. M., Ho Y. S., Das D. K. Targeted disruption of the mouse Sod I gene makes the hearts vulnerable to ischemic reperfusion injury. Circ. Res. 2000;86:264–269. doi: 10.1161/01.res.86.3.264. [DOI] [PubMed] [Google Scholar]
- 19.Ishii T., Matsuki S., Iuchi Y., Okada F., Toyosaki S., Tomita Y., Ikeda Y., Fujii J. Accelerated impairment of spermatogenic cells in sod1-knockout mice under heat stress. Free Radical Res. 2005;39:697–705. doi: 10.1080/10715760500130517. [DOI] [PubMed] [Google Scholar]
- 20.Elchuri S., Oberley T. D., Qi W., Eisenstein R. S., Jackson Roberts L., Van Remmen H., Epstein C. J., Huang T. T. CuZnSOD deficiency leads to persistent and widespread oxidative damage and hepatocarcinogenesis later in life. Oncogene. 2005;24:367–380. doi: 10.1038/sj.onc.1208207. [DOI] [PubMed] [Google Scholar]
- 21.Busuttil R. A., Garcia A. M., Cabrera C., Rodriguez A., Suh Y., Kim W. H., Huang T. T., Vijg J. Organ-specific increase in mutation accumulation and apoptosis rate in CuZn-superoxide dismutase-deficient mice. Cancer Res. 2005;65:11271–11275. doi: 10.1158/0008-5472.CAN-05-2980. [DOI] [PubMed] [Google Scholar]
- 22.Friedman J. S., Lopez M. F., Fleming M. D., Rivera A., Martin F. M., Welsh M. L., Boyd A., Doctrow S. R., Burakoff S. J. SOD2-deficiency anemia: protein oxidation and altered protein expression reveal targets of damage, stress response, and antioxidant responsiveness. Blood. 2004;104:2565–2573. doi: 10.1182/blood-2003-11-3858. [DOI] [PubMed] [Google Scholar]
- 23.Lee J. M., Chan K., Kan Y. W., Johnson J. A. Targeted disruption of Nrf2 causes regenerative immune-mediated hemolytic anemia. Proc. Natl. Acad. Sci. U.S.A. 2001;101:9751–9756. doi: 10.1073/pnas.0403620101. [DOI] [PMC free article] [PubMed] [Google Scholar]
- 24.Otsu K., Ikeda Y., Fujii J. Accumulation of manganese superoxide dismutase under metal-depleted conditions: proposed role for zinc ions in cellular redox balance. Biochem. J. 2004;377:241–248. doi: 10.1042/BJ20030935. [DOI] [PMC free article] [PubMed] [Google Scholar]
- 25.Fujii T., Endo T., Fujii J., Taniguchi N. Differential expression of glutathione reductase and cytosolic glutathione peroxidase, GPX1, in developing rat lungs and kidneys. Free Radical Res. 2002;36:1041–1049. doi: 10.1080/1071576021000006725. [DOI] [PubMed] [Google Scholar]
- 26.Kayanoki Y., Fujii J., Suzuki K., Kawata S., Matsuzawa Y., Taniguchi N. Suppression of antioxidative enzyme expression by transforming growth factor-β1 in rat hepatocytes. J. Biol. Chem. 1994;269:15488–15492. [PubMed] [Google Scholar]
- 27.Okado-Matsumoto A., Matsumoto A., Fujii J., Taniguchi N. Peroxiredoxin IV is a secretable protein with heparin-binding properties under reduced conditions. J. Biochem. 2000;127:493–501. doi: 10.1093/oxfordjournals.jbchem.a022632. [DOI] [PubMed] [Google Scholar]
- 28.Bosman G. J., Willekens F. L., Werre J. M. Erythrocyte aging: a more than superficial resemblance to apoptosis? Cell. Physiol. Biochem. 2005;16:1–8. doi: 10.1159/000087725. [DOI] [PubMed] [Google Scholar]
- 29.Kelly G. S. Clinical applications of N-acetylcysteine. Altern. Med. Rev. 1998;3:114–127. [PubMed] [Google Scholar]
- 30.Friedman J. S., Rebel V. I., Derby R., Bell K., Huang T. T., Kuypers F. A., Epstein C. J., Burakoff S. J. Absence of mitochondrial superoxide dismutase results in a murine hemolytic anemia responsive to therapy with a catalytic antioxidant. J. Exp. Med. 2001;193:925–934. doi: 10.1084/jem.193.8.925. [DOI] [PMC free article] [PubMed] [Google Scholar]
- 31.Neumann C. A., Krause D. S., Carman C. V., Das S., Dubey D. P., Abraham J. L., Bronson R. T., Fujiwara Y., Orkin S. H., Van Etten R. A. Essential role for the peroxiredoxin Prdx1 in erythrocyte antioxidant defence and tumour suppression. Nature. 2003;424:561–565. doi: 10.1038/nature01819. [DOI] [PubMed] [Google Scholar]
- 32.Lee T. H., Kim S. U., Yu S. L., Kim S. H., Park Do S., Moon H. B., Dho S. H., Kwon K. S., Kwon H. J., Han Y. H., et al. Peroxiredoxin II is essential for sustaining life span of erythrocytes in mice. Blood. 2003;101:5033–5038. doi: 10.1182/blood-2002-08-2548. [DOI] [PubMed] [Google Scholar]
- 33.Skrzydlewska E., Farbiszewski R. Glutathione consumption and inactivation of glutathione-related enzymes in liver, erythrocytes and serum of rats after methanol intoxication. Arch. Toxicol. 1997;71:741–745. doi: 10.1007/s002040050455. [DOI] [PubMed] [Google Scholar]
- 34.Asahi M., Fujii J., Takao T., Kuzuya T., Hori M., Shimonishi Y., Taniguchi N. The oxidation of selenocysteine is involved in the inactivation of glutathione peroxidase by nitric oxide donor. J. Biol. Chem. 1997;272:19152–19157. doi: 10.1074/jbc.272.31.19152. [DOI] [PubMed] [Google Scholar]
- 35.Fagan J. M., Waxman L. Purification of a protease in red blood cells that degrades oxidatively damaged haemoglobin. Biochem. J. 1991;277:779–786. doi: 10.1042/bj2770779. [DOI] [PMC free article] [PubMed] [Google Scholar]
- 36.Fujino T., Ando K., Beppu M., Kikugawa K. Enzymatic removal of oxidized protein aggregates from erythrocyte membranes. J. Biochem. 2000;127:1081–1086. doi: 10.1093/oxfordjournals.jbchem.a022701. [DOI] [PubMed] [Google Scholar]
- 37.Inagaki Y., Jinno-Yoshida Y., Hamasaki Y., Ueki H. A novel autoantibody reactive with carbonic anhydrase in sera from patients with systemic lupus erythematosus and Sjogren's syndrome. J. Dermatol. Sci. 1991;2:147–154. doi: 10.1016/0923-1811(91)90060-b. [DOI] [PubMed] [Google Scholar]
- 38.Nishimori I., Bratanova T., Toshkov I., Caffrey T., Mogaki M., Shibata Y., Hollingsworth M. A. Induction of experimental autoimmune sialoadenitis by immunization of PL/J mice with carbonic anhydrase II. J. Immunol. 1995;154:4865–4873. [PubMed] [Google Scholar]
- 39.Beppu M., Mizukami A., Nagoya M., Kikugawa K. Binding of anti-band 3 autoantibody to oxidatively damaged erythrocytes. Formation of senescent antigen on erythrocyte surface by an oxidative mechanism. J. Biol. Chem. 1990;265:3226–3233. [PubMed] [Google Scholar]
- 40.Shen C. R., Youssef A. R., Devine A., Bowie L., Hall A. M., Wraith D. C., Elson C. J., Barker R. N. Peptides containing a dominant T-cell epitope from red cell band 3 have in vivo immunomodulatory properties in NZB mice with autoimmune hemolytic anemia. Blood. 2003;102:3800–3806. doi: 10.1182/blood-2002-07-2125. [DOI] [PubMed] [Google Scholar]
- 41.Akagawa M., Ito S., Toyoda K., Ishii Y., Tatsuda E., Shibata T., Yamaguchi S., Kawai Y., Ishino K., Kishi Y., et al. Bispecific abs against modified protein and DNA with oxidized lipids. Proc. Natl. Acad. Sci. U.S.A. 2006;103:6160–6165. doi: 10.1073/pnas.0600865103. [DOI] [PMC free article] [PubMed] [Google Scholar]
- 42.Signorini C., Ferrali M., Ciccoli L., Sugherini L., Magnani A., Comporti M. Iron release, membrane protein oxidation and erythrocyte ageing. FEBS Lett. 1995;362:165–170. doi: 10.1016/0014-5793(95)00235-2. [DOI] [PubMed] [Google Scholar]
- 43.Whitacre C. C. Sex differences in autoimmune disease. Nat. Immunol. 2001;2:777–780. doi: 10.1038/ni0901-777. [DOI] [PubMed] [Google Scholar]
Associated Data
This section collects any data citations, data availability statements, or supplementary materials included in this article.


