

Abstract
In an effort to identify genes whose expression is regulated by activated phosphatidylinositol 3-kinase (PI3K) signaling, we performed microarray analysis and subsequent quantitative reverse transcription-PCR on an isogenic set of PTEN gene-targeted human cancer cells. Numerous p53 effectors were upregulated following PTEN deletion, including p21, GDF15, PIG3, NOXA, and PLK2. Stable depletion of p53 led to reversion of the gene expression program. Western blots revealed that p53 was stabilized in HCT116 PTEN−/− cells via an Akt1-dependent and p14ARF-independent mechanism. Stable depletion of PTEN in untransformed human fibroblasts and epithelial cells also led to upregulation of p53 and senescence-like growth arrest. Simultaneous depletion of p53 rescued this phenotype, enabling PTEN-depleted cells to continue proliferating. Next, we tested whether oncogenic PIK3CA, like inactivated PTEN, could activate p53. Retroviral expression of oncogenic human PIK3CA in MCF10A cells led to activation of p53 and upregulation of p53-regulated genes. Stable depletion of p53 reversed these PIK3CA-induced expression changes and synergized with oncogenic PIK3CA in inducing anchorage-independent growth. Finally, targeted deletion of an endogenous allele of oncogenic, but not wild-type, PIK3CA in a human cancer cell line led to a reduction in p53 levels and a decrease in the expression of p53-regulated genes. These studies demonstrate that activation of PI3K signaling by mutations in PTEN or PIK3CA can lead to activation of p53-mediated growth suppression in human cells, indicating that p53 can function as a brake on phosphatidylinositol (3,4,5)-triphosphate-induced mitogenesis during human cancer pathogenesis.
Inactivating mutations of the PTEN tumor suppressor gene are found in a wide range of common human cancers, including glioblastoma, endometrial carcinoma, melanoma, and adenocarcinoma of the prostate (28, 50). PTEN is a lipid phosphatase that converts the mitogenically active lipid phosphatidylinositol (3,4,5)-triphosphate (PIP3) to PIP2 (32). The importance of the lipid phosphatase activity of PTEN for tumorigenesis was recently highlighted by the discovery that activating mutations in PIK3CA, encoding the phosphatidylinositol 3-kinase alpha (PI3Kα) subunit, are also commonly present in human cancer (22, 45).
PIP3 mitogenic signaling is well known to proceed via activation of the PIP3-dependent serine threonine kinases Akt1 to -3, which phosphorylate downstream effectors, including TSC2, BAD, FKHR1, and FKHLR1 (6, 12, 33, 42, 53). The identities of these Akt substrates and their relevance to cancer pathogenesis are rapidly emerging. Importantly, a subset of these Akt substrates are transcription factors (most prominently, FKHR1 and FKHRL1), which converge on the nucleus to modulate the expression of PIP3 effector genes. The identity of the “PIP3 transcriptome” remains largely unknown, but it is an intensely active area of investigation.
The p53 tumor suppressor gene is perhaps the best-known and best-studied transcription factor whose function is critical to human cancer pathogenesis. The best-established function of p53 is as a transcriptional activator that induces the expression of genes that can induce apoptosis and/or senescence-like cell cycle arrest. In most untransformed cells, p53 is quiescent. However, p53 is induced during the process of cancer pathogenesis to provide its tumor-suppressing activity. Though the identity of the “natural inducer” of p53 during human tumorigenesis has been long debated, numerous stimuli have been identified that clearly lead to potent p53 induction in vitro. These include both extracellular insults—radiation, DNA-damaging chemotherapeutics, spindle poisons, antimetabolites, and oxygen deprivation—and intracellular stimuli—oncogene activation, cellular aging, and oxygen radical formation (1, 7, 10, 16, 17, 23, 52).
Oncogene activation in particular has been appealing as a potential inducer of p53, since it is considered likely that oncogene activation precedes p53 inactivation during the pathogenesis of most, if not all, human tumors. The expression of activated oncogenes induces the expression of p14ARF, which sequesters Hdm2 and inhibits its E3 ubiquitin ligase activity (13, 19, 30, 35, 51, 55). This leads to an increase in the half-life of p53 and its functional activation. However, despite the focus on oncogenes as potential inducers of p53, several important caveats have remained. First, most studies have been performed in murine, not human, cells (47). Second, most human studies have employed ectopic overexpression of oncogenes, leading to a general concern that oncogene-induced activation of p53 could be an artifact of overexpression. This concern has been compounded by the fact that it has not yet been demonstrated that deletion of an endogenous activated oncogene can reduce p53 levels and activity in any human cell line.
Recent studies have uncovered important intersections between the PI3K and p53 signaling pathways. Several studies have suggested that activation of PI3K signaling via mutations in PTEN could lead to inactivation of p53 via alteration of Hdm2 expression and/or nuclear localization or via direct binding of PTEN to p53 (9, 15, 34). These studies helped to explain the observation that mutations of PTEN and p53 are mutually exclusive in stromal cells during the early stages of human breast cancer pathogenesis (26). However, other studies have suggested that activation of PI3K signaling can lead to activation of p53. Most prominently, a recent study by Chen et al. demonstrated that tissue-specific inactivation of PTEN in the mouse prostate led to activation of p53 and subsequent cellular senescence (11). Consistent with this, prostate-specific deletion of both PTEN and p53 led to the formation of prostate adenocarcinoma.
We have recently pursued a loss-of-function genetic approach to identify the functions of PTEN in human cancer cells by using human somatic cell gene targeting. In our initial studies using PTEN gene-targeted human cancer cells, we demonstrated that PTEN controls a DNA damage-inducible cell size checkpoint in human cells (27). Here, we present further studies that employ PTEN gene-targeted human cancer cells to identify PTEN functions.
Microarray analysis revealed that a host of well-known p53-regulated genes were upregulated following PTEN deletion in human cells. Subsequent experiments employing a variety of complementary genetic approaches, including additional gene-targeted human cancer cell lines, stable short hairpin RNA (shRNA), and ectopic transgene overexpression confirmed this observation, extended it to oncogenic PIK3CA, and demonstrated that it was partially dependent on Akt1 and likely independent of p14ARF. Therefore, we demonstrate here that PTEN inactivation leads to activation of p53 responses in untransformed and transformed human cells, provide several insights into the mechanism of p53 activation by PI3K signaling, and demonstrate that like PTEN loss, oncogenic activation of PIK3CA can also lead to induction of p53 responses.
MATERIALS AND METHODS
Cell lines.
HCT116 PTEN+/+ and PTEN−/− cells were created using human somatic cell gene targeting and were described in a previous study (27). BJ-hTERT and RPE-hTERT cells were obtained from Clontech (Mountain View, CA). Normal human astrocytes (NHA) were obtained from AllCells LLC (Emeryville, CA) and cultured as recommended. HEK293, MCF10A, and A172 were obtained from the ATCC (Manassas, VA) and cultured as recommended. HEK293T cells were obtained from Richard Pestell (Thomas Jefferson University).
Microarray analysis.
Global gene expression profiles were measured using Affymetrix U133A and U133B microarrays (with 22,283 and 22,645 probe sets, respectively) in two PTEN+/+ cell lines (HCT116 parental cells and HCT116 Neor, with random integration of the PTEN targeting vector) and three independently derived PTEN−/− cell lines. To do this, total RNA was prepared using standard TRIZOL-based techniques. Fragmented cRNA was prepared using the method described in the Affymetrix Genechip Expression Analysis technical manual. Hybridization, washing, and imaging steps were performed in the Lombardi Comprehensive Cancer Center Macromolecular Shared Resource. Raw images were preprocessed using Microarray Suite 5.0 software (Affymetrix, Santa Clara, CA). Data analysis was performed with the BRB Array software package, a publicly available suite of analysis tools created by the NCI Biometric Research Branch. A class comparison to identify differentially expressed genes was performed using univariate analysis. In brief, the randomized-variance t test, a variant of the standard t test, was used to compare the two classes (PTEN+/+ and PTEN−/− cells). A multivariate permutation test was employed to control the number and proportion of false positives. For more detailed statistical information, see http://linus.nci.nih.gov/BRB-ArrayTools.html.
qRT-PCR.
Total RNA was prepared by standard TRIZOL-based methods. Quantitative reverse transcription-PCR (qRT-PCR) was performed in an iCycler (Bio-Rad, Hercules, CA) using TaqMan gene expression assays (Applied Biosystems, Foster City, CA) and the Superscript III Platinum One Step qRT-PCR System (Invitrogen, Carlsbad, CA), according to the manufacturers' specifications. Relative gene expression levels were calculated using the 2−Δ(ΔCT) method, normalizing to the expression of the β2-microglobulin housekeeping gene. All assays were performed at least in triplicate.
Immunoblotting and immunoprecipitation.
For immunoprecipitation, 200 μg of whole-cell lysate was incubated with mouse α-FLAG preconjugated M2 agarose beads (SIGMA, St. Louis, MO) at 4°C for 24 h. The beads were washed three times with lysis buffer, boiled in 2× gel loading buffer, and analyzed by immunoblotting. For immunoblotting, protein lysates were separated by sodium dodecyl sulfate-polyacrylamide gel electrophoresis, transferred to polyvinylidene difluoride membranes, probed with primary and horseradish peroxidase-coupled secondary antibodies, and visualized by enhanced chemiluminescence (Pierce, Rockford, IL). Bands were quantified using Scion Image densitometry software (Scion Corporation, Frederick, MD). Primary antibodies were obtained from Abcam (Cambridge, MA; p14ARF), Cascade Bioscience (Winchester, MA; PTEN clone 6H2.1), Calbiochem (San Diego, CA; p53 clone DO-1), Cell Signaling (Danvers, MA; p-Akt S473 clone 193H12; pan-Akt; Akt1 clone 2H10; p14ARF clone 4C6/4), Upstate (Temecula, CA; γ-H2AX clone JBW301), Santa Cruz Biotechnology (Santa Cruz, CA; p14ARF clone C-18; Hdm2 clone SMP14), Zymed (South San Francisco, CA; p21 clone EA10), Neomarkers (Freemont, CA; tubulin α clone DM1A), and SIGMA (St. Louis, MO; FLAG polyclonal antibody).
Lentiviral shRNA.
Constructs for stable depletion of PTEN, p53, and Akt1 were obtained from The RNAi Consortium (37) via SIGMA and Open Biosystems (Huntsville, AL). For each gene, four or five premade constructs were obtained and tested to identify those able to achieve efficient knockdown at the protein level. Negative control constructs in the same vector system (vector alone and scrambled shRNA) were created by Robert Weinberg (Massachusetts Institute of Technology) and David Sabatini (Massachusetts Institute of Technology) and obtained from Addgene (Cambridge, MA). The lentiviral helper plasmids pHR′8.2ΔR and pCMV-VSV-G were also obtained from Robert Weinberg via Addgene. All plasmids were prepped, and their integrity was confirmed by restriction analysis. The integrity of all shRNA inserts was confirmed by sequencing.
To prepare transient virus stocks, 1.5 × 10⁶ 293T cells were plated in 10-cm dishes. The next day, the cells were cotransfected with shRNA constructs (3 μg), together with pHR′8.2ΔR and pCMV-VSV-G helper constructs (3 μg and 0.3 μg, respectively), using FuGENE 6 (Roche, Indianapolis, IN). The media were changed the next day, and the following day, virus-containing media were harvested. The viral stocks were centrifuged and filtered to remove any nonadherent 293T cells.
Next, HCT116, BJ-hTERT, RPE-hTERT, or MCF10A cells were infected with shRNA lentiviruses. To do this, the cells were plated at subconfluent densities. The next day, the cells were infected with a cocktail of 1 ml virus-containing medium, 3 ml regular medium, and 8 μg/ml Polybrene. The medium was changed 1 day postinfection, and selective medium was added 2 days postinfection (2 μg/ml puromycin for HCT116, BJ-hTERT, and MCF10A; 10 μg/ml for RPE-hTERT). After 3 days of puromycin selection, the mock-infected cells had all died. Stably infected pooled clones were studied.
Creation of wild-type and mutant human PIK3CA retroviruses.
A wild-type human PIK3CA cDNA was obtained from the Harvard Institute of Proteomics. This cDNA was PCR amplified with high-fidelity VENT Polymerase (New England Biolabs, Ipswich, MA) with an amino-terminal FLAG tag and cloned into pDNR-CMV (Clontech, Mountain View, CA). Of note, Peter Vogt's laboratory has demonstrated that amino-terminally epitope-tagged chicken PI3K p110α retains its biological and biochemical properties (21). The insert was sequenced in its entirety. Next, site-directed mutagenesis was employed to create two mutant derivatives—early stop (W11STOP) and a common oncogenic mutation in the catalytic domain (H1047R). These inserts were then shuttled into the pLP-LNCX retroviral expression vector (Clontech) using an in vitro Cre/Lox recombination. The integrity of these clones was confirmed by restriction analysis and sequencing of critical junctions.
Next, amphotropic retroviruses were created and used to infect MCF10A cells. To do this, 293T cells were cotransfected using FuGENE 6 with the retroviral expression vectors described above, together with the appropriate human helper plasmid (38). The medium was changed 1 day postinfection, and retrovirus-containing medium was harvested on day 3 postinfection. MCF10A cells were infected with retrovirus in the presence of 8 μg/ml Polybrene. G418-resistant clones were selected for 2 weeks in the presence of 1.0 mg/ml G418, pooled, and studied.
Flow cytometry.
Cells were fixed in 70% ethanol and stained in phosphate-buffered saline containing 0.1% Triton X-100, 50 μg/ml RNase, and 50 μg/ml propidium iodide. The DNA content was measured on a FACSort flow cytometer (Becton Dickinson, Franklin Lakes, NJ), and data were analyzed using ModFit software (Verity Software House, Topsham, ME). At least 20,000 cells were analyzed per sample.
Measurement of cell size.
Cells were trypsinized in 0.5 ml, added to 0.5 ml of serum-containing medium, and further diluted in 10 ml of Isoton II. Cell diameters were determined using a Multisizer 3 Coulter Counter (Beckman Coulter, Fullerton, CA). At least 10,000 cells were counted per measurement.
PIK3CA human somatic cell gene targeting.
The PIK3CA targeting vector was constructed in an adeno-associated virus (AAV) backbone for delivery via infection and was designed to delete exon 2. Exon 2 was chosen because its flanking exons (which compose the homology arms) contain few repeat elements and because any rare exon 2-skipping events would drive the message out of frame. To create this vector, homology arms were PCR amplified from a human genomic DNA template using VENT high-fidelity polymerase (New England Biolabs) and sequentially cloned into the AAV-MCS vector (Stratagene, La Jolla, CA). The cloned homology arms were sequenced to eliminate those with PCR-generated mutations. Next, a PCR-generated pTK-Neor gene was cloned between the homology arms. After the junctions were sequenced, the completed targeting vector was prepped. Transient viral stocks were created by cotransfection of targeting vector into 293-AAV cells, together with pAAV-RC and pHELPER, two plasmids that provide proteins needed for viral replication and packaging (both from Stratagene). The virus was harvested and used to infect HCT116 cells.
Soft-agar growth assay.
Five thousand cells were plated in 0.3% agar layered on top of 0.6% agar in 35-mm2 plates. After 2 weeks, the colonies were stained with 0.005% crystal violet and counted in an Omnicon 3600 automated colony counter (BioLogics, Inc., Manassas, VA).
Microarray data accession numbers.
The complete microarray data sets have been submitted to the NCBI Gene Expression Omnibus database under accession number GSE6263.
RESULTS
Upregulation of p53-regulated genes in PTEN−/− cells.
In an effort to identify genes whose expression is modulated by the presence or absence of PTEN, microarray analysis was performed. To do this, we measured the gene expression profiles in a previously described isogenic set of HCT116 cells in which the endogenous wild-type PTEN genes had been deleted by gene targeting (27). In an effort to eliminate false positives, we studied two HCT116 PTEN+/+ cell lines (parental cells and a clone with random integration of the targeting vector) and three independently derived HCT116 PTEN−/− cell lines using the Affymetrix U133A/B chip set, as described in Materials and Methods. Data analysis was performed using the BRB Array software package.
Depicted in Tables 1 and 2 are lists of the differentially expressed genes on the U133A microarray that met the stringent P < 0.001 statistical-significance cutoff. The fact that three of the probe sets in Table 2 correspond to PTEN (representing all three PTEN probe sets on the U133A chip) provides a valuable internal control, confirming the quality of the data and analysis.
TABLE 1.
Genes increased in PTEN−/− cells (P < 0.001)
| Gene | Function | Signal intensity in:
|
Fold change | |
|---|---|---|---|---|
| PTEN+/+ | PTEN−/− | |||
| IFI44 | Interferon-induced protein 44 | 31 | 209 | 6.8 |
| PLD1 | Phospholipase D1 | 60 | 276 | 4.6 |
| CPA4 | Carboxypeptidase A4 | 979 | 3,653 | 3.7 |
| PLAU | Plasminogen activator | 2,468 | 7,579 | 3.1 |
| EDG2 | G-protein-coupled receptor 2 | 948 | 2,763 | 2.9 |
| EDG2 | G-protein-coupled receptor 2 | 1,578 | 4,305 | 2.7 |
| EDG2 | G-protein-coupled receptor 2 | 575 | 1,552 | 2.7 |
| SLC7A11 | Solute carrier family 7 | 333 | 914 | 2.8 |
| CDKN1A | p21WAF1/CIP1 | 9,541 | 25,777 | 2.7 |
| GALNT10 | Transferase | 282 | 760 | 2.7 |
| RCHY1 | Ring and zinc finger domain | 136 | 363 | 2.7 |
| PLP1 | Proteolipid protein 1 | 60 | 153 | 2.6 |
| SKD3 | Potassium transport | 628 | 1,538 | 2.4 |
| APBB2 | Amyloid beta binding protein | 393 | 946 | 2.4 |
| SCAP2 | SH3/SH2 adaptor protein | 385 | 859 | 2.2 |
| E2IG5 | Growth and transformation | 444 | 931 | 2.1 |
| GDF15 | TGF-β ligand | 14,602 | 28,633 | 2.0 |
| C12orf5 | Chromosome 12 open reading frame 5 | 2,413 | 4,743 | 2.0 |
| GPM6A | Glycoprotein M6A | 308 | 608 | 2.0 |
| APG-1 | Heat shock protein | 2,232 | 4,267 | 1.9 |
TABLE 2.
Genes decreased in PTEN−/− cells (P < 0.001)
| Gene | Function | Signal intensity in:
|
Fold change | |
|---|---|---|---|---|
| PTEN+/+ | PTEN−/− | |||
| RIT2 | Ras-like small GTPase | 185 | 30 | 6.2 |
| RBM4 | RNA binding motif protein 4 | 311 | 61 | 5.1 |
| PTEN | Tumor suppressor | 635 | 226 | 2.8 |
| PTEN | Tumor suppressor | 1,407 | 596 | 2.4 |
| PTEN | Tumor suppressor | 2,759 | 1,370 | 2.0 |
| MGA | Transcription factor | 678 | 245 | 2.8 |
| ZFP574 | Zinc finger protein 574 | 685 | 287 | 2.4 |
| 4873024 | Similar to tubulin beta 2 | 937 | 425 | 2.2 |
Two of the genes most highly upregulated in the PTEN−/− cells were p21WAF1/CIP1 and GDF15/MIC-1, two well known p53-regulated genes (14, 29). To further examine the hypothesis that p53-regulated genes in general were upregulated in PTEN−/− cells, we examined a more comprehensive list of differentially expressed genes (which met a slightly less stringent P value cutoff of <0.005) to identify additional p53-regulated genes that were upregulated in PTEN−/− cells.
A number of additional p53-regulated genes were identified (listed in Fig. 1A), including NOXA (increased 2.4-fold; a BH3 motif-containing member of the BCL2 family) (39), PIG3 (increased 2.1-fold; a proapoptotic protein with homology to redox-controlling proteins) (41), and PLK2 (increased 2.1-fold; confers resistance to spindle damage) (8). These expression differences were confirmed by qRT-PCR (Fig. 1A). The results raised the intriguing possibility that deletion of PTEN led to activation of p53. Of note, it is not surprising that microarray analysis did not detect an increase in p53 itself in PTEN−/− cells, since p53 is thought to be regulated primarily at the posttranscriptional level.
FIG. 1.

Functional activation of p53 responses in PTEN−/− cells. (A) p53-regulated genes whose expression is upregulated in PTEN−/− cells, as determined by both microarray analysis and qRT-PCR. (B) Formal demonstration of p53 dependence. HCT116 PTEN+/+ and PTEN−/− cells were infected with control (pLKO.1) and p53 shRNA lentiviruses, and the expression levels of the listed p53-regulated genes were measured by qRT-PCR. The y axis represents the difference (n-fold) in gene expression between HCT116 PTEN−/− and PTEN+/+ cells. The extent of p53 depletion as measured by Western blotting is depicted in the inset. As indicated, p53 depletion led to a reduction in the expression of each of the five genes preferentially in HCT116 PTEN−/− cells. The error bars indicate standard deviations.
Though these experiments strongly suggested that p21, GDF15, NOXA, PIG3, and PLK2 were upregulated in PTEN−/− cells through a p53-dependent mechanism, they did not prove it. To formally demonstrate this, we infected HCT116 PTEN+/+ and PTEN−/− cells with p53 shRNA or control lentiviruses and established stable pooled clones. There was an 80% decrease in p53 mRNA in cells infected with p53 shRNA lentivirus, as measured by qRT-PCR; the corresponding reduction in p53 protein is depicted in the inset in Fig. 1B. Next, we employed qRT-PCR to measure the expression of the five signature p53-regulated genes. As depicted in Fig. 1B, p53 depletion led to a statistically significant preferential reduction in expression of each of the five genes in HCT116 PTEN−/− cells. Of note, p53 depletion virtually equalized expression of the p21 gene (considered to be a particularly robust and important p53-regulated gene) in HCT116 PTEN+/+ and PTEN−/− cells. We hypothesize that the variations in the extents of reduction of the other genes are due to complexities in their transcriptional regulation and/or variations in their sensitivities to the remaining p53 protein present in the p53 knockdown cells. When taken together, our experiments provide strong support for the contention that PTEN deletion leads to the activation of a p53-dependent gene expression program in human cells.
Upregulation of p53 levels and activity in proliferating PTEN−/− cells.
To more directly test the hypothesis that p53 was activated in PTEN−/− cells, we measured the levels of p53, p21, pAkt (S473), pan-Akt, and α-tubulin in proliferating HCT116 PTEN+/+, PTEN+/−, and PTEN−/− cell lines. To rule out the possibility of clone-specific artifacts, we studied two independently derived clones of each genotype. As shown in Fig. 2A, deletion of PTEN led to upregulation of p53 and p21 protein levels.
FIG. 2.

Increased expression of p53 and p21 proteins in PTEN−/− cells. (A) p53 and p21 levels in proliferating HCT116 PTEN+/+, PTEN+/−, and PTEN−/− cells. Immunoblotting was performed with the antibodies indicated. (B) p53 levels in the same cell lines after DNA damage. HCT116 cells with the PTEN genotypes indicated were treated with 5 μg/ml etoposide for 24 h. Immunoblotting was performed with the antibodies indicated.
We considered two possible models to begin to explain the upregulation of p53 levels and activity in PTEN−/− cells. First, it was possible that deletion of PTEN simply led to upregulation of the basal level and activity of p53. Second, it was equally possible that deletion of PTEN changed the p53 “set point,” resulting in an enhancement not only of its baseline level, but also in the extent to which it could be induced by DNA damage. To distinguish between these two models, we next measured p53 levels in etoposide-treated HCT116 PTEN+/+, PTEN+/−, and PTEN−/− cells. As shown in Fig. 2B, the levels of p53 after induction with etoposide were identical in HCT116 PTEN+/+, PTEN+/−, and PTEN−/− cells. When taken together with the data depicted in Fig. 2A, this experiment demonstrated that PTEN deletion led to an elevation in the basal levels of p53 during normal growth but did not similarly increase the extent to which p53 could be induced by DNA damage.
Downregulation of p53 in PTEN−/− cells after treatment with LY294002.
To formally implicate the lipid phosphatase activity of PTEN in its ability to regulate p53, we measured levels of p53 in HCT116 PTEN−/− cells after treatment with the PI3K inhibitor LY294002. As expected, treatment of HCT116 PTEN−/− cells with LY294002 rescued the effect of PTEN deletion, substantially reducing p53 protein levels (Fig. 3A). This experiment directly implicated the lipid phosphatase activity of PTEN in its ability to regulate p53.
FIG. 3.

Reduction in p53 levels by LY294002 in PTEN−/− cells. (A) HCT116 PTEN−/− cells were treated with 0, 30, 60, or 90 μM LY294002 for 24 h. Protein lysates were prepared, and immunoblots were performed with the primary antibodies indicated. (B) A172 cells and (C) NHA were treated with 0, 2, 10, 30, or 60 μM LY294002 for 24 h. Protein lysates were prepared, and immunoblots were performed with the primary antibodies indicated.
To confirm and extend these results, we measured the effects of PI3K inhibition on p53 levels in two related cell lines, A172, a human glioma cell line with naturally occurring biallelic mutational inactivation of PTEN, and NHA, which represent the PTEN-proficient precursor cell type for glioma. As shown in Fig. 3B and C, pharmacological inhibition of PI3K led to a reduction in p53 levels in PTEN-deficient A172 cells, but not in their precursor PTEN-proficient NHA. These results confirmed the initial results obtained in HCT116 cells and extended them to a genetically unmodified human cell system that differs in the presence and absence of mutant PTEN genes.
Enhanced p53 protein stability in PTEN−/− cells.
p53 levels are thought to be regulated primarily at the posttranscriptional level, generally at the level of protein stability. Thus, we tested if the half-life of p53 was prolonged in PTEN−/− cells. To do this, we measured the levels of p53 protein in isogenic sets of proliferating HCT116 PTEN+/+ and PTEN−/− cells at various time points after treatment with cycloheximide to block additional protein synthesis. As shown in Fig. 4A and B, there was an approximately fourfold increase in the half-life of p53 following PTEN deletion.
FIG. 4.

Enhanced p53 stability in PTEN−/− cells. (A) HCT116 PTEN+/+ and PTEN−/− cells were treated with 100 μg/ml cycloheximide (CHX) for the times indicated. Protein lysates were prepared, and immunoblots were performed with the antibodies indicated. (B) Bands were quantified using Scion Image densitometry software (Scion Corporation, Frederick, MD), and half-lives were determined using linear-regression analysis. (C) Protein lysates were prepared from HeLa, HCT116 PTEN+/+, and PTEN−/− cells, and immunoblots were performed with three different p14ARF primary antibodies. (D) Protein lysates from two different HCT116 PTEN+/+ and HCT116 PTEN−/− cell lines were studied by immunoblotting with an Hdm2 antibody.
p53 stability is regulated by Hdm2, a ubiquitin ligase that interacts with and ubiquitinates p53, targeting it for degradation. Mitogenic stimuli that activate p53 increase the expression of the Hdm2-binding partner p14ARF, which sequesters Hdm2 and consequently increases the half-life of p53. To determine if the p53 activation in PTEN−/− cells was dependent on p14ARF, we measured levels of p14ARF protein by Western blotting in HCT116 PTEN+/+ and PTEN−/− cells (Fig. 4C). Using three different commercially available p14ARF antibodies and an effective positive control, it was clear that neither HCT116 PTEN+/+ nor HCT116 PTEN−/− cells express detectable levels of p14ARF protein, regardless of the length of the exposure. These results are consistent with a published report stating that HCT116 cells do not express p14ARF protein as measured with a single different commercially available p14ARF antibody (54). Next, we tested whether the expression of Hdm2 itself might be downregulated in HCT116 PTEN−/− cells. As depicted in Fig. 4D, there was no reduction in Hdm2 levels in HCT116 PTEN+/+ and PTEN−/− cells (in fact, there was a slight increase, consistent with the fact that Hdm2 expression is known to be activated by p53). When taken together, our data suggest that the mechanism of p53 activation in PTEN−/− cells is independent of p14ARF and is not caused by a reduction in the levels of Hdm2 protein.
Akt1 dependence on p53 upregulation in PTEN−/− cells.
The mitogenic activity of activated PI3K signaling requires activation of Akt. We wondered if the ability of activated PI3K signaling to activate p53 similarly required activation of Akt. We focused our studies on Akt1, as this is the Akt isoform most highly expressed in HCT116 cells (44). To test this, we infected HCT116 PTEN−/− cells with control or Akt1 shRNA lentiviruses, established pooled clones, and measured levels of Akt1, p53, and α-tubulin proteins by Western blotting and levels of p21 and GDF15 mRNAs by qRT-PCR. Depletion of Akt1 led to an approximately 50% reduction in p53 protein levels (Fig. 5A) and a corresponding reduction in the mRNA levels of two p53-regulated genes, p21 and GDF15 (Fig. 5B). Next, we transiently transfected HCT116 PTEN+/+ cells with a myr-Akt expression vector and measured levels of p53 by Western blotting. There was no increase in p53 levels (not shown). When taken together, our data indicate that Akt activation is necessary but not sufficient for PIP3-induced p53 activation in HCT116 cells.
FIG. 5.

Effects of Akt1 depletion on p53 activation in PTEN−/− cells. (A) HCT116 PTEN−/− cells were infected with the lentiviruses indicated, and pooled clones were established and studied by immunoblotting them to document levels of Akt1, p53, and α-tubulin proteins. (B) HCT116 PTEN+/+ and HCT116 PTEN−/− cells were infected with control and Akt1 shRNA lentiviruses, pooled clones were established, and total RNA was prepared and studied by qRT-PCR to document the relative expression levels of p21 and GDF15. The y axis represents the difference in gene expression (n-fold) between HCT116 PTEN−/− and PTEN+/+ cells. As indicated, Akt1 depletion led to a reduction in p21 and GDF15 preferentially in PTEN−/− cells. The error bars represent standard deviations.
Upregulation of p53 levels by PTEN depletion in untransformed human cells.
To confirm and extend the results obtained in HCT116 cells, we measured the effects of stable shRNA-mediated depletion of PTEN on p53 levels in telomerase-immortalized retinal pigment epithelial cells (RPE-hTERT) and telomerase-immortalized BJ fibroblasts (BJ-hTERT). As shown in Fig. 6A, depletion of PTEN led to a twofold increase in p53 levels in each of these cell lines. There was no increase in levels of p16INK4a (Fig. 6B).
FIG. 6.

Effects of PTEN depletion in untransformed human cells. BJ-hTERT fibroblasts and RPE-hTERT epithelial cells were infected with the lentiviruses indicated, and pooled clones were prepared as described in Materials and Methods. (A and B) Protein lysates were prepared, and immunoblots were performed with the primary antibodies indicated. p16INK4a levels were undetectable in BJ-hTERT cells. (C) (a and b) pLKO.1- and PTEN-shRNA-infected RPE-hTERT cells were imaged via phase-contrast light microscopy. The scale bars represent 200 μm. (c and d) pLKO.1- and PTEN-shRNA-infected RPE-hTERT cells were double stained for γ-H2AX (green) and DAPI (blue) and imaged by fluorescence microscopy. The scale bar represents 10 μm. (D) RPE-hTERT and BJ-hTERT cells were infected with control or PTEN shRNA lentiviruses, flow cytometry was performed as described in Materials and Methods, and the S-phase fraction was quantified using ModFit software (Verity Software House, Topsham, ME). (E) The sizes of the cells described in panel C were measured using a Multisizer 3 Coulter Counter (Beckman Coulter, Fullerton, CA).
PTEN depletion causes p53-dependent senescence-like growth arrest in untransformed human cells.
Depletion of PTEN in untransformed human cells not only led to p53 activation but also led to a dramatic morphological change. PTEN-depleted RPE-hTERT cells became flattened and enlarged, as though they had undergone senescence (Fig. 6C). Immunofluorescence revealed the accumulation of γ-H2AX foci, an important marker of senescence (Fig. 6C) (46). Attempts to passage the RPE-hTERT cells revealed that they remained healthy but had stopped dividing. Flow cytometry confirmed that the cells had arrested, with a virtual absence of S phase (Fig. 6D). Additionally, PTEN depletion led to cellular enlargement, a classic feature of senescence (Fig. 6E). Similar cell cycle and cell size results were also obtained in PTEN-depleted BJ-hTERT cells (Fig. 6D and E), though these cells were able to maintain a viable senescence-like growth arrest for only 1 week. Of note, attempts to demonstrate elevated levels of senescence-associated β-galactosidase activity in these apparently senescent cells were unsuccessful, perhaps due to the high levels of basal β-galactosidase activity (data not shown). Taken together, these results indicate that depletion of PTEN in untransformed human cells can lead to p53 induction and a senescence-like cell cycle arrest.
Next, we tested whether p53 activation was required for the senescence-like growth arrest caused by PTEN depletion. In particular, we determined whether codepletion of PTEN and p53 could rescue the deleterious effects of PTEN depletion and enable the cells to continue proliferation. To do this, we coinfected RPE-hTERT cells with various combinations of lentiviruses encoding PTEN shRNAs, p53 shRNAs, and several different negative control shRNAs. After selection in puromycin, pooled clones were studied by Western blotting to confirm PTEN and/or p53 knockdown (Fig. 7A) and then studied in several different phenotypic assays to assess the effects on cellular proliferation and cell cycle control. As previously demonstrated, stable depletion of PTEN led to permanent growth arrest characterized by a complete absence of S-phase cells (Fig. 7B and C). However, coinfection with p53 shRNAs, but not control shRNAs, rescued this effect, enabling the cells to enter S phase, continue proliferation, and maintain their normal size, despite the absence of PTEN (Fig. 7B to D). These results were obtained with multiple independent PTEN and p53 shRNA constructs, and similar cell cycle and cell size results were obtained in BJ-hTERT fibroblasts (not shown). These data demonstrate that p53 is necessary for the senescence-like growth arrest seen in untransformed human cells and caused by PTEN inactivation.
FIG. 7.

p53 is required for the cell cycle arrest caused by PTEN depletion. RPE-hTERT cells were infected in combination with lentiviruses encoding PTEN shRNAs, p53 shRNAs, or control shRNAs as indicated. (A) Protein lysates were prepared, and immunoblotting was performed using the primary antibodies indicated. (B) S phase was quantified using ModFit software (Verity Software House, Topsham, ME) after flow cytometry analysis, as described in Materials and Methods. (C) Cells were harvested and counted every 1 or 2 days to document proliferation. (D) Cell size was measured using a Multisizer 3 Coulter Counter (Beckman Coulter, Fullerton, CA).
Activation of p53 by ectopic expression of oncogenic PIK3CA in human cells.
Direct mutational activation of PI3K signaling can occur by either inactivation of PTEN or oncogenic activation of PIK3CA. Therefore, we tested whether activation of PIK3CA, like inactivation of PTEN, could lead to activation of p53 in MCF10A premalignant breast epithelial cells. MCF10A cells were a particularly relevant model system for these experiments, since oncogenic mutations of PIK3CA are found in a substantial fraction of human breast cancers (2, 43).
To do this, we created retroviral expression vectors expressing various wild-type and mutant forms of human PIK3CA, as described in Materials and Methods. Next, we created amphotropic human PIK3CA retroviruses, infected MCF10A cells, established pooled G418-resistant clones, and measured levels of p53 by Western blotting. As shown in Fig. 8A, there was a 1.7-fold increase in p53 levels in MCF10A cells expressing oncogenic human PIK3CA. Next, we created total RNA from the various pooled clones and employed qRT-PCR to measure the levels of two p53-regulated genes, p21 and GDF15. As shown in Fig. 8B, there was a substantial increase in the expression of both genes in cells expressing oncogenic, but not wild-type, PIK3CA. Importantly, this increase was reversed by coexpression of a p53 shRNA, formally demonstrating its p53 dependence. Taken together, these studies demonstrate that ectopic expression of oncogenic PIK3CA can induce p53 levels and activity in human breast epithelial cells.
FIG. 8.

Activation of p53 by oncogenic PIK3CA. (A) MCF10A cells stably expressing early-stop (W11STOP), wild-type (WT), and oncogenic FLAG-PIK3CA (H1047R) were harvested. Immunoprecipitation and immunoblotting were performed as described in Materials and Methods with the antibodies indicated. (B) Total RNA was prepared from the indicated pooled clones, and qRT-PCR was employed to measure levels of p21 and GDF15. The error bars represent standard deviations.
Modulation of p53 levels and activity by endogenous oncogenic PIK3CA in human cancer cells.
We were intrigued by our results demonstrating that ectopic overexpression of oncogenic PIK3CA could lead to p53 activation but were concerned that it could be an artifact of overexpression. To rule out this possibility, we pursued an approach based on PIK3CA human somatic cell gene targeting to measure the effects of the endogenous, naturally occurring allele of oncogenic PIK3CA present in HCT116 cells on p53 levels and activity (44).
First, we employed human somatic cell gene targeting to create clonal derivatives of HCT116 cells in which either the wild-type or the oncogenic allele of PIK3CA had been deleted. To do this, we created a human AAV-PIK3CA targeting vector designed to delete exon 2, as described in Materials and Methods and depicted in Fig. 9A. Of note, it has recently been demonstrated that delivering targeting vectors to human cells via infection with recombinant AAVs can increase the efficiency of targeted integration, obviating the need for a promoterless architecture (18, 25).
FIG. 9.

PIK3CA gene targeting. (A) Homologous recombination between the genomic locus and the AAV targeting vector deletes exon 2 and replaces it with a thymidine kinase (TK) Neor gene. The PCR primers used for identification of knockouts are indicated, as are the restriction enzyme cleavage sites and the probe used for Southern blotting-based confirmation of knockouts (KO). (B) Confirmation of PIK3CA targeting by Southern blot analysis. Fragments corresponding to the untargeted allele and the targeted allele are shown. (C) Sequence-based identification of the untargeted allele. PCR products from the untargeted allele were sequenced to determine which allele had been deleted in PIK3CA gene-targeted cells. Asterisks indicate the locations of the PIK3CA mutation A3140G (H1047R), and N denotes heterozygosity. (D) Morphological features of PIK3CA gene-targeted cells: (a) HCT116 parental cells and derivatives with (b) oncogenic PIK3CA deleted and (c) wild-type PIK3CA deleted. The scale bar represents 200 μm.
Using this gene-targeting virus, we obtained derivatives of HCT116 cells in which either the oncogenic allele or the wild-type allele had been deleted (Fig. 9B and C). HCT116 parental cells and derivatives with deletion of wild-type PIK3CA had similar morphologies, with mesenchymal features and a scattered, apparently contact-independent growth pattern (Fig. 9D). In contrast, deletion of the oncogenic allele of PIK3CA led to a dramatic morphology change—the cells assumed a more epithelium-like morphology and grew in well-organized, apparently contact-dependent colonies. A similar morphology change has been reported by ourselves and others to occur after targeted deletion of oncogenic K-Ras from several human cancer cell lines (5, 24, 48).
Next, we measured the levels of p53 and p21 in proliferating HCT116 cells and PIK3CA gene-targeted derivatives. As depicted in Fig. 10A, deletion of the oncogenic, but not the wild-type, allele of PIK3CA led to an approximately twofold decrease in p53 and p21 protein levels, as well as the expected reduction in levels of p-Akt (44). Next, we created total RNA from the various gene-targeted cell lines and measured levels of the p53-regulated genes p21 and GDF15 by qRT-PCR (Fig. 10B). Deletion of oncogenic, but not wild-type, PIK3CA led to substantial reduction in the expression levels of both genes. Taken together, these studies clearly demonstrate that endogenous oncogenic PIK3CA can regulate p53 levels and activity in a human cancer cell line.
FIG. 10.

Effects of PIK3CA deletion on p53 levels and activity. (A) Protein lysates from HCT116 parental cells and PIK3CA gene-targeted cells were prepared, and immunoblotting was performed using the primary antibodies indicated. (B) Total RNA was prepared from HCT116 parental cells and PIK3CA gene-targeted derivatives, and qRT-PCR was employed to measure the levels of p21 and GDF15. The error bars represent standard deviations.
Activation of p53 by oncogenic PIK3CA can have functional consequences.
Finally, we tested whether activation of p53 signaling by oncogenic PIK3CA had functional consequences. To do this, we returned to our MCF10A model system and infected MCF10A parental cells with various combinations of PIK3CA retroviruses, p53 shRNA lentiviruses, and/or appropriate control viruses. After double selection in G418 and puromycin, pooled clones were established and studied. The extent of p53 depletion after infection with the p53 shRNA lentivirus was similar to that shown for RPE-hTERT cells in Fig. 7A. Expression of oncogenic PIK3CA in MCF10A cells conferred the ability to form colonies in soft agar (Fig. 11A and B) (20). Depletion of p53 led to a twofold increase in colony number and an appreciable increase in colony size (Fig. 11A and B). Of note, p53 depletion alone was unable to confer anchorage-independent growth. Taken together, these results demonstrate that mutational activation of PIK3CA can synergize with p53 inactivation in the transformation of human cells.
FIG. 11.

Activation of p53 by oncogenic PIK3CA. MCF10A cells stably expressing early-stop (W11STOP), wild-type (WT), and oncogenic (H1047R) PIK3CA and p53 shRNAs or control shRNAs as indicated were plated in soft agar and grown for 2 weeks, and the colonies were stained with 0.005% crystal violet. The colonies were photographed (A) and counted (B) as described in Materials and Methods. The scale bar represents 1.0 mm.
DISCUSSION
Here, we have demonstrated that activation of the PI3K signaling pathway via mutations in PTEN or PIK3CA can lead to functional activation of p53 signaling in human cells. We further demonstrated that PI3K-induced p53 activation can manifest itself as senescence-like growth arrest in untransformed human cells. Our results are consistent with the recent report by Chen et al. demonstrating that PTEN inactivation can lead to p53-induced senescence in mouse prostate tumorigenesis (11) and suggest that p53 mutations may be selected for during human cancer pathogenesis as a way to alleviate senescence caused by mutational activation of PI3K signaling.
This conclusion is also consistent with at least three other pieces of data generated in several other laboratories. Mitsuuchi et al. demonstrated that inhibition of PI3K can lead to diminution of p21 expression (36). Barbieri et al. demonstrated that pharmacological inhibition of PI3K signaling can lead to a reduction in the levels and activity of the p53 homologue p63 (4). Finally, Bar et al. demonstrated that pharmacological inhibition of PI3K can lead to a dramatic diminution of the effects of DNA damage on activation of p53 (3).
Our data have several potentially important implications for both the PI3K and p53 fields. It has long been known that p53 protein is activated during the process of human tumorigenesis. However, the specific nature of the “natural” inducer of p53 has been controversial. For example, though radiation and chemotherapeutic drugs can induce p53 activity, it is also true that p53 mutations routinely occur in untreated tumors. It has similarly been shown that hypoxia can lead to p53 activation, but it is also true that p53 mutations routinely occur in “liquid” tumors, such as leukemias and lymphomas. Finally, activated oncogenes, such as Ras and Myc, can clearly induce p53, but this induction has generally been shown in murine systems, often employing ectopic overexpression of the oncogene.
In contrast, our studies implicating PI3K activation as an important inducer of p53 have the following comparative strengths: (i) they implicate a commonly activated pathway as the upstream inducer; (ii) several of the most potent inducers of p53 (e.g., DNA damage and oncogenes) are known to also lead to PI3K pathway activation; (iii) PI3K pathway activation, though it occurs relatively late during human cancer pathogenesis, is still thought to precede p53 mutation; and (iv) our gene-targeting studies directly implicate endogenous PTEN and PIK3CA as p53 inducers in both untransformed and transformed human cells. Therefore, we believe that our studies provide a compelling argument pointing to mutational activation of PI3K signaling as a particularly important inducer of p53 in human cells.
Our data also have potentially important clinical implications. Much work is currently under way to develop PI3K inhibitors as potential anticancer therapeutics as a means to treat tumors harboring mutations in PTEN and PIK3CA. Though this is clearly an appealing strategy, our data predict that, when used in a p53-proficient setting, pharmacological inhibitors of PI3K might also have the adverse effect of alleviating p53-dependent tumor suppression. As such, it may be informative to stratify clinical trials of PI3K inhibitors based on p53 genotype, as our studies predict that PI3K inhibitors could be more efficacious in treating p53-deficient tumors.
Another prediction of the data presented here is that acquisition of mutations in PTEN or PIK3CA during human cancer pathogenesis would provide selective pressure for the acquisition of mutations in p53. Consistent with this prediction, many of the tumor types in which p53 mutations are most commonly found (e.g., adenocarcinoma of the colon, adenocarcinoma of the breast, and glioblastoma) also harbor mutations of PTEN or PIK3CA. Furthermore, Oki et al. have demonstrated in human gastric cancer specimens that tumors with inactivating mutations of PTEN are statistically more likely to also harbor mutations in p53 than tumors in which PTEN remains intact (40).
Our data also raise a number of intriguing questions. For example, we have demonstrated that activation of PI3K signaling by PTEN depletion leads to a senescence-like growth arrest in untransformed human cells, but we also clearly showed that activation of PI3K signaling can have transforming effects in other human cell types (e.g., MCF10A cells, HCT116 cells, and a variety of other human cancer cell lines with PTEN or PIK3CA mutations used in this and other studies). At first inspection, these data appear to suggest that PI3K activation leads to senescence in untransformed human cells but not in partially or completely transformed cell lines. We believe that the mechanism(s) for this difference in phenotypic response will likely be an interesting avenue for further study.
It will also be informative to identify the specific biochemical mechanism of p53 activation by activated PI3K signaling. In this study, we have demonstrated that Akt1 is an important upstream inducer of p53 activation. We also demonstrated that p14ARF is undetectable in cells in which p53 is activated in response to activated PI3K signaling, suggesting that p14ARF is dispensable. Further detailed biochemical and genetic studies will be required to provide more insight into this important regulatory relationship. It may also prove informative to determine if the well-known capacity of the PI3K pathway to undergo autoregulation may impact its ability to regulate p53 (31, 49).
In summary, we have demonstrated here that activation of PI3K signaling by mutations in PTEN or PIK3CA can activate p53-dependent growth suppression in human cells. When taken together with other recent studies, our data suggest that PI3K signaling may be a central node in the regulation of p53 (Fig. 12). Additional work is required to provide the detailed genetic and biochemical mechanisms for this effect and to further implicate PI3K signaling as an important endogenous inducer of p53 in human cancer.
FIG. 12.
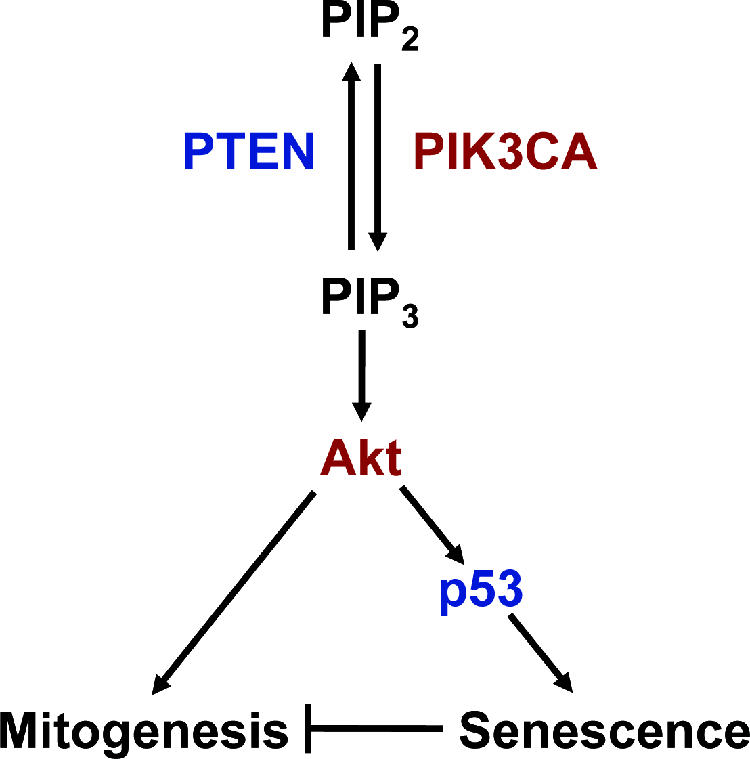
Model of p53 activation by PIP3 signaling. Inactivation of PTEN or activation of PIK3CA leads to an increase in cellular levels of PIP3 and subsequent activation of Akt. This leads to simultaneous activation of mitogenesis and activation of p53-dependent cellular senescence. Oncogenes are depicted in red and tumor suppressor genes in blue.
Acknowledgments
We thank Susette Mueller for assistance with microscopy, Karen Cresswell and Michelle Lombard for assistance with flow cytometry, Xiaojun Zou for assistance with microarray processing, Michael Johnson for advice on performing soft-agar assays, and Annabell Oh for advice on qRT-PCR.
This work was supported by National Institutes of Health grants K01 CA087828 and R01 CA115699 to T.W., American Cancer Society RPG MGO-112078 to T.W., and the Lombardi Comprehensive Cancer Center Support grant P30 CA051008. C.L.B. and C.L. were supported in part by NIH training grant T32 CA009686.
Footnotes
Published ahead of print on 23 October 2006.
REFERENCES
- 1.Atadja, P., H. Wong, I. Garkavtsev, C. Veilette, and K. Riabowol. 1995. Increased activity of p53 in senescing fibroblasts. Proc. Natl. Acad. Sci. USA 92:8348-8352. [DOI] [PMC free article] [PubMed] [Google Scholar]
- 2.Bachman, K. E., P. Argani, Y. Samuels, N. Silliman, J. Ptak, S. Szabo, H. Konishi, B. Karakas, B. G. Blair, C. Lin, B. A. Peters, V. E. Velculescu, and B. H. Park. 2004. The PIK3CA gene is mutated with high frequency in human breast cancers. Cancer Biol. Ther. 3:772-775. [DOI] [PubMed] [Google Scholar]
- 3.Bar, J., N. Lukaschuk, A. Zalcenstein, S. Wilder, R. Seger, and M. Oren. 2005. The PI3K inhibitor LY294002 prevents p53 induction by DNA damage and attenuates chemotherapy-induced apoptosis. Cell Death Differ. 12:1578-1587. [DOI] [PubMed] [Google Scholar]
- 4.Barbieri, C. E., C. E. Barton, and J. A. Pietenpol. 2003. ΔNp63α expression is regulated by the phosphoinositide 3-kinase pathway. J. Biol. Chem. 278:51408-51414. [DOI] [PubMed] [Google Scholar]
- 5.Brummelkamp, T. R., R. Bernards, and R. Agami. 2002. Stable suppression of tumorigenicity by virus-mediated RNA interference. Cancer Cell 2:243-247. [DOI] [PubMed] [Google Scholar]
- 6.Brunet, A., A. Bonni, M. J. Zigmond, M. Z. Lin, P. Juo, L. S. Hu, M. J. Anderson, K. C. Arden, J. Blenis, and M. E. Greenberg. 1999. Akt promotes cell survival by phosphorylating and inhibiting a Forkhead transcription factor. Cell 96:857-868. [DOI] [PubMed] [Google Scholar]
- 7.Bunz, F., P. M. Hwang, C. Torrance, T. Waldman, Y. Zhang, L. Dillehay, J. Williams, C. Lengauer, K. W. Kinzler, and B. Vogelstein. 1999. Disruption of p53 in human cancer cells alters the responses to therapeutic agents. J. Clin. Investig. 104:263-269. [DOI] [PMC free article] [PubMed] [Google Scholar]
- 8.Burns, T. F., P. Fei, K. A. Scata, D. T. Dicker, and W. S. El-Deiry. 2003. Silencing of the novel p53 target gene Snk/Plk2 leads to mitotic catastrophe in paclitaxel (taxol)-exposed cells. Mol. Cell. Biol. 23:5556-5571. [DOI] [PMC free article] [PubMed] [Google Scholar]
- 9.Chang, C. J., D. J. Freeman, and H. Wu. 2004. PTEN regulates Mdm2 expression through the P1 promoter. J. Biol. Chem. 279:29841-29848. [DOI] [PubMed] [Google Scholar]
- 10.Chen, Q. M., J. C. Bartholomew, J. Campisi, M. Acosta, J. D. Reagan, and B. N. Ames. 1998. Molecular analysis of H2O2-induced senescent-like growth arrest in normal human fibroblasts: p53 and Rb control G1 arrest but not cell replication. Biochem. J. 332:43-50. [DOI] [PMC free article] [PubMed] [Google Scholar]
- 11.Chen, Z., L. C. Trotman, D. Shaffer, H. K. Lin, Z. A. Dotan, M. Niki, J. A. Koutcher, H. I. Scher, T. Ludwig, W. Gerald, C. Cordon-Cardo, and P. P. Pandolfi. 2005. Crucial role of p53-dependent cellular senescence in suppression of PTEN-deficient tumorigenesis. Nature 436:725-730. [DOI] [PMC free article] [PubMed] [Google Scholar]
- 12.Datta, S. R., H. Dudek, X. Tao, S. Masters, H. Fu, Y. Gotoh, and M. E. Greenberg. 1997. Akt phosphorylation of BAD couples survival signals to the cell-intrinsic death machinery. Cell 91:231-241. [DOI] [PubMed] [Google Scholar]
- 13.de Stanchina, E., M. E. McCurrach, F. Zindy, S. Y. Shieh, G. Ferbeyre, A. V. Samuelson, C. Prives, M. F. Roussel, C. J. Sherr, and S. W. Lowe. 1998. E1A signaling to p53 involves the p19(ARF) tumor suppressor. Genes Dev. 12:2434-2442. [DOI] [PMC free article] [PubMed] [Google Scholar]
- 14.El-Deiry, W. S., T. Tokino, V. E. Velculescu, D. B. Levy, R. Parsons, J. M. Trent, D. Lin, W. E. Mercer, K. W. Kinzler, and B. Vogelstein. 1993. WAF1, a potential mediator of p53 tumor suppression. Cell 75:817-825. [DOI] [PubMed] [Google Scholar]
- 15.Freeman, D. J., A. G. Li, G. Wei, H. H. Li, N. Kertesz, R. Lesche, A. D. Whale, H. Martinez-Diaz, N. Rozengurt, R. D. Cardiff, X. Liu, and H. Wu. 2003. PTEN tumor suppressor regulates p53 protein levels and activity through phosphatase-dependent and -independent mechanisms. Cancer Cell 3:117-130. [DOI] [PubMed] [Google Scholar]
- 16.Graeber, T. G., J. F. Peterson, M. Tsai, K. Monica, A. J. Fornace, and A. J. Giaccia. 1994. Hypoxia induces accumulation of p53 protein, but activation of a G1-phase checkpoint by low-oxygen conditions is independent of p53 status. Mol. Cell. Biol. 14:6264-6277. [DOI] [PMC free article] [PubMed] [Google Scholar]
- 17.Hermeking, H., and D. Eick. 1994. Mediation of c-Myc-induced apoptosis by p53. Science 265:2091-2093. [DOI] [PubMed] [Google Scholar]
- 18.Hirata, R., J. Chamberlain, R. Dong, and D. W. Russell. 2002. Targeted transgene insertion into human chromosomes by adeno-associated virus vectors. Nat. Biotechnol. 20:735-738. [DOI] [PubMed] [Google Scholar]
- 19.Honda, R., and H. Yasuda. 1999. Association of p19(ARF) with Mdm2 inhibits ubiquitin ligase activity of Mdm2 for tumor suppressor p53. EMBO J. 18:22-27. [DOI] [PMC free article] [PubMed] [Google Scholar]
- 20.Isakoff, S. J., J. A. Engelman, H. Y. Irie, J. Luo, S. M. Brachmann, R. V. Pearline, L. C. Cantley, and J. S. Brugge. 2005. Breast cancer-associated PIK3CA mutations are oncogenic in mammary epithelial cells. Cancer Res. 65:10992-11000. [DOI] [PubMed] [Google Scholar]
- 21.Kang, S., A. G. Bader, and P. Vogt. 2005. Phosphatidylinositol 3-kinase mutations identified in human cancer are oncogenic. Proc. Natl. Acad. Sci. USA 102:802-807. [DOI] [PMC free article] [PubMed] [Google Scholar]
- 22.Karakas, B., K. E. Bachman, and B. H. Park. 2006. Mutation of the PIK3CA oncogene in human cancers. Br. J. Cancer 94:455-459. [DOI] [PMC free article] [PubMed] [Google Scholar]
- 23.Kastan, M. B., O. Onyekwere, D. Sidransky, B. Vogelstein, and R. W. Craig. 1991. Participation of p53 protein in the cellular response to DNA damage. Cancer Res. 51:6304-6311. [PubMed] [Google Scholar]
- 24.Kim, J. S., C. Lee, A. Foxworth, and T. Waldman. 2004. B-Raf is dispensable for K-Ras-mediated oncogenesis in human cancer cells. Cancer Res. 64:1932-1937. [DOI] [PubMed] [Google Scholar]
- 25.Kohli, M., C. Rago, C. Lengauer, K. W. Kinzler, and B. Vogelstein. 2004. Facile methods for generating human somatic cell gene knockouts using recombinant adeno-associated viruses. Nucleic Acids Res. 32:e3. [DOI] [PMC free article] [PubMed] [Google Scholar]
- 26.Kurose, K., K. Gilley, S. Matsumoto, P. H. Watson, X. P. Zhou, and C. Eng. 2002. Frequent somatic mutations in PTEN and TP53 are mutually exclusive in the stroma of breast carcinomas. Nat. Gen. 32:355-357. [DOI] [PubMed] [Google Scholar]
- 27.Lee, C., J. S. Kim, and T. Waldman. 2004. PTEN gene targeting reveals a radiation-induced size checkpoint in human cancer cells. Cancer Res. 64:6906-6914. [DOI] [PMC free article] [PubMed] [Google Scholar]
- 28.Li, J., C. Yen, D. Liaw, K. Podsypanina, S. Bose, S. I. Wang, J. Puc, C. Miliaresis, L. Rodgers, R. McCombie, S. H. Bigner, B. C. Givanella, M. Ittmann, B. Tycko, H. Hibshoosh, M. H. Wigler, and R. Parsons. 1997. PTEN, a putative protein tyrosine phosphatase gene mutated in human brain, breast, and prostate cancer. Science 275:1943-1947. [DOI] [PubMed] [Google Scholar]
- 29.Li, P., J. Wong, A. Ayed, D. Ngo, A. M. Brade, C. Arrowsmith, R. C. Austin, and H. J. Klamut. 2000. Placental transforming growth factor-β is a downstream mediator of the growth arrest and apoptotic response of tumor cells to DNA damage and p53 overexpression. J. Biol. Chem. 275:20127-20135. [DOI] [PubMed] [Google Scholar]
- 30.Llanos, S., P. A. Clark, J. Rowe, and G. Peters. 2001. Stabilization of p53 by p14ARF without relocation of MDM2 to the nucleolus. Nat. Cell Biol. 3:445-452. [DOI] [PubMed] [Google Scholar]
- 31.Luo, J., S. J. Field, J. Y. Lee, J. A. Engelman, and L. C. Cantley. 2005. The p85 regulatory subunit of phosphoinositide 3-kinase down-regulates IRS-1 signaling via the formation of a sequestration complex. J. Cell Biol. 170:455-464. [DOI] [PMC free article] [PubMed] [Google Scholar]
- 32.Maehama, T., and J. E. Dixon. 1998. PTEN/MMAC1 The tumor suppressor, dephosphorylates the lipid second messenger, phosphatidylinositol 3,4,5-trisphosphate. J. Biol. Chem. 273:13375-13378. [DOI] [PubMed] [Google Scholar]
- 33.Manning, B. D., A. R. Tee, M. N. Logsdon, J. Blenis, and L. C. Cantley. 2002. Identification of the tuberous sclerosis complex-2 tumor suppressor gene product tuberin as a target of the phosphoinositide 3-kinase/Akt pathway. Mol. Cell 10:151-162. [DOI] [PubMed] [Google Scholar]
- 34.Mayo, L. D., and D. B. Donner. 2001. A phosphatidylinositol 3-kinase/Akt pathway promotes translocation of Mdm2 from the cytoplasm to the nucleus. Proc. Natl. Acad. Sci. USA 98:11598-11603. [DOI] [PMC free article] [PubMed] [Google Scholar]
- 35.Midgley, C. A., J. M. Desterro, M. K. Saville, S. Howard, A. Sparks, R. T. Hay, and D. P. Lane. 2000. An N-terminal p14ARF peptide blocks Mdm2-dependent ubiquitination in vitro and can activate p53 in vivo. Oncogene 19:2312-2323. [DOI] [PubMed] [Google Scholar]
- 36.Mitsuuchi, Y., S. W. Johnson, M. Selvakumaran, S. J. Williams, T. C. Hamilton, and J. R. Testa. 2000. The phosphatidylinositol 3-kinase/Akt signal transduction pathway plays a critical role in the expression of p21WAF1/CIP1/SDI1 induced by cisplatin and paclitaxel. Cancer Res. 60:5390-5394. [PubMed] [Google Scholar]
- 37.Moffat, J., D. A. Grueneberg, X. Yang, S. Y. Kim, A. M. Kloepfer, G. Hinkle, B. Piqani, T. M. Eisenhaure, B. Luo, J. K. Grenier, A. E. Carpenter, S. Y. Foo, S. A. Stewart, B. R. Stockwell, N. Hacohen, W. C. Hahn, E. S. Lander, D. M. Sabatini, and D. E. Root. 2006. A lentiviral RNAi library for human and mouse genes applied to an arrayed viral high-content screen. Cell 124:1283-1298. [DOI] [PubMed] [Google Scholar]
- 38.Muller, A. J., J. C. Young, A. M. Pendergast, M. Pondel, N. R. Landau, D. R. Littman, and O. N. Witte. 1991. BCR first exon sequences specifically activate the BCR/ABL tyrosine kinase oncogene of Philadelphia chromosome-positive human leukemias. Mol. Cell. Biol. 11:1785-1792. [DOI] [PMC free article] [PubMed] [Google Scholar]
- 39.Oda, E., R. Ohki, H. Murasawa, J. Nemoto, T. Shibue, T. Yamashita, T. Tokino, T. Taniguchi, and N. Tanaka. 2000. NOXA, a BH3-only member of the Bcl-2 family and candidate mediator of p53-induced apoptosis. Science 288:1053-1058. [DOI] [PubMed] [Google Scholar]
- 40.Oki, E., E. Tokunaga, T. Nakamura, N. Ueda, M. Futatsugi, K. Mashino, M. Yamamoto, M. Watanabe, M. Ikebe, Y. Kakeji, H. Baba, and Y. Maehara. 2005. Genetic mutual relationship between PTEN and p53 in gastric cancer. Cancer Lett. 227:33-38. [DOI] [PubMed] [Google Scholar]
- 41.Polyak, K., Y. Xia, J. L. Zweier, K. W. Kinzler, and B. Vogelstein. 1997. A model for p53-induced apoptosis. Nature 389:300-305. [DOI] [PubMed] [Google Scholar]
- 42.Rena, G., S. Guo, S. C. Cichy, T. G. Unterman, and P. Cohen. 1999. Phosphorylation of the transcription factor forkhead family member FKHR by protein kinase B. J. Biol. Chem. 274:17179-17183. [DOI] [PubMed] [Google Scholar]
- 43.Saal, L. H., K. Holm, M. Maurer, L. Memeo, T. Su, X. Wang, J. S. Yu, P. O. Malmstrom, M. Mansukhani, J. Enoksson, H. Hibshoosh, A. Borg, and R. Parsons. 2005. PIK3CA mutations correlate with hormone receptors, node metastasis, and ERBB2, and are mutually exclusive with PTEN loss in human breast carcinoma. Cancer Res. 65:2554-2559. [DOI] [PubMed] [Google Scholar]
- 44.Samuels, Y., A. Diaz, O. Schmidt-Kittler, J. M. Cummins, L. DeLong, I. Cheong, C. Rago, D. L. Huso, C. Lenaguer, K. W. Kinzler, B. Vogelstein, and V. E. Velculescu. 2005. Mutant PIK3CA promotes cell growth and invasion of human cancer cells. Cancer Cell 7:561-573. [DOI] [PubMed] [Google Scholar]
- 45.Samuels, Y., Z. Wang, A. Bardelli, N. Silliman, J. Ptak, S. Szabo, H. Yan, A. Gazdar, S. M. Howell, G. J. Riggins, J. K. Willson, S. Markowitz, K. W. Kinzler, B. Vogelstein, and V. E. Velculescu. 2004. High frequency of mutations of the PIK3CA gene in human cancers. Science 304:554. [DOI] [PubMed] [Google Scholar]
- 46.Sedelnikova, O. A., I. Horikawa, D. B. Zimonjic, N. C. Popescu, W. M. Bonner, and J. C. Barrett. 2004. Senescing human cells and ageing mice accumulate DNA lesions with unrepairable double-strand breaks. Nat. Cell Biol. 6:168-170. [DOI] [PubMed] [Google Scholar]
- 47.Serrano, M., A. W. Lin, M. E. McCurrach, D. Beach, and S. W. Lowe. 1997. Oncogenic ras provokes premature cell senescence associated with accumulation of p53 and p16INK4a. Cell 88:593-602. [DOI] [PubMed] [Google Scholar]
- 48.Shirasawa, S., M. Furuse, N. Yokoyama, and T. Sasazuki. 1993. Altered growth of human colon cancer cell lines disrupted at activated Ki-ras. Science 260:85-88. [DOI] [PubMed] [Google Scholar]
- 49.Simpson, L., J. Li, D. Liaw, I. Hennessy, J. Oliner, F. Christians, and R. Parsons. 2001. PTEN expression causes feedback upregulation of insulin receptor substrate 2. Mol. Cell. Biol. 21:3947-3958. [DOI] [PMC free article] [PubMed] [Google Scholar]
- 50.Steck, P. A., M. A. Pershouse, S. A. Jasser, W. K. Yung, H. Lin, A. H. Ligon, L. A. Langford, M. L. Baumgard, T. Hattier, T. David, C. Frye, R. Hu, B. Swedlund, D. H. Teng, and S. V. Tavtigian. 1997. MMAC1 identification of a candidate tumour suppressor gene, at chromosome 10q23.3 that is mutated in multiple advanced cancers. Nat. Genet. 15:356-362. [DOI] [PubMed] [Google Scholar]
- 51.Stott, F. J., S. Bates, M. C. James, B. B. McConell, M. Starborg, S. Brookes, I. Palmero, K. Ryan, E. Hara, K. H. Vousden, and G. Peters. 1998. The alternative product from the human CDKN2A locus, p14 (ARF), participates in a regulatory feedback loop with p53 and MDM2. EMBO J. 17:5001-5014. [DOI] [PMC free article] [PubMed] [Google Scholar]
- 52.Tischler, R. B., D. B. Lamppu, S. Park, and D. B. Price. 1995. Microtubule-active drugs taxol, vinblastine, and nocodazole increase the levels of transcriptionally active p53. Cancer Res. 55:6021-6025. [PubMed] [Google Scholar]
- 53.Wu, X., K. Senechal, M. S. Neshat, Y. E. Whang, and C. L. Sawyers. 1998. The PTEN/MMAC1 tumor suppressor phosphatase functions as a negative regulator of the phosphoinositide 3-kinase/Akt pathway. Proc. Natl. Acad. Sci. USA 95:15587-15591. [DOI] [PMC free article] [PubMed] [Google Scholar]
- 54.Yang, C. T., L. You, C. C. Yeh, J. W. C. Chang, F. Zhang, F. McCormick, and D. M. Jablons. 2000. Adenovirus-mediated p14ARF gene transfer in human mesothelioma cells. J. Natl. Cancer Inst. 92:636-641. [DOI] [PubMed] [Google Scholar]
- 55.Zindy, F., C. M. Eischen, D. H. Randle, T. Kamijo, J. L. Cleveland, C. J. Sherr, and M. F. Roussel. 1998. Myc signaling via the ARF tumor suppressor regulates p53-dependent apoptosis and immortalization. Genes Dev. 12:2424-2433. [DOI] [PMC free article] [PubMed] [Google Scholar]