Abstract
This letter describes a data acquisition setup for recording, and processing, running speech from a person in a magnetic resonance imaging (MRI) scanner. The main focus is on ensuring synchronicity between image and audio acquisition, and in obtaining good signal to noise ratio to facilitate further speech analysis and modeling. A field-programmable gate array based hardware design for synchronizing the scanner image acquisition to other external data such as audio is described. The audio setup itself features two fiber optical microphones and a noise-canceling filter. Two noise cancellation methods are described including a novel approach using a pulse sequence specific model of the gradient noise of the MRI scanner. The setup is useful for scientific speech production studies. Sample results of speech and singing data acquired and processed using the proposed method are given.
INTRODUCTION
In recent years, magnetic resonance imaging has become a viable tool for investigating speech production. Technological advances have enabled studying the structure of the vocal tract, and its dynamical shaping, during speech production. For example, tongue deformation characteristics have been studied with a cine-magnetic resonance imaging (MRI) technique1 and a real-time magnetic resonance (MR) imaging technique described in Ref. 2 has been successfully used to capture the changing midsagittal shape of the vocal tract during speech production. One methodological challenge, however, is in synchronizing the acquisition of an audio signal with the collection of time-varying vocal tract images, which is important for any subsequent analysis and modeling of the acoustic-articulatory relation. In Ref. 1 the audio signal was recorded in a separate procedure after the MR images were collected so that synchronicity of the signals and images could be only approximately achieved through extensive training of the subject and with a restriction to few utterances.
There have been few studies where MR images and audio signals were obtained simultaneously. The problem is posed by the high intensity gradient noise caused by the scanner, which is in the audible frequency range. This degrades the audio signal such that acoustic analysis of the speech content is difficult, if not impossible. Previous studies such as Ref. 3 have addressed this problem using a correlation-subtraction method, where one captures the noise signal separately and relies on its stationarity. This method does not, however, account for nonstationary noise sources such as body movement of the subject or vibration of the cooling pump.
There are commercially available noise mitigation solutions that have been used in some MRI studies, such as the one by Phone-OR4,5 which provides an integrated MR-compatible fiber-optical microphone system that allows both real-time and offline noise cancellation. This proprietary system is described to use a special microphone assembly which houses two transducers, one to capture the speech signal and one to capture only the ambient noise. The two microphones are mounted in close proximity but their directional characteristics are at a 90 deg angle so that one (main) microphone is oriented towards the mouth of the subject to capture the speech signal and the other (reference) microphone is oriented such that it rejects the speech signal and captures only the ambient noise. In our own experiments with this system, however, the reference signal contained a strong speech signal component and the subsequent noise cancellation procedure would remove the desired speech signal in addition to the noise to an extent that was undesirable for further analysis of the signal!
The purpose of this letter is to describe the development of an alternative system in which a separate fiber optical microphone was located away from the subject and outside the magnet, but inside the scanner room, in a place where it captures almost exclusively the ambient noise and not the subject's speech. This system captures the audio and the MR images simultaneously and ensures absolute synchronicity for spontaneous speech and other vocal productions including singing.
SYSTEM LEVEL DESCRIPTION OF THE DATA ACQUISITION SYSTEM
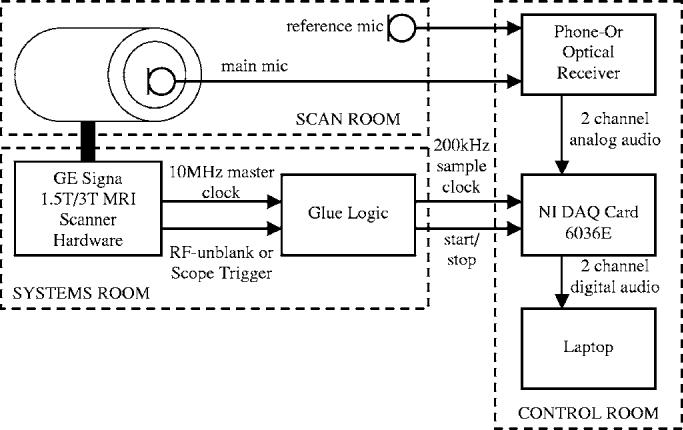
Figure 1 illustrates how the various components of the data acquisition system are located in the scan room, the systems room, and the control room of the MRI facility. Two fiber optical microphones are located in the scan room. The main microphone is approximately 0.5 in. (1.3 cm) away from the subject's mouth at a 20 deg angle, and the reference microphone is positioned on the outside of the magnet, roughly 3 ft. (0.9 m) away from the sidewall at a height of about 4 ft. (1.2 m). The microphones connect to the optical receiver box, which is located in the MRI control room.
FIG. 1.

System level diagram of the audio acquisition system.
The data are recorded on a laptop computer using a National Instruments NI-DAQ 6036E PCMCIA card,6 which provides a total sample rate of 200 kHz and supports up to 16 analog input channels. The main and the reference microphone signal are sampled at 100 kHz each.
In order to guarantee sample-exact synchronicity the audio sample clock is derived from the MRI scanner's 10 MHz master clock. Furthermore, the audio recording is started and stopped using the radio frequency (rf)-unblank signal of the scanner with the help of some interfacing glue logic. This mechanism is described in detail in the following section.
SYNCHRONIZING HARDWARE
The GE Signa scanner provides a digital 10 MHz master clock signal to its MRI excitation and readout sequencer circuits, which is also available on the scanner's service interface. Furthermore, the scanner allows access to the so-called rf-unblank TTL signal, which is a short low-pulse in the beginning of each MRI acquisition.
The key part of the data acquisition system is the field-programmable gate array (FPGA)-based digital glue logic that interfaces the MRI scanner hardware to the audio analog-to-digital converter (ADC) on the NI-DAQ card. The logic circuitry was implemented on a DIGILAB 2 XL board,7 which contains a XILINX Spartan two FPGA.8
The digital glue logic consists of two independent systems, namely a clock divider and a retriggerable monostable. The clock divider derives a 200 kHz clock signal from the 10 MHz master clock, which is used to clock the ADC on the NI-DAQ card, resulting in a sampling rate of 100 kHz for each of the two microphone channels.
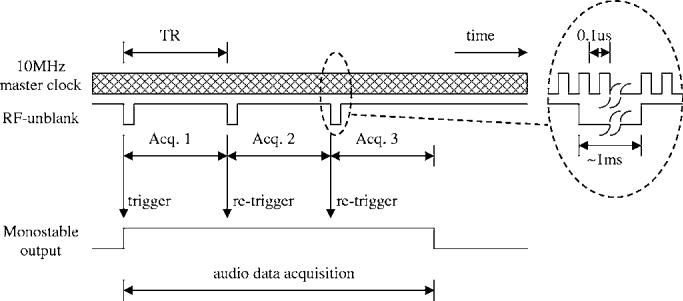
The retriggerable monostable vibrator has a time constant which equals the MRI repetition time, TR. The monostable is (re-)triggered on the falling edge of each rfunblank pulse, i.e., in the beginning of each MRI acquisition.
If a number of MRI acquisitions are performed consecutively a train of rf-unblank low pulses is observed with a time distance of TR. Each rf-unblank pulse retriggers the monostable and keeps its output high during the entire acquisition period. This process is shown in Fig. 2, where we assume a series of three consecutive MRI acquisitions.
FIG. 2.

Glue logic timing diagram.
The output of the monostable is used as an enable signal for the NI-DAQ ADC. This mechanism turns on the analog-to-digital conversion with the first MRI acquisition in a series and stops it as soon as the rf-unblank pulses disappear, i.e., exactly one TR after the last unblank pulse of the acquisition series was observed.
The enable delay of the NI-DAQ card is on the order of 100 ns which is negligible with respect to the audio sample time of 50 μs at 20 kHz. Therefore, the audio recording begins almost exactly when the MRI acquisitions start. And since the ADC sample clock is directly derived from the MRI scanner's 10 MHz clock signal, which governs the image acquisition, the audio and the MRI images are always exactly synchronized.
SOFTWARE COMPONENTS
Data acquisition and sample rate conversion
The real-time data acquisition routine was written in matlab9 and it uses the Data Acquisition Toolbox. In the first postprocessing step, low-pass filtering and decimation of the audio data to a sampling frequency of 20 kHz is carried out. Finally, the processed audio is merged with the reconstructed MRI image sequence using the VirtualDub software.10
Noise cancellation
The proposed hardware setup allows for a variety of noise canceling solutions. We describe two noise cancellation methods that we developed: a direct adaptive cancellation method using the well-known normalized least mean square (NLMS) algorithm, and a novel, model-based adaptive cancellation procedure, which yielded the best results in our speech and singing production experiments.
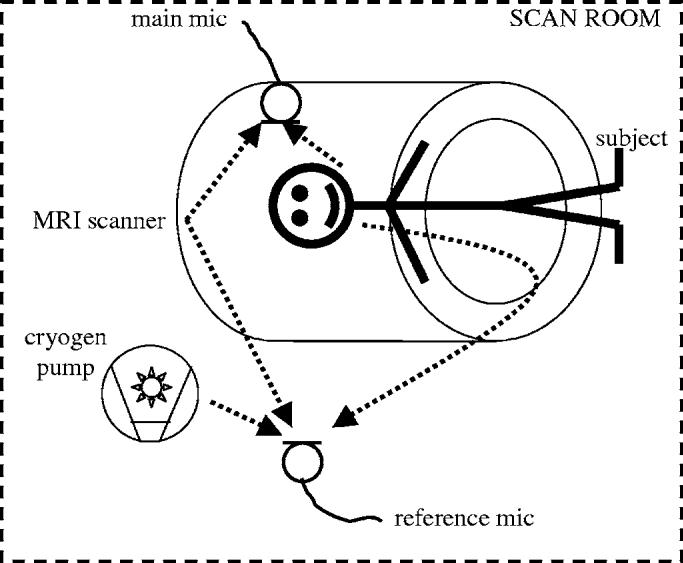
Figure 3 illustrates the location of the microphones and the main sources of noise in the scan room in the proposed set up, namely the subject, the MRI scanner, and the cryogen pump. The dotted lines symbolize the path of the sound, omitting the reflections on the walls of the scan room: The subject's speech is first of all picked up by the main microphone, but there is also a leakage path to the reference microphone. The MRI gradient noise is picked up by both the main and the reference microphone through different paths and, hence, with different time delays and different filtering, but with similar intensity. Last, the cryogen pump noise affects mainly the reference channel.
FIG. 3.

Noise sources and microphone arrangement.
The GE Signa scanner also has an integrated cooling fan which produces some air flow through the bore of the mag net. The fan may also produce additional noise but can be turned off during the scan. In our experiments, however, we found the fan noise negligible.
It should be noted that the MRI gradient noise is by far the strongest of all noise sources. But despite its high power, it also has some advantageous characteristics, namely it is stationary, periodic, and directly dependent on the MRI pulse sequence. In our case we used a 13-interleaf spiral gradient-echo sequence with an echo time TE of 0.9 ms, and a repetition time TR of 6.856 ms, which results in a period of 89.12 ms. This means that the scan noise can be thought of as a periodic function with a fundamental frequency of 11.22 Hz. As will be shown below, this characteristic can be exploited to achieve very good noise cancellation results within a modeled-reference framework.
Direct NLMS noise cancellation
In order to overcome the above-mentioned limitations, a noise cancellation procedure was developed which is based on the well-known NLMS algorithm.11,12 The corresponding system diagram is shown in Fig. 4: The MRI gradient noise is assumed to be filtered by two independent linear systems H1 and H2, which represent the acoustic characteristics of the room, before it enters the main and reference channel microphones, respectively. The speech signal on the other hand is captured directly by the main channel microphone.
FIG. 4.

Adaptive FIR filter using NLMS algorithm for direct cancellation of interference from MRI scanner noise.
During the postprocessing, the reference signal is fed into an adaptive finite-impulse response (FIR) filter, and subsequently subtracted from the main channel. The NLMS algorithm continually adjusts the FIR filter coefficients in such a way that the average output signal power is minimized. Or, in other words, the adaptive FIR filter is continuously adjusted in a way that it best approximates the transfer function H1/H2.
Since the noise cancellation is done off-line in our setup, the FIR filter is allowed to be noncausal and the noise cancellation can be achieved regardless whether the time delay between main and reference channel is positive or negative.
The adaptive FIR filter in our case was of order 4000, and the sampling frequency was 20 kHz. The updating coefficient was set to 0.5. The achieved noise reduction was around 17 dB. Further details are provided in the Results section.
Model-based NLMS noise cancellation
A much improved noise reduction was achieved using an artificial reference signal, which is generated based on a pulse-sequence specific model for the MRI gradient noise, rather than the reference signal captured during the scan. The corresponding system diagram is shown in Fig. 5. Hereby we exploit the periodic nature of the gradient noise, and we generate a signal consisting of the sum of unity-amplitude sinusoids of the fundamental frequency of the MRI scan noise, e.g., 11.22 Hz, and all integer multiples up to half the audio sampling frequency: 11.22, 22.44,…,9996.86 Hz. Hence, this signal contains all spectral components that the periodic gradient noise wave form can possibly have in the audio frequency band. The signal now serves as the reference for an NLMS noise canceller with a FIR filter of order 4000, with an updating coefficient of 0.5. The achieved noise suppression was around 32 dB, and details are provided in the Results section.
FIG. 5.

Adaptive FIR filter using NLMS algorithm for model-based cancellation of interference from MRI scanner noise.
The disadvantage of this model-based procedure is that it does not account for other noise sources than the MRI scanner, such as the cryogen pump. The major advantage of this approach, however, is that there is no leakage of the desired signal, i.e., the subject's speech, into the reference channel. Though it might be possible to find a more accurate reference signal model which also includes the cryogen pump, we found that the cancellation of the MRI gradient noise alone provides an output signal with sufficient quality for further analysis.
Another advantage of the model-based procedure is that it lends itself to real-time implementations since even non-causal noise canceling FIR filters are implementable because the modeled reference signal is deterministic.
RESULTS
In order to quantify the effectiveness of the noise cancellation algorithms a 30 s silence recording was obtained, i.e., without any speech activity, and the average output signal power was measured. Table I summarizes the achieved noise suppression for unweighted, A-weighted,13,14 and ITU-R 468 (1 kHz) weighted output power measurements.15,16
TABLE I.
Noise power suppression for the two presented methods during no speech.
| Noise power suppression in silence recording |
|||
|---|---|---|---|
| Unweighted (dB) | A-weighted (dB) | ITU-R468 (1 kHz) (dB) | |
| Direct NLMS | 17.1 | 17.6 | 16.3 |
| Model-based NLMS | 32.8 | 31.1 | 32.7 |
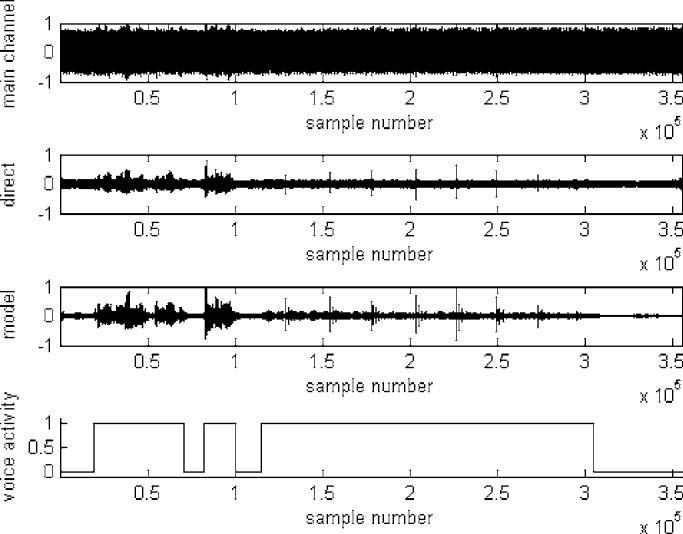
The verification of the noise canceller for recordings with speech and/or singing is more difficult since one cannot simply separate the signal and the noise in the recordings and measure their power independently. However, an estimate of the signal to noise ratio (SNR) was obtained by measuring the signal power during speech periods, Pspeech+noise, and scan noise-only periods, Pnoise, for a given recording. Due to the stationarity of the noise, and the independence of the noise and speech processes, we can compute the signal power as Pspeech = Pspeech+noise − Pnoise. The SNR for the given recording can now be expressed as SNR= Pspeech/ Pnoise =(Pspeech+noise − Pnoise)/ Pnoise. This computation was carried out for the original main channel recording, the direct noise-cancelled output, and the model-based noise-cancelled output. The improvements in SNR with respect to the original recording are summarized in Table II. The corresponding signal wave forms are shown in Fig. 6. Here we see the main channel recording, the directly noise-cancelled output, the model-based noise-cancelled output, and the voice activity flag of the sample utterance “We look forward to your abstracts by December 19th. Happy holidays! [singing].”
TABLE II.
Noise power suppression for the two presented methods during speech.
| Noise power suppression in speech recording |
|||
|---|---|---|---|
| Unweighted (dB) | A-weighted (dB) | ITU-R468 (1 kHz) (dB) | |
| Direct NLMS | 17.2 | 18.5 | 13.3 |
| Model-based NLMS | 28.4 | 29.7 | 26.5 |
FIG. 6.

Sample wave forms for SNR estimation.
Furthermore, we observed a slight echo-like artifact in the audio output signal most likely believed to result from the following: After convergence (say in a no-speech period), the adaptive noise canceller acts like a comb filter and effectively nulls out all frequencies that are integer multiples of the gradient noise fundamental. If now suddenly a speech signal appears, which generally has energy at those frequencies, the noise-canceling filter will take some time to adapt and again block out these frequencies. When the speech segment is over, the filter again needs a short time to converge back to the no-speech setting. During this time the audio output obviously contains a residue of the reference signal causing a reverberant effect.
As a possible remedy for this effect, one can make the adaptation of the filter dependent on voice activity, such that during the no-speech phases the filter adapts fast, whereas during speech phases the adaptation is slow, or even turned off completely.
Various video and audio clips are provided on the web at 〈http://sail.usc.edu/span/jasa_letter/index.php〉 to demonstrate the achieved signal quality. Overall, our model-based NLMS procedure appears to be most attractive since it achieves good noise suppression, requires only a single microphone and is easily implementable. Future improvements may include an improvement of the model to include the cryogen pump.
ACKNOWLEDGMENTS
This work was supported by NIH Grant No. R01 DC007124-01. The authors thank their team members especially D. Byrd and S. Lee, as well as USC's Imaging Science Center.
References
- 1.Stone M, Davis E, Douglas A, NessAiver M, Gullapalli R, Levine W, Lundberg A. Modelling the motion of the internal tongue from tagged cine-MRI images. J. Acoust. Soc. Am. 2001;109:2974–2982. doi: 10.1121/1.1344163. [DOI] [PubMed] [Google Scholar]
- 2.Narayanan S, Nayak K, Sethy A, Byrd D. An approach to real-time magnetic resonance imaging for speech production. J. Acoust. Soc. Am. 2004;115:1771–1776. doi: 10.1121/1.1652588. [DOI] [PubMed] [Google Scholar]
- 3.NessAiver M, Stone M, Parthasarathy V, Kahana Y, Paritsky A. Recording high quality speech during tagged Cine MRI studies using a fiber optic microphone. J. Magn. Reson Imaging. 2006;23:92–97. doi: 10.1002/jmri.20463. [DOI] [PubMed] [Google Scholar]
- 4. http://phone-or.com, last seen 02/28/2006.
- 5.Kahana Y, Paritsky A, Kots A, Mican S. Recent advances in optical microphone technology. Proc. of the 32nd International Congress and Exposition on Noise Control Engineering 2003 [Google Scholar]
- 6. http://www.ni.com, last seen 02/28/2006.
- 7. http://www.digilentinc.com, last seen 02/28/2006.
- 8. http://www.xilinx.com, last seen 02/28/2006.
- 9. http://www.themathworks.com, last seen 02/28/2006.
- 10. http://www.virtualdub.org, last seen 02/28/2006.
- 11.Haykin S. Adaptive Filter Theory. Prentice Hall; Upper Saddle River, NJ: 2001. [Google Scholar]
- 12.Jones D. Normalized LMS. http://cnx.rice.edu/content/m11915/latest/, last seen 02/28/2006.
- 13. http://en.wikipedia.org/wiki/A-weighting, last seen 02/28/2006.
- 14. IEC 179 standard available at http://www.iec.ch/.
- 15. http://en.wikipedia.org/wiki/Standard:ITU-R-468, last seen 06/12/06.
- 16. ITU-R 468 standard available at http://www.itu.int/.


